
RESEARCH Open Access
Plasma proteomic profile of sulfur mustard
exposed lung diseases patients using 2-
dimensional gel electrophoresis
Hossein Mehrani
1*
, Mostafa Ghanei
2
, Jafar Aslani
2
and Zahra Tabatabaei
1
* Correspondence:
hosseinmehrani@ymail.com
1
Laboratory of Proteomics, and
Chemical Injuries Research Center,
Baqiyatallah University of Medical
Sciences, Tehran, Iran
Full list of author information is
available at the end of the article
Abstract
Introduction: Sulfur mustard “bis (2-chlroethyl) sulphide”(SM) is a chemical warfare
agent that remains a threat to human health. The aim of this study was to identify
protein expression signature or biomarkers that reflect chronic lung damages
induced by SM exposure.
Methods: Prior to analysis, plasma was fractionated using ethanol precipitation.
Using two dimensional SDS-PAGE; fractionated protein profiles of 20 healthy and 20
exposed patients with lung diseases were established. Selected protein spots were
successfully identified with MALDI TOF MS/MS.
Results: The results show that a1 haptoglobin isoforms were detected in plasma of
the all lung disease patients but none of the healthy controls. Amyloid A1 isoforms
was also detected in plasma of the lung disease patients but none of the healthy
controls. Moreover, low molecular weight proteins were enriched in ethanol
supernatant compared to ethanol precipitate.
Conclusion: Our present results and previous studies suggest that ongoing tissue
remodeling is involved in SM exposed lung damage patients. These finding might
improve patient care and suitable therapies.
Introduction
Sulfur mustard is a chemical warfare agent that remains a threat to human health..
More than lethality, SM causes debilitating effects that can leave an exposed individual
incapacitated for days, months, or years. Lung injury is a common health problem
after inhalation, which leads to chronic bronchitis and interstitial lung diseases [1].
The clinical picture of the poisoning is well known from the thousands of victims dur-
ing World War I and the recent Iran-Iraq conflict. In the latter, sulfur mustard was
heavily used and at the present time about 30,000 victims still suffer from late effects
of the agent, such as chronic obstructive lung disease, lung fibrosis, recurrent corneal
ulcer disease, and chronic conjunctivitis [2]. Late complications of mustard gas expo-
sure and main clinical findings include; chronic bronchitis, bronchiectasis and bronch-
iolitis obliterans (BO) [3-5]. However, Clinical manifestation in lung disorders due to
sulfur mustard is different from other lung diseases, due to the fact that mustard lung
is not responsive to corticosteroids. There is no common consensus about the
Mehrani et al.Clinical Proteomics 2011, 8:2
http://www.clinicalproteomicsjournal.com/content/8/1/2
CLINICAL
PROTEOMICS
© 2011 Mehrani et al; licensee BioMed Central Ltd. This is an Open Access article distributed under the terms of the Creative Commons
Attribution License (http://creativecommons.org/licenses/by/2.0), which permits unrestricted use, distribution, and reproduction in
any medium, provided the original work is properly cited.

pathophysiological basis of chronic pulmonary disease caused by this chemical warfare
agent [6].
Proteomics technologies can identify and quantify novel proteins in the plasma that
can function as biomarkers of the presence or severity of disease states. In general,
human plasma proteome profiling is challenging. Albumin is present at about 40 mg/
ml and several other proteins are highly abundant including immunoglobulins (IgGs),
transferrin and fibrinogen which typically constitute greater than 90% of total protein
mass [7]. These abundant proteins may hinder the detection of low-abundant proteins
that can be of specific interest in the search for biomarkers of disease [8]. However, it
is the low abundant proteins that are most likely to be biologically relevant as the mar-
kers of a disease state. For analysis of low-abundant proteins in plasma, many strate-
gies have been developed for the selective removal of albumin and other high-
abundance proteins. Albumin can be removed by immune affinity columns chromato-
graphy [9], isoelectric trapping [10], heparin chromatography [11] and peptide affinity
chromatography [12]. However, it is well known that albumin and other high-abun-
dance proteins may also act as carrier or transport proteins and thus are likely to bind
many species of interest, such as peptide hormones, cytokines, and chemokines.
There are wide-ranging interests in using the proteomics approach to define markers
of lung disease. Although respiratory tract lesions represent the major disability after
SMexposure,onlyafewstudieshaveinvestigatedthelongtermpathophysiologyof
SM induced respiratory damages, in particular their proteomes. We have recently
examined the proteomics pattern in bronchoalveolar lavage (BAL) fluid of SM exposed
patients and identified families of proteins whose expression is up or down regulated
compared to healthy controls [13]. Plasma proteins and peptides are from almost every
tissue and cell, and their change in quantity and quality is specific not only to the tis-
sue affected by disease, but also to the disease process itself. In addition, plasma is the
most easily accessible, less invasive, and widely collected sample.
We attempted to explore plasma proteomics patterns of these patients, using ethanol
fractionation. Tow-dimensional gel electrophoresis was applied and followed by
MALDI-TOF MS to look for new markers in the plasma of exposed patients which
may help in further understanding the nature of long term effects of mustard gas.
These finding might improve patient care and finding suitable therapies.
Results
The plasma protein content of the patients and the controls are presented in Table 1.
No significant differences were observed in plasma protein contents of patients and
controls.
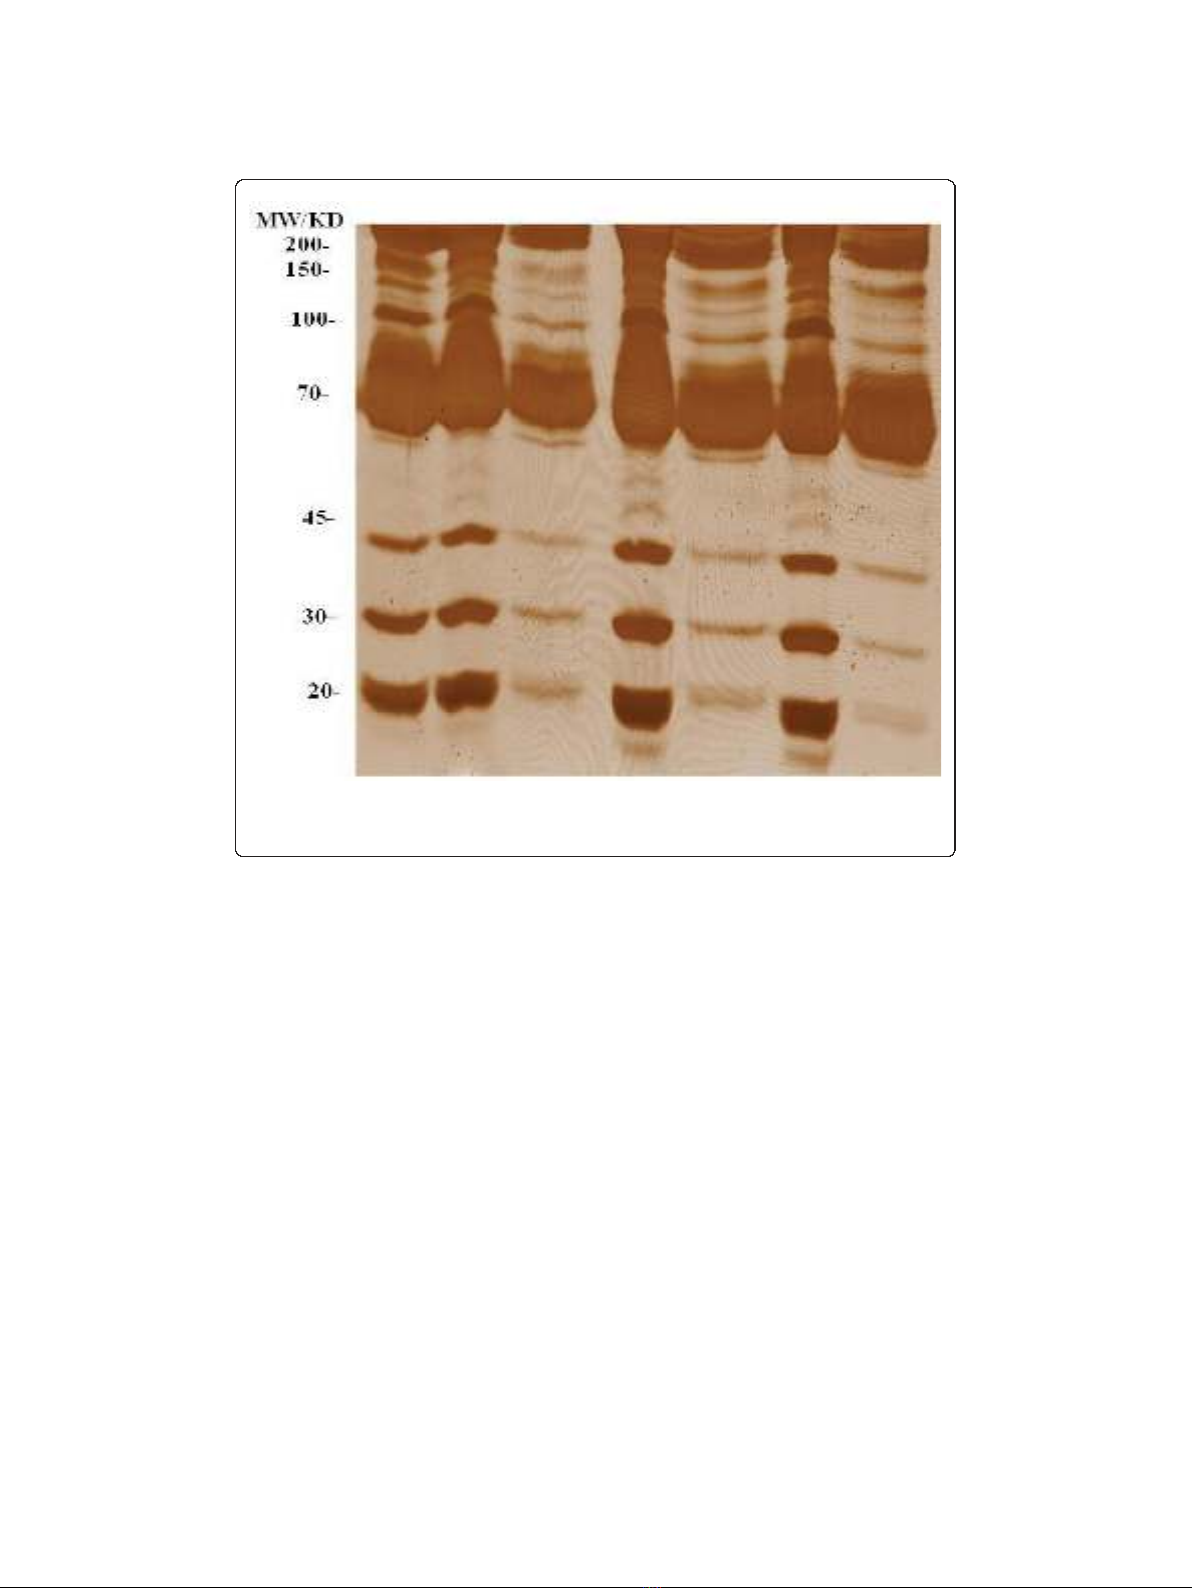
The ethanol fractionation was used to enrich low molecular weight proteins. As
shown in Figure 1, most of the low molecular weight proteins were enriched in the
ethanol supernatant rather than the precipitate. We found that 50% (v/v) ethanol was
more efficient in fractionating low molecular weight proteins. To avoid any protein
Table 1 Age and plasma protein concentrations of patients and control subjects
a
Variables Healthy Controls Severe Patients
Age (year) 40.1 ± 3.6 43.6 ± 2.8
Protein in plasma (mg/ml) 71.6 ± 3.1 72.4 ± 5.3
a. Data are mean ± SEM (n = 20 in each group).
Mehrani et al.Clinical Proteomics 2011, 8:2
http://www.clinicalproteomicsjournal.com/content/8/1/2
Page 2 of 11
losses from the sample, we used both supernatants and precipitates of these fractions
for 2-DE analysis. For the first dimension 24 cm IPG strips with pH values in the
range of 4-7 were used. The proteins were resolved in homogeneous 15% acrylamide
gels in the second dimension to obtain greater resolution for small proteins. About
300 spots in each colloidal CBB-stained gel can be visualized by ImageMaster software.
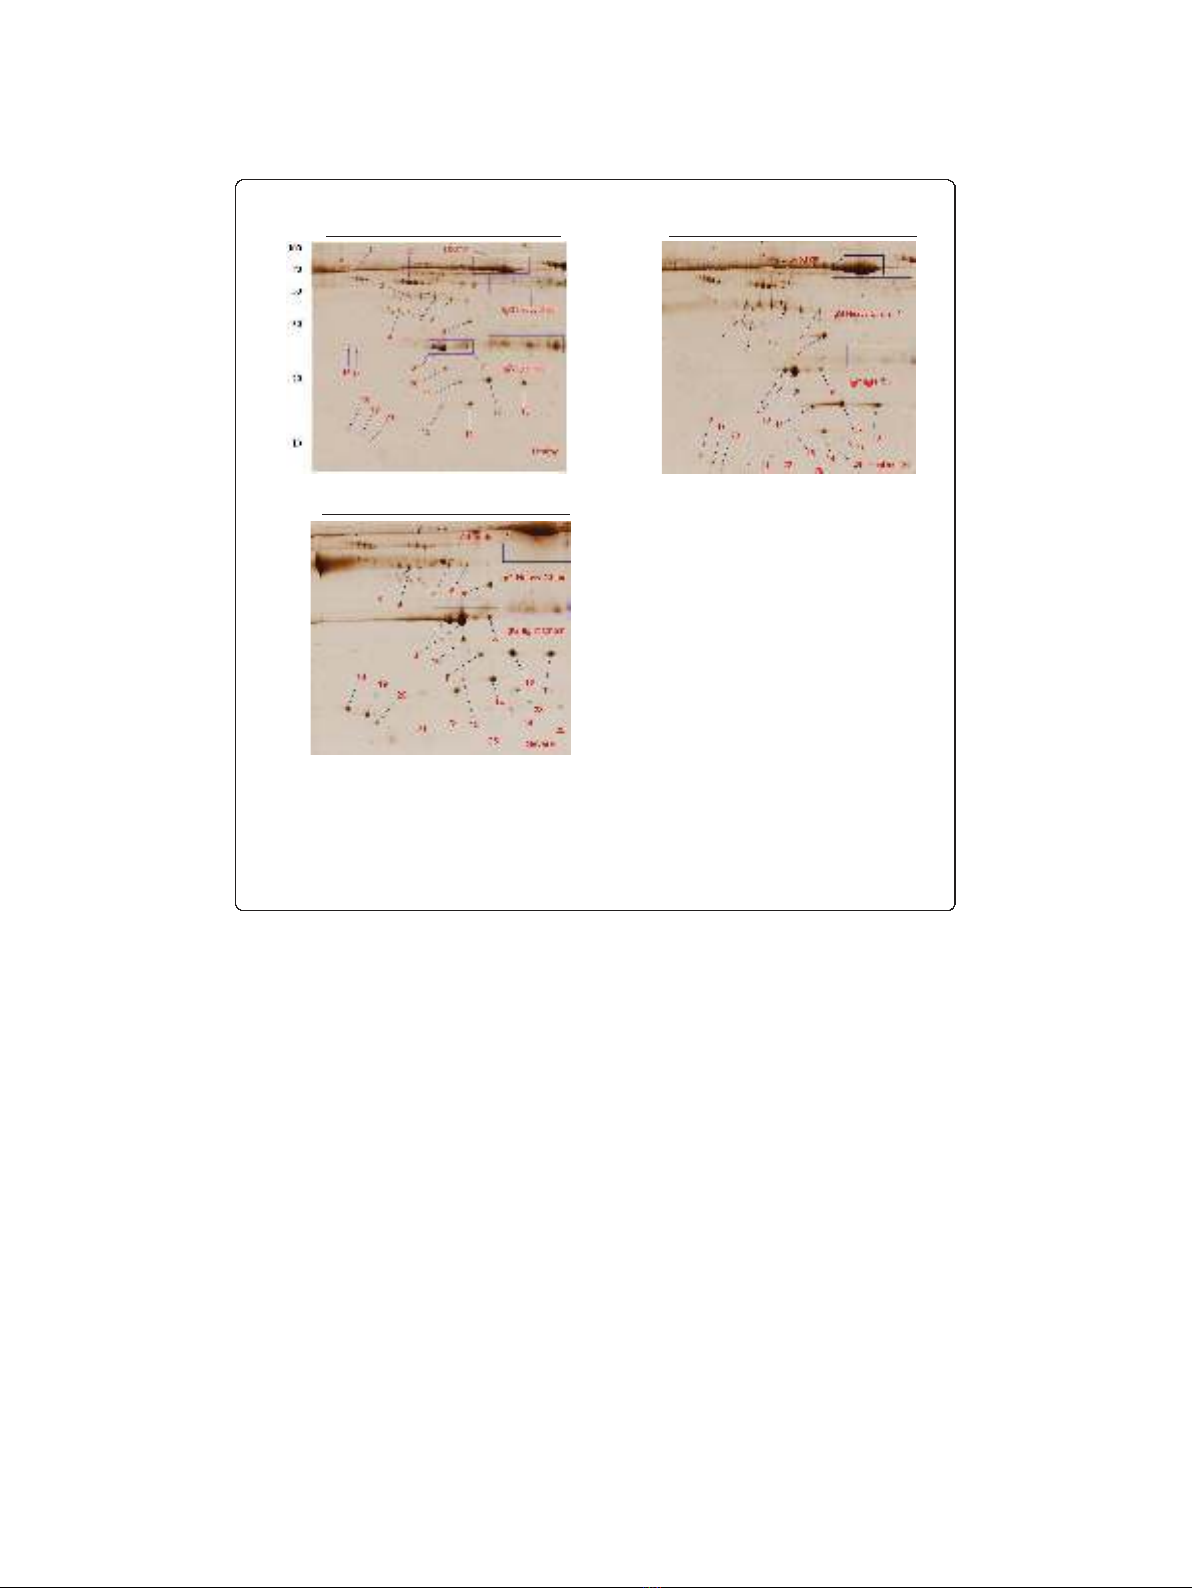
Representative 2-DE images of plasma profiles from a healthy control for 50% (v/v)
ethanol precipitate and ethanol supernatant are shown in Figure 2A and 2B respec-
tively. Comparing the proteomics patterns of these two gels shows that both immuno-
globulin heavy and light chains are separated in ethanol precipitate (Figure 2A) and
albumin is distributed both in ethanol supernatant and precipitate (Figure 2A and 2B).
Moreover, most of the small molecular weight proteins in the range of 15-50 kDa,
havesignificantly(p<0.05)higherspotvolume and intensity in ethanol supernatant
rather than precipitate (Table 2 and Figures. 2A and 2A).
We analyzed the differences in the plasma protein patterns, comparing the gels of
the diseased and healthy controls. The analysis of protein patterns of the plasma was
focused on those protein spots which showed differences, comparing the patients and
the controls. They were compared with Image Master 2-DE software and indicated
only protein results in all cases (100%) with the same condition. As shown in Figures 2
B and 2C, twenty six protein spots were subjected to MALDI TOF MS analysis. All
selected proteins and their isoforms were subsequently identified by PMF and MS/MS
U S25% P25% S50% P50% S75% P75%
Figure 1 SDS-PAGE of plasma proteins fractionated with different concentrations (v/v) of ethanol.U
represents plasma proteins before precipitation; S, ethanol supernatant; P, ethanol precipitate. Samples
were analysed as described in the Method section and gels were stained using silver staining.
Mehrani et al.Clinical Proteomics 2011, 8:2
http://www.clinicalproteomicsjournal.com/content/8/1/2
Page 3 of 11
analysis. Table 3 lists the identities of the proteins and their isoforms which were ana-
lyzed in this experiment using MALDI TOF MS. Figures 2B and 2C shows the location
of these protein spots in the 2-DE gels of a healthy controls and an exposed patients
respectively. Volume and intensity of those protein spots which were only present in
all patients’plasma but none of the healthy controls are shown in Table 4. Images
from other healthy volunteers and patients were similar (data not shown).
Haptoglobin a1 chain isoforms (spots 21, 22 and 23) were only detected in the
plasma of the severe lung diseases patients but were not detectable in healthy controls
(Figure 2B and 2C). Furthermore, serum Amyloid A1 isoforms (spots 24 and 26) were
only seen in the plasma of the patients but none of the healthy controls (Figure 2B
and 2C).
Discussion
In this study we present plasma proteome analysis of SM exposed patients compared
to the healthy controls. Human plasma and serum represent important biological
materials for disease diagnosis. However, the wide dynamic range in protein concentra-
tions remains a major challenge in the development of diagnostic assays. Human
plasma albumin and the various forms of immunoglobulin represent the most abun-
dant proteins in the plasma, constituting up to 80% of the total plasma proteins. The
A
MW/KD pH4 pH7
pH4 pH7
B
C
pH4 pH7
Figure 2 Representative 2-DE protein patterns of plasma from healthy and severe lung diseases
patients exposed to SM. Plasma proteins were fractionated using 50% (v/v) ethanol fractionation. Sample
preparation and 2-DE analysis were performed as described in the Materials and Methods section. Proteins
(400 μg) were separated using linear IPG strips pH 4-7, followed by 15% SDS-PAGE and were detected by
colloidal CBB staining. Each gel shows healthy control; ethanol precipitate (A); ethanol supernatant (B); and
severe lung diseases patient; ethanol supernatant (C). Numbered spots indicate the MADI TOF MS/MS
analysed proteins as listed in Table 3.
Mehrani et al.Clinical Proteomics 2011, 8:2
http://www.clinicalproteomicsjournal.com/content/8/1/2
Page 4 of 11

classical depletion strategy for albumin involves using hydrophobic dye Cibacron blue,
a chlorotriazine dye which has high affinity for albumin [14]. As a group, the immuno-
globulins represent the second most abundant proteins in the plasma or serum. It has
been reported that albumin depletion mayalsoremovesomesmalllowcopynumber
proteins [15]. Therefore, in these experiments we used ethanol fractionation and found
that this simple and low cost experimental procedure can be used for removing immu-
noglobulins and part of the albumin. Moreover, using 50% (v/v) fractionation, we
showed that the ethanol supernatant contains all the protein spots that were found in
the ethanol precipitate and recovers more small MW proteins.
We have identified some proteins that could give a novel insight into the pathogen-
esis of mustard lung. One of the main findings was different isoforms of haptoglobin
in the plasma of severe lung disease patients but not in healthy controls. Haptoglobin
is present in normal human plasma at a concentration range of 0.3-1.9 mg/ml,
accounting for 0.4-2.6% of total plasma protein. Human haptoglobin is an inflamma-
tion-inducible plasma protein. It consists of 2 different types of achains and a single
type of bchain connected by disulfide bridges (b-a-a-b) giving 3 major phenotypes
(Hp 1-1, Hp 2-1, Hp 2-2), the numbers 1 and 2 representing a1(8.9kDa)anda2(16
kDa) chains, respectively. The bchain (40 kDa) is heavier than achain and is identical
in all Hp types [16-19].
Our results (Figures 2B and 2C) show that under our experimental conditions, the
a2 chain (spots 11, 12, 13) is similarly expressed in the plasma of both experimental
Table 2 Comparison of spot volume and intensity in ethanol fractionated human
plasma
a
Spot# b Protein Ethanol Supernatant Ethanol Precipitate
Name % Volume % intensity % Volume % intensity
1a2 HS glycoprotein 10 ± 1.4 23 ± 1.8** 8 ± 1.2 13 ± 1.6
2a1-antitrypsin 160 ± 14 67 ± 6.4 170 ± 23 59 ± 4.7
3 Zinc a2 glycoprotein 36 ± 4.6** 46 ± 4.2** 12 ± 2.1 19 ± 4.8
4 SP40 20 ± 3.8 44 ± 2.7 21 ± 3.1 39 ± 3.2
5 Haptoglobin 36 ± 4.3** 51 ± 9.0** 19 ± 2.8 29 ± 2.5
6 Transthyretin 137 ± 19** 68 ± 5.6** 54 ± 13 33 ± 11
7 Apolipoprotein AIV 120 ± 11** 64 ± 8.3** 35 ± 7.8 37 ± 5.2
8 Apolipoprotein A1 140 ± 12 70 ± 4.1 121 ± 13 54 ± 5.9
8 Apolipoprotein A1 640 ± 23** 74 ± 8.2 405 ± 15 63 ± 6.2
9 Apolipoprotein A1 41 ± 3.0 59 ± 6.9 54 ± 4.7 36 ± 4.1
10 Retinol BP 4 53 ± 12** 58 ± 5.8* 27 ± 7.5 42 ± 5.5
11 Haptoglobin hp2a73 ± 5.6** 56 ± 4.3** 41 ± 6.1 36 ± 4.2
12 Haptoglobin hp2a215 ± 9.2** 70 ± 4.8 170 ± 8.5 62 ± 6.8
13 Haptoglobin hp2a155 ± 8.4** 64 ± 6.8 91 ± 9.2 57 ± 6.8
14 Transthyretin 77 ± 5.8 56 ± 6.8 87 ± 9.2 54 ± 6.8
15 Transthyretin 10 ± 5.6 7.5 ± 6.8 11 ± 9.2 8.2 ± 6.8
18 Apolipoprotein CIII 123 ± 8.4** 58 ± 6.8 ** 91 ± 9.2 27 ± 6.8
19 Apolipoprotein CIII 125 ± 8.4** 79 ± 3.4** 65 ± 7.8 25 ± 4.3
20 Apolipoprotein CII 35 ± 4.4** 24 ± 7.2** 11 ± 9.2 8.9 ± 6.8↑
Data are mean ± SEM of the % volume and intensity of protein spots on the 2D gels multiplied by 100. Significant
difference between the samples were calculated using the Student’s t-test and marked by * if p < 0.05, ** if p < 0.01.
a. Spot numbers correspond to those in Figures 2A and 2B
Mehrani et al.Clinical Proteomics 2011, 8:2
http://www.clinicalproteomicsjournal.com/content/8/1/2
Page 5 of 11


%20--%3e%3cdefs%3e%3cstyle%3e%20.st0%20{%20fill:%20%23fff;%20}%20.st1%20{%20fill:%20%237800fa;%20}%20%3c/style%3e%3c/defs%3e%3cpath%20class='st1'%20d='M117.78,12.18H43.11c2.9,3.47,4.65,7.94,4.65,12.82,0,5.6-2.3,10.66-6.01,14.29h76.02l7.22-13.56-7.22-13.56Z'/%3e%3cg%3e%3cpath%20class='st0'%20d='M53.58,26.17h-.59v-1.46h.59v-4.96h2.83c1.78,0,2.67.94,2.67,2.82v5.76c0,1.87-.89,2.81-2.67,2.81h-2.83v-4.96ZM55.36,21.37v3.34h1.1v1.46h-1.1v3.34h1.01c.61,0,.91-.37.91-1.1v-5.93c0-.74-.3-1.1-.91-1.1h-1.01Z'/%3e%3cpath%20class='st0'%20d='M65.99,31.14h-1.8l-.31-2.07h-2.19l-.31,2.07h-1.64l1.82-11.39h2.62l1.82,11.39ZM65.28,18.04c-.25.46-.51.77-.75.94-.21.15-.47.22-.79.22-.26,0-.57-.07-.92-.22l-.38-.15c-.14-.05-.26-.07-.37-.07-.3,0-.53.18-.71.54l-.91-.68c.25-.46.51-.77.75-.94.21-.14.48-.21.79-.21.26,0,.57.07.92.21l.38.15c.14.05.26.07.37.07.3,0,.53-.18.71-.54l.91.68ZM61.91,27.52h1.73l-.87-5.76-.87,5.76Z'/%3e%3cpath%20class='st0'%20d='M74.53,26.89v1.52c0,1.91-.89,2.86-2.67,2.86s-2.67-.95-2.67-2.86v-5.93c0-1.91.89-2.86,2.67-2.86s2.67.95,2.67,2.86v1.11h-1.69v-1.22c0-.75-.31-1.12-.93-1.12s-.93.37-.93,1.12v6.15c0,.74.31,1.11.93,1.11s.93-.37.93-1.11v-1.63h1.69Z'/%3e%3cpath%20class='st0'%20d='M81.4,31.14h-1.8l-.31-2.07h-2.19l-.31,2.07h-1.64l1.82-11.39h2.62l1.82,11.39ZM75.9,19.2l1.52-1.91h1.71l1.51,1.91h-1.61l-.76-.95-.75.95h-1.61ZM77.32,27.52h1.73l-.87-5.76-.87,5.76ZM83.1,15.99l-1.76,1.91h-1.26l1.17-1.91h1.86Z'/%3e%3cpath%20class='st0'%20d='M84.86,19.75c1.78,0,2.67.94,2.67,2.82v1.48c0,1.87-.89,2.81-2.67,2.81h-.85v4.28h-1.79v-11.39h2.64ZM84.01,21.37v3.86h.85c.58,0,.87-.36.87-1.08v-1.71c0-.71-.29-1.07-.87-1.07h-.85Z'/%3e%3cpath%20class='st0'%20d='M93.51,19.75c1.78,0,2.67.94,2.67,2.82v1.48c0,1.87-.89,2.81-2.67,2.81h-.85v4.28h-1.79v-11.39h2.64ZM92.66,21.37v3.86h.85c.58,0,.87-.36.87-1.08v-1.71c0-.71-.29-1.07-.87-1.07h-.85Z'/%3e%3cpath%20class='st0'%20d='M98.8,31.14h-1.79v-11.39h1.79v4.88h2.03v-4.88h1.83v11.39h-1.83v-4.88h-2.03v4.88Z'/%3e%3cpath%20class='st0'%20d='M105.36,24.55h2.46v1.62h-2.46v3.34h3.09v1.63h-4.88v-11.39h4.88v1.63h-3.09v3.18ZM108.17,17.29l-1.76,1.91h-1.26l1.17-1.91h1.86Z'/%3e%3cpath%20class='st0'%20d='M112.2,19.75c1.78,0,2.67.94,2.67,2.82v1.48c0,1.87-.89,2.81-2.67,2.81h-.85v4.28h-1.79v-11.39h2.64ZM111.35,21.37v3.86h.85c.58,0,.87-.36.87-1.08v-1.71c0-.71-.29-1.07-.87-1.07h-.85Z'/%3e%3c/g%3e%3ccircle%20class='st1'%20cx='25'%20cy='25'%20r='20'/%3e%3cpath%20class='st0'%20d='M32.78,19.27c2.92,0,4.43,2.55,5.28,5.33l.71,2.17c.14.38-.33.75-.71.75h-5.61c.19-.33.24-.71.09-1.08l-.75-2.45c-.43-1.32-.99-2.64-1.79-3.77.75-.57,1.65-.94,2.78-.94h0ZM25,18.38c3.25,0,4.9,2.78,5.89,5.89l.76,2.45c.14.42-.33.8-.8.8h-11.69c-.42,0-.94-.38-.8-.8l.75-2.45c.99-3.11,2.64-5.89,5.89-5.89h0ZM25,11.35c1.74,0,3.11,1.37,3.11,3.11s-1.37,3.11-3.11,3.11-3.11-1.41-3.11-3.11,1.41-3.11,3.11-3.11h0ZM17.27,19.27c1.08,0,1.98.38,2.73.94-.8,1.13-1.37,2.45-1.74,3.77l-.8,2.45c-.14.38-.05.75.09,1.08h-5.56c-.42,0-.9-.38-.75-.75l.71-2.17c.9-2.78,2.41-5.33,5.33-5.33h0ZM17.27,12.91c1.51,0,2.78,1.27,2.78,2.83s-1.27,2.83-2.78,2.83-2.83-1.27-2.83-2.83,1.27-2.83,2.83-2.83h0ZM32.78,12.91c1.56,0,2.78,1.27,2.78,2.83s-1.23,2.83-2.78,2.83-2.83-1.27-2.83-2.83,1.27-2.83,2.83-2.83h0ZM27.07,28.56v.09c0,.57-.24,1.08-.61,1.46h0v.05c-.38.33-.9.57-1.46.57s-1.08-.24-1.46-.61h0c-.38-.38-.61-.9-.61-1.46v-.09h1.41v.09c0,.19.05.38.19.47v.05c.09.09.28.19.47.19s.38-.09.47-.19v-.05c.14-.09.24-.28.24-.47t-.05-.09h1.41ZM30.99,28.56v.09c0,1.65-.66,3.16-1.74,4.24-1.08,1.08-2.59,1.79-4.24,1.79s-3.16-.71-4.24-1.79l-.05-.05c-1.04-1.08-1.7-2.55-1.7-4.2v-.09h1.41v.09c0,1.27.47,2.4,1.27,3.25h.05c.85.85,1.98,1.37,3.25,1.37s2.4-.52,3.25-1.37c.85-.8,1.37-1.98,1.37-3.25v-.09h1.37ZM34.99,28.56v.09c0,2.78-1.13,5.28-2.92,7.07-1.79,1.79-4.29,2.92-7.07,2.92s-5.23-1.13-7.07-2.92c-1.79-1.79-2.92-4.29-2.92-7.07v-.09h1.41v.09c0,2.4.94,4.53,2.5,6.08,1.56,1.56,3.72,2.5,6.08,2.5s4.52-.94,6.08-2.5c1.56-1.56,2.5-3.68,2.5-6.08v-.09h1.41Z'/%3e%3c/svg%3e)