
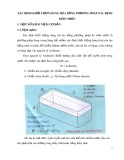
1
THAI NGUYEN UNIVERSITY OF AGRICULTURE AND FORESTRY
INTERNATIONAL TRAINING AND DEVELOPMENT CENTER
ADVANCED EDUCATION PROGRAM
STA13
Elementary Statistics
Syllabus
Semester 2, AY 2
Picture best relevant to the subject
2
Teaching Staff
Subject lecturer: PhD. Pham Thanh Hieu
Organization: Faculty of Basic Science, Thai Nguyen University of Agriculture and Forestry
Office Location: In the campus of university
Phone:
Mobile phone: +84 917 522 383
Email: phamthanhhieu@tuaf.edu.vn or hieuphamthanh@gmail.com
Consultation hours: From 2 pm to 4 pm on weekly Wednesday in the office location.
Short description about the lecturer
I have been working as a lecturer of Mathematics in Faculty of Basic Science, Thai Nguyen
University of Agriculture and Forestry (TUAF) since 2006. I teach two courses in Vietnamese,
Short Calculus and Statistics, for the first year students of TUAF and one course in English,
Elementary Statistics, for the second year students of advanced education program in s. I have
finished my PhD. study of Mathematical Analysis in 2016 and my interesting research is
methods for solving variational inequalities and fixed point problems with potential applications
in optimization.
Subject Overview
Statistics is the science of data. This involves collecting, classifying, summarizing, organizing,
analysing, and interpreting numerical information. Many problems arising in real-world
situation are closely related to statistics which we call statistical problems.
For example: know if a new drug is superior (better) to already
existing drugs, or possible side effects.
opportunities?
So we can see that statistics is the science originated from the real-world problems and it plays
important role in many disciplines of economy, natural and social problems. Statistics is a
meaningful and useful science whose broad scope of applications to business, government, and
the physical and social sciences are almost limitless.
Learning Outcomes
The object (for students) in this course is
To learn how to interpret statistical summaries appearing in journals, newspaper reports,
internet, television, etc..
To learn about the concepts of probability and probabilistic reasoning.
To understand variability and analyze sampling distribution.
To learn how to interpret and analyze data arising in your own work (course work or
research).

3
Subject Structure
List of lectures
Week/
Lecture(s)
Time/
Sections
Contents/Topics
Instructional
methods
Week 1
Lecture 1
3.0 hours
…/…/….
1.1-1.5
Chapter 1: Introduction to statistics
1.1 The science of statistics
1.2. Types of statistics applications
1.3. Fundamental element of statistics
1.4. Types of data
1.5. Methods of data collection
lecture,
discussion
Week 2
Lecture 2
3.0 hours
…/…/….
2.1-2.5
2.1. Graphical method for describing data
2.2. Numerical measures of central tendency
2.3. Numerical measures of cariability
2.4. Data position
2.5. Boxplot
lecture,
discussion
Week 3
Lecture 3
3.0 hours
…/…/….
Discussion 1
discussion
Week 4
Lecture 4
3.0 hours
…/…/….
3.1-3.5
Chapter 3: Probability
3.1. The role of probability in statistics
3.2. Basic concepts of probability
3.3. Counting rule
3.4. Event relations
3.5. Conditional probability and the
multiplication rule
lecture,
discussion
Week 5
Lecture 5
3.0 hours
…/…/….
3.6
4.1-4.2
Chapter 3 (continued) and Chapter 4:
Discrete probability distribution
3.6. Additional rule
4.1. Probability distribution
4.2. Binomial distribution
lecture,
discussion
Week 6
Lecture 6
3.0 hours
…/…/….
5.1-5.4
Chapter 5: Normal probability distribution
5.1. Normal distribution and the standard
distribution
5.2. Normal distribution: Finding
probabilities
5.3. Normal distribution: Finding values
5.4. Sampling distribution and the central
limit theorem
lecture,
discussion
Week 7
Lecture 7
…/…/….
Discussion 2
Review for midterm exam
discussion

4
3.0 hours
Midterm exam
Week 8
Lecture 8
3.0 hours
…/…/….
6.1-6.3
Chapter 6: Confidence interval
6.1. Confidence interval for the mean (large
sample n 30)
6.2. Confidence interval for the mean (small
sample n 30)
6.3. Confidence interval for the population
proportion
lecture,
discussion
Week 9
Lecture 9
3.0 hours
…/…/….
Discussion 3
discussion
Week 10
Lecture 10
3.0 hours
…/…/….
7.1-7.4
Chapter 7: Hypothesis Testing for One
Sample
7.1. Introduction to hypothesis testing
7.2. Hypothesis testing for the mean (large
sample n>30)
7.3. Hypothesis testing for the mean (small
sample n<30)
7.4. Hypothesis testing for proportions
lecture,
discussion
Week 11
Lecture 11
3.0 hours
…/…/….
Discussion 4
Review for the midterm exam 2
Midterm exam 2
discussion
Week 12
Lecture 12
3.0 hours
…/…/….
Review all for the final exam
The sample final exam
discussion
21 hours teaching and giving the sample
midterm exams
12 hours discussing and taking the
midterm exams
3 hours for reviewing and taking the
sample final example
=36 hours
Time for Final Exam is followed the TUAF exam timetable
Reading materials:
1. Elementary statistics, Robert Johnson, Patricia Kuby, THOMSON, 2004
2. Introduction to Probability and Statistics , 13rd edition, W. Mendenhall, R.J. Beaver, and
B.M. Beaver, Books/Cole, Cengage Learning, 2009.
3. Applied Statistics, M. A. Shayib, bookboon.com, 2013.

5
Attendance/ Participation Requirements
Lecture Attendance Requirement:
Attendance at all lectures is expected. If, for whatever reason, you cannot attend the lecture,
please let the lecturer know in advance. You are required to attend a minimum of 75% of
lectures.
Assessment
The assessment for this course will be in the form of homework, one midterm exam and one
final exam. Midterm will take place in class on the 7th week of the course, and the final
examination will take place in class following the exam timetable of TUAF.
Your overall grade will be based on: Homework/Attendance/Attitude: 20%; Midterm - 30%;
Final - 50%
The use of calculators, books or notes will not be allowed in the examinations.
Assessment for this subject consists of :
Assessment type
Percentage
Due Date
Midterm exam
30%
The 7th week
Final exam
50%
After the 12th week.
Assessment Criteria: Students should obtain at least 40 points in total 100 points for each
exam.
Grading system
Grade
in letter
1-4
scale
1-10
scale
Description
A
4
8.5 – 10
Excellent analysis, comprehensive research,
sophisticated theoretical or methodological
understanding, impeccable presentation;
Work that meets all the key assessment criteria and
excels in most;
Work that meets these criteria and is also in some way
original, exciting or challenging could be awarded
marks in the high 8 or above.
Marks of 9 and above may be awarded to the best
student work in the range.
B
3
7 – 8.49
Good work that is solidly researched, shows a good
understanding of key ideas, demonstrates some use of


![Bài giảng Giải tích hàm nhiều biến [chuẩn nhất]](https://cdn.tailieu.vn/images/document/thumbnail/2026/20260508/vispacex_27/135x160/91991778472930.jpg)


%20--%3e%3cdefs%3e%3cstyle%3e%20.st0%20{%20fill:%20%23fff;%20}%20.st1%20{%20fill:%20%237800fa;%20}%20%3c/style%3e%3c/defs%3e%3cpath%20class='st1'%20d='M117.78,12.18H43.11c2.9,3.47,4.65,7.94,4.65,12.82,0,5.6-2.3,10.66-6.01,14.29h76.02l7.22-13.56-7.22-13.56Z'/%3e%3cg%3e%3cpath%20class='st0'%20d='M53.58,26.17h-.59v-1.46h.59v-4.96h2.83c1.78,0,2.67.94,2.67,2.82v5.76c0,1.87-.89,2.81-2.67,2.81h-2.83v-4.96ZM55.36,21.37v3.34h1.1v1.46h-1.1v3.34h1.01c.61,0,.91-.37.91-1.1v-5.93c0-.74-.3-1.1-.91-1.1h-1.01Z'/%3e%3cpath%20class='st0'%20d='M65.99,31.14h-1.8l-.31-2.07h-2.19l-.31,2.07h-1.64l1.82-11.39h2.62l1.82,11.39ZM65.28,18.04c-.25.46-.51.77-.75.94-.21.15-.47.22-.79.22-.26,0-.57-.07-.92-.22l-.38-.15c-.14-.05-.26-.07-.37-.07-.3,0-.53.18-.71.54l-.91-.68c.25-.46.51-.77.75-.94.21-.14.48-.21.79-.21.26,0,.57.07.92.21l.38.15c.14.05.26.07.37.07.3,0,.53-.18.71-.54l.91.68ZM61.91,27.52h1.73l-.87-5.76-.87,5.76Z'/%3e%3cpath%20class='st0'%20d='M74.53,26.89v1.52c0,1.91-.89,2.86-2.67,2.86s-2.67-.95-2.67-2.86v-5.93c0-1.91.89-2.86,2.67-2.86s2.67.95,2.67,2.86v1.11h-1.69v-1.22c0-.75-.31-1.12-.93-1.12s-.93.37-.93,1.12v6.15c0,.74.31,1.11.93,1.11s.93-.37.93-1.11v-1.63h1.69Z'/%3e%3cpath%20class='st0'%20d='M81.4,31.14h-1.8l-.31-2.07h-2.19l-.31,2.07h-1.64l1.82-11.39h2.62l1.82,11.39ZM75.9,19.2l1.52-1.91h1.71l1.51,1.91h-1.61l-.76-.95-.75.95h-1.61ZM77.32,27.52h1.73l-.87-5.76-.87,5.76ZM83.1,15.99l-1.76,1.91h-1.26l1.17-1.91h1.86Z'/%3e%3cpath%20class='st0'%20d='M84.86,19.75c1.78,0,2.67.94,2.67,2.82v1.48c0,1.87-.89,2.81-2.67,2.81h-.85v4.28h-1.79v-11.39h2.64ZM84.01,21.37v3.86h.85c.58,0,.87-.36.87-1.08v-1.71c0-.71-.29-1.07-.87-1.07h-.85Z'/%3e%3cpath%20class='st0'%20d='M93.51,19.75c1.78,0,2.67.94,2.67,2.82v1.48c0,1.87-.89,2.81-2.67,2.81h-.85v4.28h-1.79v-11.39h2.64ZM92.66,21.37v3.86h.85c.58,0,.87-.36.87-1.08v-1.71c0-.71-.29-1.07-.87-1.07h-.85Z'/%3e%3cpath%20class='st0'%20d='M98.8,31.14h-1.79v-11.39h1.79v4.88h2.03v-4.88h1.83v11.39h-1.83v-4.88h-2.03v4.88Z'/%3e%3cpath%20class='st0'%20d='M105.36,24.55h2.46v1.62h-2.46v3.34h3.09v1.63h-4.88v-11.39h4.88v1.63h-3.09v3.18ZM108.17,17.29l-1.76,1.91h-1.26l1.17-1.91h1.86Z'/%3e%3cpath%20class='st0'%20d='M112.2,19.75c1.78,0,2.67.94,2.67,2.82v1.48c0,1.87-.89,2.81-2.67,2.81h-.85v4.28h-1.79v-11.39h2.64ZM111.35,21.37v3.86h.85c.58,0,.87-.36.87-1.08v-1.71c0-.71-.29-1.07-.87-1.07h-.85Z'/%3e%3c/g%3e%3ccircle%20class='st1'%20cx='25'%20cy='25'%20r='20'/%3e%3cpath%20class='st0'%20d='M32.78,19.27c2.92,0,4.43,2.55,5.28,5.33l.71,2.17c.14.38-.33.75-.71.75h-5.61c.19-.33.24-.71.09-1.08l-.75-2.45c-.43-1.32-.99-2.64-1.79-3.77.75-.57,1.65-.94,2.78-.94h0ZM25,18.38c3.25,0,4.9,2.78,5.89,5.89l.76,2.45c.14.42-.33.8-.8.8h-11.69c-.42,0-.94-.38-.8-.8l.75-2.45c.99-3.11,2.64-5.89,5.89-5.89h0ZM25,11.35c1.74,0,3.11,1.37,3.11,3.11s-1.37,3.11-3.11,3.11-3.11-1.41-3.11-3.11,1.41-3.11,3.11-3.11h0ZM17.27,19.27c1.08,0,1.98.38,2.73.94-.8,1.13-1.37,2.45-1.74,3.77l-.8,2.45c-.14.38-.05.75.09,1.08h-5.56c-.42,0-.9-.38-.75-.75l.71-2.17c.9-2.78,2.41-5.33,5.33-5.33h0ZM17.27,12.91c1.51,0,2.78,1.27,2.78,2.83s-1.27,2.83-2.78,2.83-2.83-1.27-2.83-2.83,1.27-2.83,2.83-2.83h0ZM32.78,12.91c1.56,0,2.78,1.27,2.78,2.83s-1.23,2.83-2.78,2.83-2.83-1.27-2.83-2.83,1.27-2.83,2.83-2.83h0ZM27.07,28.56v.09c0,.57-.24,1.08-.61,1.46h0v.05c-.38.33-.9.57-1.46.57s-1.08-.24-1.46-.61h0c-.38-.38-.61-.9-.61-1.46v-.09h1.41v.09c0,.19.05.38.19.47v.05c.09.09.28.19.47.19s.38-.09.47-.19v-.05c.14-.09.24-.28.24-.47t-.05-.09h1.41ZM30.99,28.56v.09c0,1.65-.66,3.16-1.74,4.24-1.08,1.08-2.59,1.79-4.24,1.79s-3.16-.71-4.24-1.79l-.05-.05c-1.04-1.08-1.7-2.55-1.7-4.2v-.09h1.41v.09c0,1.27.47,2.4,1.27,3.25h.05c.85.85,1.98,1.37,3.25,1.37s2.4-.52,3.25-1.37c.85-.8,1.37-1.98,1.37-3.25v-.09h1.37ZM34.99,28.56v.09c0,2.78-1.13,5.28-2.92,7.07-1.79,1.79-4.29,2.92-7.07,2.92s-5.23-1.13-7.07-2.92c-1.79-1.79-2.92-4.29-2.92-7.07v-.09h1.41v.09c0,2.4.94,4.53,2.5,6.08,1.56,1.56,3.72,2.5,6.08,2.5s4.52-.94,6.08-2.5c1.56-1.56,2.5-3.68,2.5-6.08v-.09h1.41Z'/%3e%3c/svg%3e)