
BioMed Central
Page 1 of 16
(page number not for citation purposes)
BMC Plant Biology
Open Access
Research article
Uncovering the Arabidopsis thaliana nectary transcriptome:
investigation of differential gene expression in floral nectariferous
tissues
Brian W Kram†1, Wayne W Xu†2 and Clay J Carter*1
Address: 1Department of Biology, University of Minnesota Duluth, Duluth, MN 55812, USA and 2Minnesota Supercomputing Institute, University
of Minnesota, Minneapolis, MN 55455, USA
Email: Brian W Kram - bkram@d.umn.edu; Wayne W Xu - wxu@msi.umn.edu; Clay J Carter* - cjcarter@d.umn.edu
* Corresponding author †Equal contributors
Abstract
Background: Many flowering plants attract pollinators by offering a reward of floral nectar.
Remarkably, the molecular events involved in the development of nectaries, the organs that
produce nectar, as well as the synthesis and secretion of nectar itself, are poorly understood.
Indeed, to date, no genes have been shown to directly affect the de novo production or quality of
floral nectar. To address this gap in knowledge, the ATH1 Affymetrix® GeneChip array was used
to systematically investigate the Arabidopsis nectary transcriptome to identify genes and pathways
potentially involved in nectar production.
Results: In this study, we identified a large number of genes differentially expressed between
secretory lateral nectaries and non-secretory median nectary tissues, as well as between mature
lateral nectaries (post-anthesis) and immature lateral nectaries (pre-anthesis). Expression within
nectaries was also compared to thirteen non-nectary reference tissues, from which 270 genes were
identified as being significantly upregulated in nectaries. The expression patterns of 14 nectary-
enriched genes were also confirmed via RT PCR. Upon looking into functional groups of
upregulated genes, pathways involved in gene regulation, carbohydrate metabolism, and lipid
metabolism were particularly enriched in nectaries versus reference tissues.
Conclusion: A large number of genes preferentially expressed in nectaries, as well as between
nectary types and developmental stages, were identified. Several hypotheses relating to
mechanisms of nectar production and regulation thereof are proposed, and provide a starting point
for reverse genetics approaches to determine molecular mechanisms underlying nectar synthesis
and secretion.
Background
Nectar is the principal reward offered by flowering plants
to attract pollinators [1]; this sugary solution is secreted
from floral organs known as nectaries. The complexity of
nectar composition has been revealed through many stud-
ies on a wide variety of species. In addition to simple sug-
ars (ranging from 8% up to 80%, (w/w) [2]), nearly all
nectars contain an assortment of ancillary components,
including: amino acids [3], organic acids [4], terpenes [5],
alkaloids [6], flavonoids [7], glycosides [8], vitamins [9],
phenolics [7], metal ions [10], oils [11], free fatty acids
[12], and proteins [13]. Surprisingly, the means by which
Published: 15 July 2009
BMC Plant Biology 2009, 9:92 doi:10.1186/1471-2229-9-92
Received: 7 April 2009
Accepted: 15 July 2009
This article is available from: http://www.biomedcentral.com/1471-2229/9/92
© 2009 Kram et al; licensee BioMed Central Ltd.
This is an Open Access article distributed under the terms of the Creative Commons Attribution License (http://creativecommons.org/licenses/by/2.0),
which permits unrestricted use, distribution, and reproduction in any medium, provided the original work is properly cited.
BMC Plant Biology 2009, 9:92 http://www.biomedcentral.com/1471-2229/9/92
Page 2 of 16
(page number not for citation purposes)
these compounds arise in nectar are poorly defined. Stud-
ies conducted on nectariferous tissue (that constituting
the nectary) have traditionally focused on nectar compo-
sition, nectary anatomy, and physiological aspects of nec-
tar secretion. Only recently has the goal of identifying the
genetic mechanisms regulating nectary development, and
nectar production, begun to receive more attention.
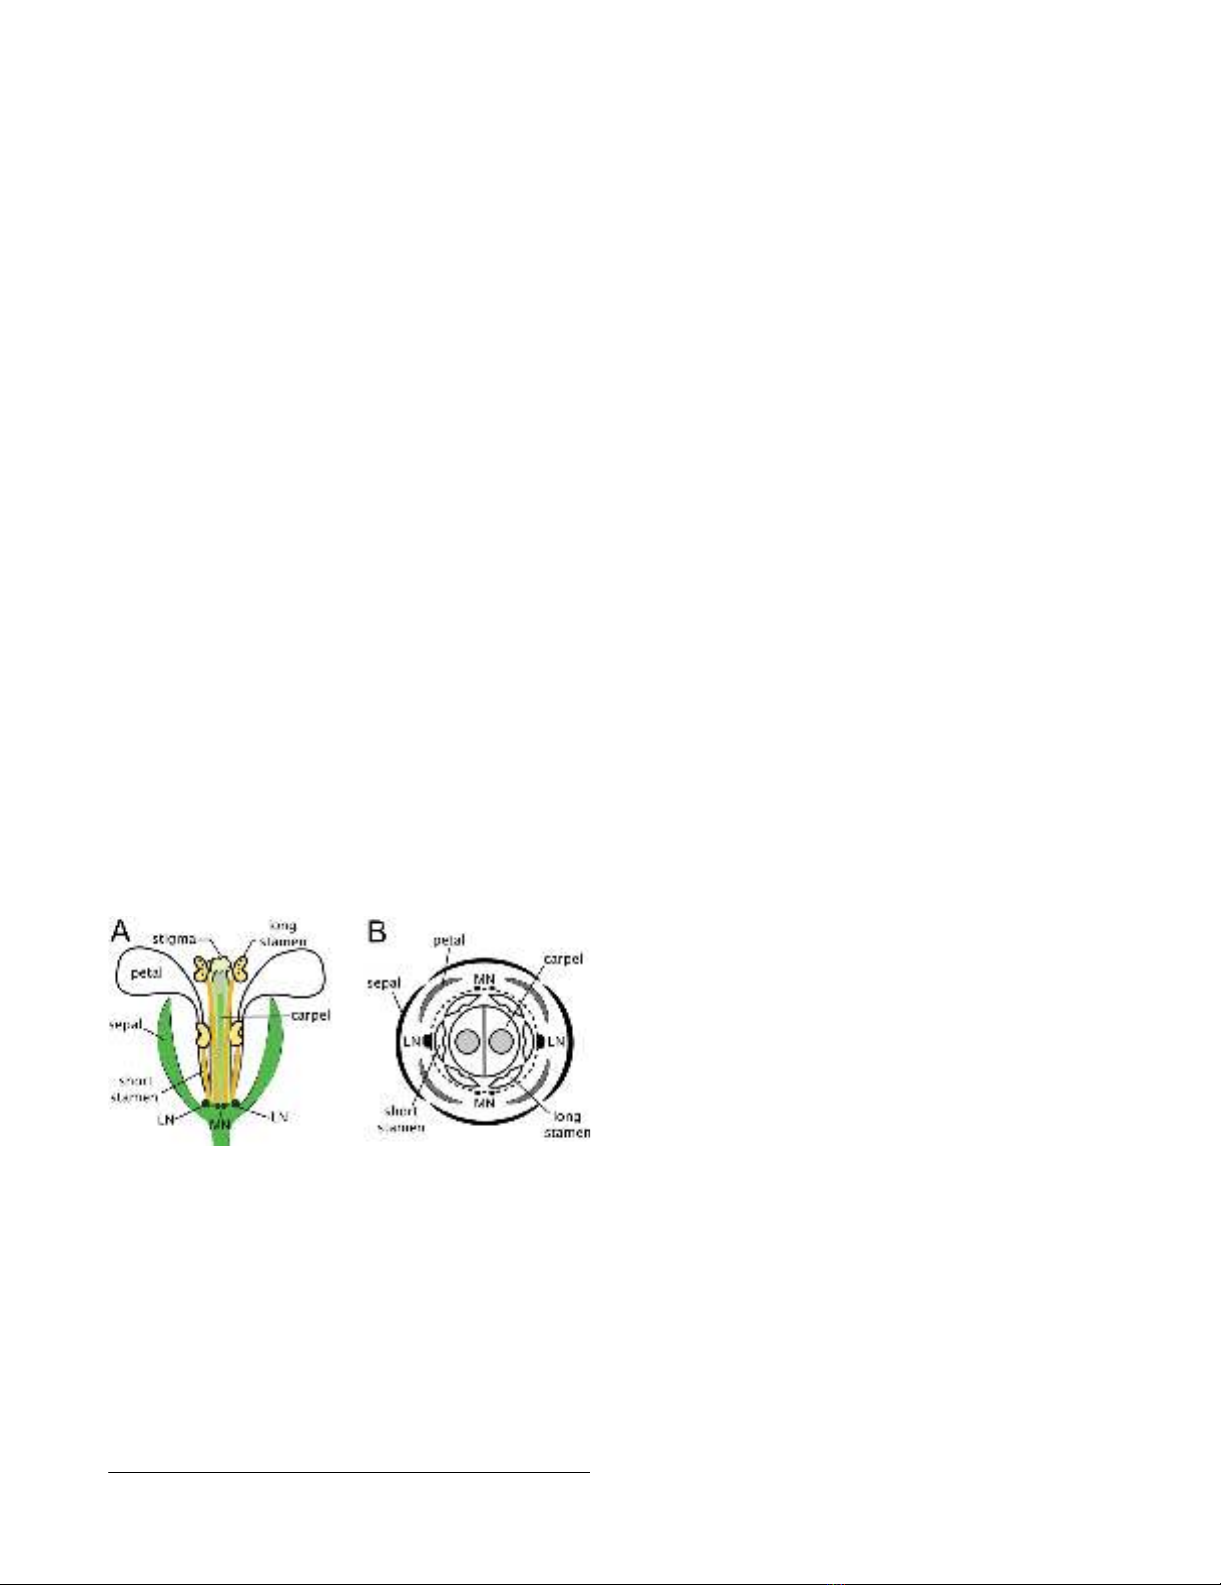
The Arabidopsis thaliana 'nectarium' consists of two pairs
of nectaries, lateral and median (see Figure 1; [14]). The
two lateral nectaries (LN) are longitudinally opposed to
one another just outside the base of short stamen, and are
bounded by petal insertion sites. The two median nectar-
ies (MN) also occur on opposite sides of the flower but
only between the insertion points of two long stamen.
Interestingly, these two nectary types are morphologically
and functionally distinct, with lateral nectaries producing
the bulk of the nectar (on average >95% of total nectar
carbohydrate), and median nectaries producing little or
no nectar [14]. While lateral nectaries are regularly sup-
plied with an abundance of phloem, by comparison, the
median nectaries are subtended by only a small number
of sieve tubes [15].
Despite the near absence of genetic information about the
regulation of nectary form and function, some aspects of
nectary biology have been extensively studied. For exam-
ple, the morphology of nectaries from a number of species
has been closely examined and, as a result, there is a clear
understanding (down to the ultrastructural level) of some
of the processes that occur in nectariferous tissue
(reviewed in [16]). For example, at the onset of nectar pro-
duction and secretion in Arabidopsis, small vacuoles, in a
dense cytoplasm, are evident in presecretory nectariferous
cells [17]. As these cells begin to actively secrete nectar,
vacuole size, endoplasmic reticulum activity, and mito-
chondrial number all increase [17-19]. Conversely, dicty-
osome number decreases and plastid starch grains, which
presumably serve as a source of nectar carbohydrate, also
become smaller immediately before secretion [17-20]. In
addition, nectary cells likely have high levels of cellular
respiration, as evidenced by the abundance of mitochon-
dria with well-developed cristae in nectaries from multi-
ple species [15,21]. While these ultrastructural features of
Arabidopsis nectaries are known, the precise physical
mechanism of secretion is still an open question [16].
A prevailing view of merocrine-type nectar secretion, used
by Arabidopsis and most other nectar producing plants,
suggests that some or nearly all pre-nectar metabolites
(originating from the phloem sap) are transported sym-
plastically (between cells) via plasmodesmata in nectary
parenchyma cells. Here they are stored in secretory cells at
or near the nectary surface [21-23]. Immediately prior to
secretion, it is thought that starch grains are degraded and
most metabolites are packaged into endoplasmic reticu-
lum (ER) and/or Golgi-derived vesicles and secreted via
fusion with the plasma membrane (granulocrine secre-
tion). In fact, ultrastructural analyses have repeatedly
demonstrated the presence of extensive ER and Golgi net-
works in nectary secretory cells [16,17,21,22,24]. The
model described above does not necessarily discount the
direct involvement of plasma membrane transporters in
the movement of solutes into nectar (eccrine secretion).
Interestingly, a number of plant species, including Arabi-
dopsis, have nectaries with large numbers of modified sto-
mata on their epithelia [25]. It is presumed these stomata
are the location where direct nectar secretion from the
nectary occurs.
To date, only a few individual genes have been associated
with aspects of nectary development: CRABS CLAW,
BLADE-ON-PETIOLE (BOP) 1 and BOP2 [26-29]. crc
knockout mutants fail to develop nectaries, whereas bop1/
bop2 double mutant lines have significantly smaller nec-
taries along with aberrant morphologies [26,29]. While,
CRC expression alone is necessary, it will not promote
ectopic nectary development; this indicates that addi-
tional genetic elements might exist that restrict nectary
development to the third whorl of the Arabidopsis flower
[27]. Other floral organ identity genes have demonstrated
or proposed roles in regulating CRC expression, although
none of these genes alone are required for normal nectary
development. Some of these genes include: LEAFY, UFO,
AGAMOUS, SHATTERPROOF1/2, APETALA2/3, PISTIL-
LATA, and SEPALLATA1/2/3 [27,28,30]. In addition to the
Schematic of Arabidopsis thaliana nectariumFigure 1
Schematic of Arabidopsis thaliana nectarium. Arabi-
dopsis flowers have four nectaries that comprise the 'nectar-
ium'; two lateral nectaries (LN) occur at the base of short
stamen, and two bilobed median nectaries (MN) occur in
between the insertion points of two long stamen. (A) Sche-
matic of Arabidopsis flower with front sepal and petals not
shown. (B) Schematic cross-section of flower with relative
location of floral organs from (A) indicated (modified from
[14]). A narrow ridge of tissue that occasionally connects
median and lateral nectaries is indicated with dashed lines.
Lateral nectaries produce >95% of total nectar in most
Brassicaceae flowers, with median nectaries being relatively
non-functional.

BMC Plant Biology 2009, 9:92 http://www.biomedcentral.com/1471-2229/9/92
Page 3 of 16
(page number not for citation purposes)
above, a number of nectary-enriched genes have been
identified from multiple species (e.g., [31-39]).
The currently small picture of transcription factors and
their downstream targets in nectaries limits our under-
standing of pathways and cellular processes critical for
nectary development and function. Thus, a genome-wide
evaluation of gene expression in nectaries could shed
some light on key mediators of nectar production. Micro-
arrays have been used to examine gene expression in a
wide variety of tissues, and under a broad set of condi-
tions, in Arabidopsis (e.g., [40,41]). However, to date, no
genome-wide information on gene expression in nectaries
has been reported for Arabidopsis, or any other species.
The current lack of global gene expression profiles for nec-
tariferous tissue could possibly be linked to the diminu-
tive nature of Arabidopsis nectaries (at anthesis, lateral
nectaries contain roughly 2,000 cells, while median nec-
taries contain around 400 [27]) and the laborious process
associated with manual nectary collection.
Arabidopsis flowers are highly self-fertile, which begs the
question as to why these plants would bother to develop
functional nectaries; however, solitary bees, flies, and
thrips do visit Arabidopsis flowers in the wild, and a small
amount of outcrossing does occur [42]. Significantly,
many Brassicaceae species (e.g., Brassica rapa, B. oleraceae)
share similar nectarium structure with Arabidopsis, and
produce relatively large amounts of nectar [14,43]. In gen-
eral, these species are highly dependent on pollinator vis-
itation to achieve efficient pollination [44-47].
Arabidopsis nectaries also appear to share similar devel-
opmental mechanisms with a large portion of the eudicot
clade [30]. Thus, Arabidopsis, with its fully sequenced
genome and genetic resources, can serve as a valuable
model for examining nectary development and function
in plants.
Here we describe the isolation, amplification, and labe-
ling of transcripts from Arabidopsis nectaries, leading up
to an analysis of temporal and spatial gene expression
using Affymetrix® Arabidopsis GeneChip ATH1 arrays. We
have employed a large-scale analysis of the Arabidopsis
nectary transcriptome in order to develop a more com-
plete picture of the genetic programming fundamental to
nectar production and secretion. We identify a subset of
genes preferentially expressed in nectaries, and distin-
guish the gene complement upregulated in actively secret-
ing nectaries compared to immature and non-secretory
nectaries. Potential genes and pathways involved in nec-
tary development and function are discussed. The result-
ant data provide a starting-point for reverse genetics
approaches to identify specific genes integral to nectar
synthesis and secretion.
Results
Nectary samples
Floral nectaries are responsible for producing the complex
mixture of compounds found in nectar. Surprisingly, a
global picture of gene expression in nectaries is currently
lacking; however, Arabidopsis nectaries are loosely con-
nected to adjacent floral tissues and can be manually dis-
sected from local non-nectariferous tissues (e.g.,
Additional file 1). Individual Arabidopsis nectaries are
extremely small, thus ~200–300 nectaries were pooled
and processed as single biological replicates as indicated
in Table 1 (each replicate was isolated from different
plants). Specifically, RNA was isolated from immature lat-
eral nectaries (ILN; pre-secretory), mature lateral nectaries
(MLN; secretory), and mature median nectaries (MMN,
relatively non-secretory). Typical isolations yielded ~300
to 500 ng of total RNA, and were processed for mircroar-
ray hybridizations following a single round of RNA ampli-
fication.
Each of the following parameters demonstrated the qual-
ity of hybridization and scanning for all nectary samples:
signal gradient severity on each chip was under 0.08; out-
lier area was less than 0.06%; the 3'/5' ratio of housekeep-
ing genes (GAPDH and ubiquitin) were less than 2.5,
'present' call ranges were 40~50%; average intensity
ranged from 304 to 618; and all biological replicates con-
sistently had correlations greater than 96%. After quality
evaluation, nectary data were then co-normalized with 51
publicly available .cel files representing 13 tissues at mul-
tiple developmental stages (see Additional file 2) [41].
Hybridization data were processed with the Expressionist®
Analyst module to call gene expression as 'present' or
'absent' in all biological replicates of the nectary tissues
examined (quality setting of 0.04 in Expressionist® Analyst
software). The number of genes called 'present' in all rep-
licates for each nectary type were: ILN, 11,246; MLN,
9,748; MMN, 11,358. All together, 12,468 genes were
Table 1: Arabidopsis thaliana nectary tissues used for Affymetrix ATH1 microarray analyses
Floral stageaTissue source Replicates
14–15 (post-anthesis) Mature lateral nectary (MLN; secretory) 3
14–15 (post-anthesis) Mature median nectary (MMN; non-secretory) 2
11–12 (pre-anthesis) Immature lateral nectary (ILN; pre-secretory) 3
a As defined by Smyth et al., 1990 [67]

BMC Plant Biology 2009, 9:92 http://www.biomedcentral.com/1471-2229/9/92
Page 4 of 16
(page number not for citation purposes)
confidently expressed in all replicates of one or more nec-
tary tissues, with 9,066 genes being called 'present' (co-
expressed) in all nectary experiments. A full list of
'present' genes, along with normalized probe signal val-
ues, can be found in Additional file 3.
Genes preferentially expressed within nectary tissues
We foremost wished to identify genes preferentially
expressed in nectary tissues since they are likely to be key
mediators of nectary development and function. Thus, as
mentioned above, we obtained 51 previously published
ATH1 array data files representing 13 tissues at multiple
developmental stages ([41]; tissues described in Addi-
tional file 2). Expression data for all probes were co-nor-
malized to the median probe cell intensity with our
nectary samples as described in the Methods section (see
Figure 2A; full normalized expression data available in
Additional file 3). We subsequently calculated normal-
ized signal ratios of individual nectary types against each
individual reference tissue. A t-test P value cutoff of 0.05
in probe set signal intensity and a FDR q-value cutoff of
0.1 were initially used to identify genes significantly
upregulated in each nectary type over each individual tis-
sue; for downstream analyses, all genes displaying a three-
fold or greater increase in probe signal intensity in at least
one nectary type (MLN, ILN and/or MMN) over each indi-
vidual non-nectary reference tissue were determined (the
highest observed FDR for any individual 'significant' gene
was 0.081; see Table 2 and Additional files 4, 5 and 6).
The three-fold cutoff for signal intensity ratio was utilized
in this instance to allow a focus on a relatively small
number of genes with relatively high enrichment in nec-
taries, as they are likely key mediators of nectary form and
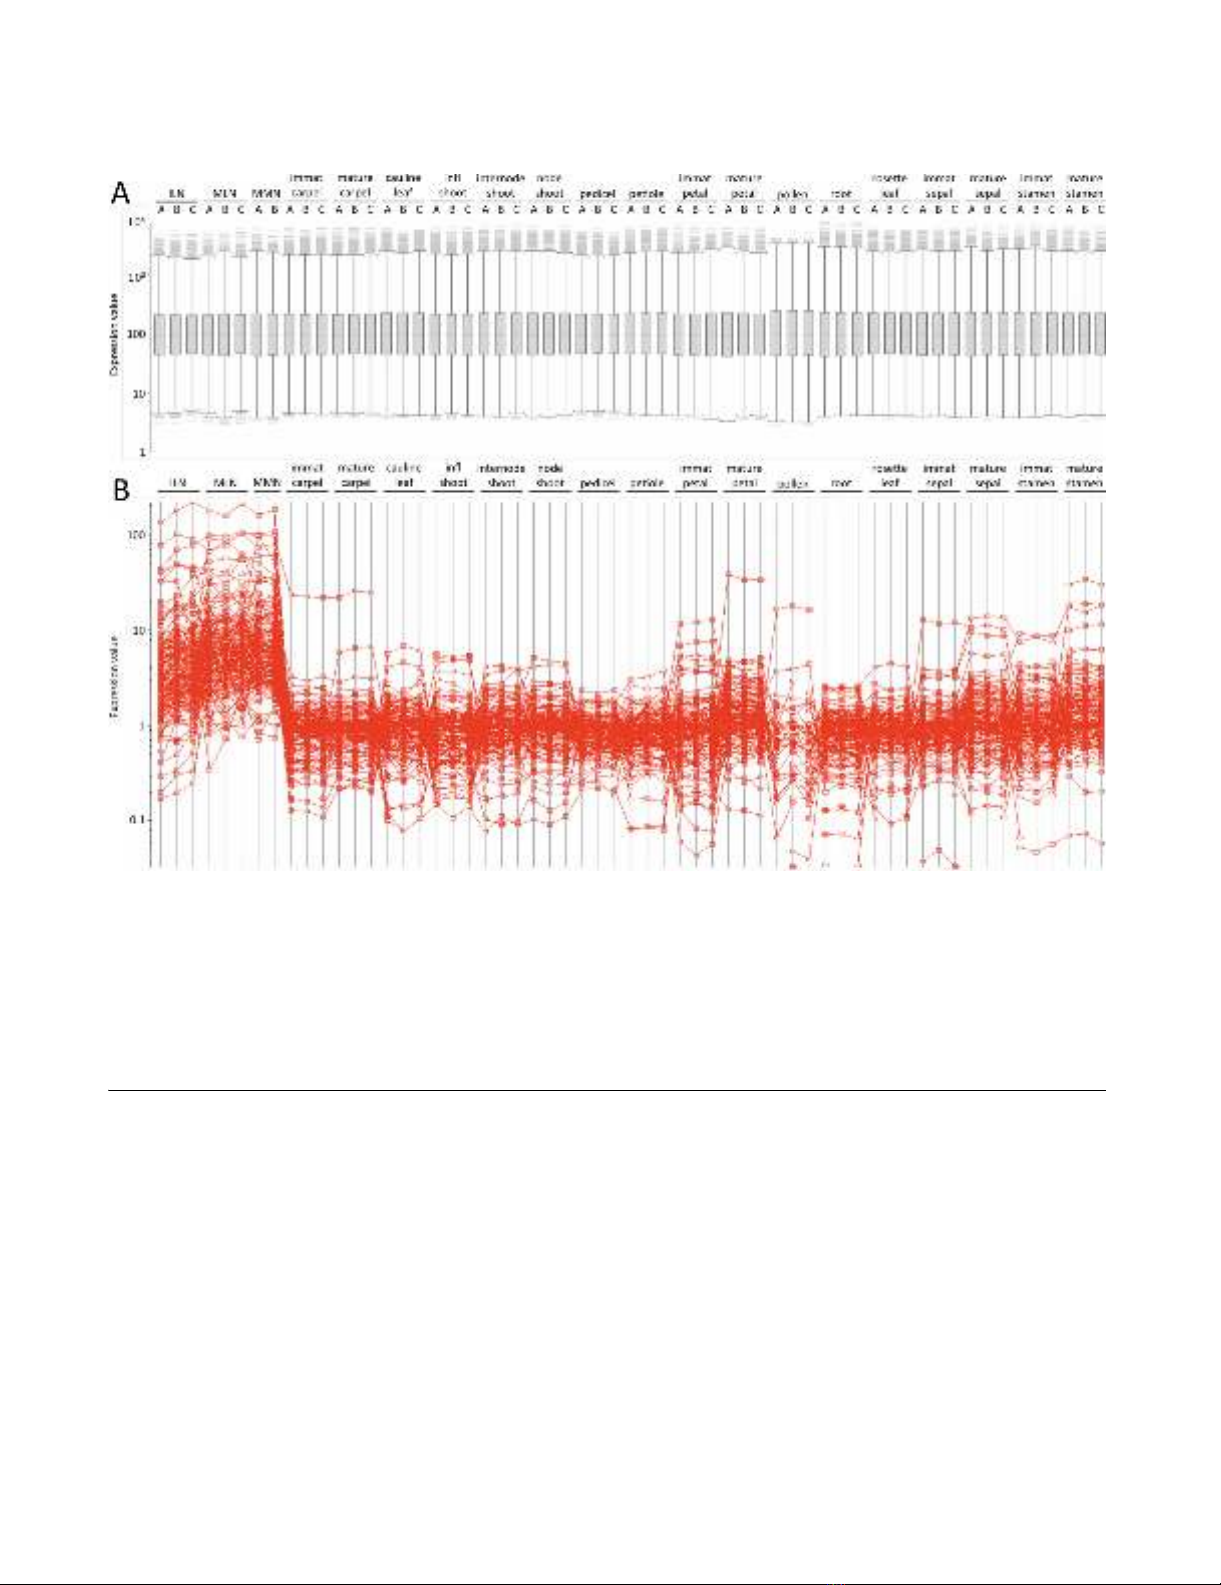
function. A graphical representation of the signal profiles
for all 'significant' genes is displayed in Figure 2B. Ulti-
mately, this analysis identified 270 genes upregulated in
one or more of the nectary tissues over each individual ref-
erence tissue, with the resultant genes being listed in Addi-
tional file 7.
All plants used for nectary collection were grown under a
16 hour light/8 hour dark cycle, with nectary isolation
occurring from 4–8 hours after dawn (h.a.d.). The ration-
ale for this growth and collection scheme was that Arabi-
dopsis flowers fully open by ~3 h.a.d., and nectar
production in closely related Brassica napus peaks from
mid-morning to mid-day (~4 to 8 h.a.d.) [48]. Thus we
wished to capture gene expression profiles in nectaries
occurring during periods of active secretion. An important
item for consideration when evaluating the co-normal-
Table 2: Summary of the identification of nectary-enriched genes
Nectary tissues
Immature lateral nectary (ILN) Mature lateral nectary (MLN) Mature median nectary (MMN)
Reference tissues Replicates Significant genesaReplicates Significant genesaReplicates Significant genesa
Carpel, Immature 3,3 1,053 3,3 2,081 2,3 2,127
Carpel, Mature 3,3 1,059 3,3 2,154 2,3 2,166
Petal, Immature 3,3 714 3,3 1,410 2,3 1,455
Petal, Mature 3,3 1,166 3,3 1,003 2,3 1,061
Sepal, Immature 3,3 1,141 3,3 1,686 2,3 1,697
Sepal, Mature 3,3 1,441 3,3 1,254 2,3 1,291
Stamen, Immature 3,3 1,557 3,3 1,708 2,3 1,720
Stamen, Mature 3,3 1598 3,3 1,120 2,3 1,181
Petiole 3,3 1,157 3,3 2,014 2,3 2,060
Root 3,3 1,826 3,3 2,366 2,3 2,366
Rosette Leaf 3,3 1,268 3,3 1,771 2,3 1,849
Cauline Leaf 3,3 1,319 3,3 1,378 2,3 1,517
Pollen, Mature 3,3 3,923 3,3 3,658 2,3 3,892
Pedicel, Mature 3,3 1,154 3,3 1,918 2,3 2,001
Node Shoot 3,3 1,109 3,3 1,738 2,3 1,760
Internode Shoot 3,3 1,191 3,3 1,358 2,3 1,440
Inflorescence Shoot 3,3 1,271 3,3 2,363 2,3 2,385
Commonb--- 87 --- 198 --- 195
a Number of 'present' genes displaying a 3-fold or greater difference in probe signal intensity in ILN, MLN, & MMN over each individual non-nectary
reference tissue; a t-test p value cutoff of 0.05, and false discovery rate (FDR) q value cutoff of 0.1 were initially applied to identify genes with
significant differences in expression. The highest q value observed for any individual gene after applying the 3-fold cutoff was 0.081.
b The overlapped common gene number represents those genes displaying significant changes that were expressed 3-fold or higher in a given
nectary type over all individual reference tissues. The genes identified from this analysis were used to generate Additional file 7; a total of 270
unique genes were found to be upregulated in one or more nectary types over all individual reference tissues.
BMC Plant Biology 2009, 9:92 http://www.biomedcentral.com/1471-2229/9/92
Page 5 of 16
(page number not for citation purposes)
ized probe signal values described above is that the down-
loaded AtGenExpress gene expression data (see
Additional file 2) were obtained from plants grown under
continuous (24 hour) light conditions. Considering that
roughly 11% of Arabidopsis genes display diurnal
changes in expression (Schaffer et al., 2001), some of the
observations in this study may be due to differences in the
growth conditions used. Despite the use of different light
regimes, comparisons between nectary and AtGenExpress
microarray data confirmed the expression of multiple
genes known to be upregulated in nectary tissues (see
Table 3). Moreover, the expression patterns of multiple
nectary-enriched genes identified through comparisons of
co-normalized probe signal values were later validated by
RT PCR (see below). Finally, there is also precedent in the
literature for making this kind of comparison with AtGen-
Express data (e.g., [49,50]), which further validates the
type of analysis presented here. Thus, while the use of
identical growth conditions for all plants would have
been ideal for these comparisons, taking advantage of the
large publicly available data sets and co-normalizing it
with the nectary data presented here provides a means for
identifying genes and pathways with nectary-enriched
expression profiles.
Differential expression of genes between nectary types
and developmental stages
Individual nectary types were also compared to one
another to identify differentially expressed genes, which
may be involved in nectary maturation and nectar secre-
Signal normalization amongst tissues and resultant clusteringFigure 2
Signal normalization amongst tissues and resultant clustering. A box plot representation of signal normalization is
presented in panel A. All nectary and non-nectary reference tissue hybridization files (.cel) were quality inspected and then
normalized together using the Expressionist® (Genedata, Basel, Switzerland) Refiner module in order to compare gene expres-
sion between nectaries and non-nectary tissues. Briefly, .cel files were loaded into Refiner, analyzed and inspected for defective
area, average intensity, corner noise, and housekeeping control genes. The probe signals on each .cel file then were quantile
normalized and summarized into probe set intensity values by applying the Robust Multiarray Average (RMA) algorithm [69].
Following normalization, signal ratio comparisons between nectaries and reference tissues identified large numbers of genes
preferentially expressed within nectaries (panel B), which are presented in Additional file 7.


![PET/CT trong ung thư phổi: Báo cáo [Năm]](https://cdn.tailieu.vn/images/document/thumbnail/2024/20240705/sanhobien01/135x160/8121720150427.jpg)


