
Hindawi Publishing Corporation
EURASIP Journal on Image and Video Processing
Volume 2011, Article ID 537372, 19 pages
doi:10.1155/2011/537372
Research Article
A Similarity-Based Approach for Audiovisual Document
Classification Using Temporal Relation Analysis
Zein Al Abidin Ibrahim,1Isabelle Ferrane,2and Philippe Joly2
1LERIA Laboratory, Angers University, 49045 Angers, France
2IRIT Laboratory, Toulouse University, 31062 Toulouse, France
Correspondence should be addressed to Zein Al Abidin Ibrahim, zibrahim@info.univ-angers.fr
Received 1 June 2010; Revised 28 January 2011; Accepted 1 March 2011
Academic Editor: Sid-Ahmed Berrani
Copyright © 2011 Zein Al Abidin Ibrahim et al. This is an open access article distributed under the Creative Commons Attribution
License, which permits unrestricted use, distribution, and reproduction in any medium, provided the original work is properly
cited.
We propose a novel approach for video classification that bases on the analysis of the temporal relationships between the basic
events in audiovisual documents. Starting from basic segmentation results, we define a new representation method that is called
Temporal Relation Matrix (TRM). Each document is then described by a set of TRMs, the analysis of which makes events of
a higher level stand out. This representation has been first designed to analyze any audiovisual document in order to find events that
may well characterize its content and its structure. The aim of this work is to use this representation to compute a similarity measure
between two documents. Approaches for audiovisual documents classification are presented and discussed. Experimentations are
done on a set of 242 video documents and the results show the efficiency of our proposals.
1. Introduction
Motivated by the fact that large scale document indexing
cannot be handled by human operators, researches tend to
use high-level automatic indexing with the recent existing
huge masses of digital data. Several automatic tools are based
on low-level feature extraction. For audiovisual documents,
low-level features can be the result of audio, image or video
processing. However, finding the discriminating character-
istics is still a challenging issue, especially if one wants to
keep the detection of the basic events reliable and robust
enough. Another challenge is to detect events of a sufficiently
high semantic level and to produce indexes that are highly
relevant according to the document content and structure.
Such indexes will then allow requests such as, “I am looking
for an interview of Mister X by Miss Y about the movie Z”to
be in a high-level information retrieval task.
From an automatic indexing point of view, answering
these requests requires searching among the available audio-
visual documents in order to find the ones that contain such
events.Thisrequirementresultsintwomajorobjectives.
The first consists in proposing a method for automatically
standing out a document structure due to the different events
that are occurring in it. This leads to the second objective
which is to make automatic classification according to these
document structures.
To reach those goals, we first analyze the audiovisual doc-
ument content from a temporal and generic point of view.
For audiovisual documents, time is a central component, so
each document has a beginning, an end, and a length and
contains different events. In its turn, each event has also
a beginning, an end, and a length. However, the detection
of these events depends on what the underlying definition
of an event is and also on the granularity of the events
themselves. Generally, results of automatic analysis of the
audio/video components indicate when a specific feature has
been detected. Thus, whatever the media is and whatever
its basic characteristics are, we already have temporal basic
events that can be described by elementary descriptors.
Combining these temporal events can be a way to detect
more relevant events and to improve the semantic level
of the document content analysis. The generic side of
our approach lies in the fact that we are trying to be
independent from any prior knowledge about the document
type (sports, news, movie...), its production rules (how it
is structured), or the specific events it may contain. Even

2 EURASIP Journal on Image and Video Processing
if some tools are extracting basic events from a single
medium (image [1], video [2], or audio [3]), most of the
approaches are recently focusing on the combination of basic
events (color, shape, activity rate, texture...)extractedfrom
several mediums. Even though some of them are based on
multimodal extraction [4], they remain limited by the fact
that they are looking for well-defined semantic classes of
events (goal, play, and break phases in sports games, reports
in news programs) in a specific type of document (sports,
news programs...) or a specific content (soccer, baseball,
football, ...). Some efforts have been made to generalize
event detection techniques but they are still bound to a
specific domain like sports [5]. In its turn, our approach can
be also considered a generic characteristic as it is based on
the temporal analysis of document content without being
constrained by the video type, its structure, or the containing
events.
The rest of this paper is organized as follows. In Section 2,
we give a short summary concerning the basic principles of
our approach, and we show what kind of events can stand
out from document content. Then, in Section 3we explain
how we define a similarity measure which will be the basis of
our two document classification methods. We also describe
and discuss the results of our experiments on document
classification before concluding and presenting some work
perspectives in Section 4.
2. Temporal Relationship Analysis
Temporal representation has been already addressed by some
of the existing works [6–9]. These approaches aim at defining
basic units and to express temporal relationship between
them. The existing models depend on the type of the
temporal unit used (point or interval) and the temporal con-
straints taken into account (qualitative, quantitative). In the
qualitative models, the interest is to observe the nature of the
relations. For example, the relation “I before J” is a qualitative
temporal relation. On the other hand, the quantitative ones
focus on numerical features such as the distance between the
start of J and the end of I.
The temporal models of the literature are point-based
[10–12], interval-based [13–16], or the mixture of the two
[17–20].
In [21], Allen has proposed the well-known model that
describes the relationships between intervals by means of
thirteen relationships. This approach is more generic than
others but we still want to be more generic and to take
into account any relation between events whatever the events
may be (points, intervals, or the two) without losing the
quantitative information. The first step of our method
consists in analyzing a document content by studying the
temporal relations between the events that it may contain,
basing on the parametric representation of these relations as
it is explained in the next paragraph.
2.1. Parametric Representation of Temporal Relations. In
apreviouspaper[
22], we have presented all the basic
principles of the parametric representation of temporal
relations which is the core of our work. Here we present the
main points of this representation.
As an input, we use a set of Nelementary segmentations
made on a same document. Such segmentations are defined
as a set of temporally disjointed segments, where each
segment is a temporal interval. Each temporal interval rep-
resents the occurrence of a specific type of event. Each event
indicates the presence of a specific low-level or mid-level
feature in the document, such as speech, music, applauses,
speaker (from audio), and color, texture, activity rate, face
detection, costume (from video). These segmentations can
be done automatically or manually, and are represented as
follows. Any elementary segmentation Seg that contains M
segments is defined by: Seg ={Si};i∈[1, M]. In its turn,
each segment Siis characterized by its two endpoints: its
beginning (Sib) and its end (Sie) and will be written: Si=
[Sib,Sie].
As it is proposed in [23], any temporal relation R
between two segments is defined by three parameters: the
distance between segments-ends (DE), the distance between
segments-beginnings (DB) and the gap between the two
segments (Lap). Let us consider (Seg1,Seg
2)apairof
elementary segmentations that contain (M1,M2)segments,
respectively. We compute the three parameters between all
the possible couples of segments (S1i,S2j)∈Seg1×Seg2;
i<j.
DE =S2je −S1ie;DB=S1ib −S2jb;Lap=S2jb −S1ie.
(1)
More formally, Rcan be written:
S1iRDE, DB, LapS2j.(2)
Considering all the possibilities, we will have M1×M2
temporal relations. However, if the two segments are too far
from each other, the temporal relation between them will
be less relevant. In other words, two events e1and e2may
probably be semantically related if they are not far away from
each other. To avoid considering all the possible temporal
relations between the events that are very far in distance
from each other, we limit the scope of our considered
temporal relations by introducing a threshold αfor the
distance between any compared pair of segments. αis chosen
empirically basing on some observations that we have made
on some audiovisual documents, and then it is used to select
only the relations that verify the condition Lap <α.Nextwe
explain how we based on these first steps in order to compute
a Temporal Relation Matrix.
2.2. Temporal Relation Matrix (TRM). As we have seen, each
temporal relation is represented by a set of three parameters.
This set can be considered as the coordinates of a point
in a three-dimensional space, or as cell-indexes in a three-
dimensional matrix. The former representation allows us to
visualize all the observations made between two elementary
segmentations Seg1and Seg2in a graphical way, while the
latter can be used as a vote (co-occurrence) matrix, in which
theoccurrenceofeachtemporalrelationwillbecounted.

EURASIP Journal on Image and Video Processing 3
Each time the same values for the three parameters (DE, DB,
Lap) is observed, the value of the corresponding cell in the
matrix is incremented. This helps in calculating the temporal
relation frequency and to further study the TRM content.
Building such a matrix is not quite simple. Each ele-
mentary segmentation is based on the detection of a specific
feature in a given medium. Thus, a quantization step must
be done before computing the TRM because the audio
and video components do not possess the same temporal
units. Audio segments must be aligned on each point
corresponding to an image (the video lower unit). This step
is also interesting because it takes us from the real space
to the integer one in the parameter computation. However,
for a document with a set of N elementary segmentations,
the number of corresponding TRMs will be (N∗(N−1))/2.
The first step of a TRM analysis is to study the number
of the observed temporal relations and their distribution in
the 3D space. This distribution is related to the nature of
the temporal relations to observe. If they are predefined like
the Allen’s ones (see Section 2), so the semantic of these
relations will introduce some constraints on the parameters
scope and significant subparts of the TRM can be identified.
For example, the (DE, DB, Lap) parameters of the “MEETS”
relation take values in (]0 + ∞], [−∞0[, {0}). On the other
hand, if these relations are completely unknown, we will
need an automatic method that can put forward the main
zones in which temporal relations are distributed. After this
step, we will be able to find if any relevant interpretation
can be deduced. The importance of the latter method is
that we base on the distribution of the point in the space
in order to induce the temporal relations. In other words,
we base on the quantitative information in order to obtain
the qualitative one. In contrast, we do not have any prior
semantic interpretation of the observed temporal relations.
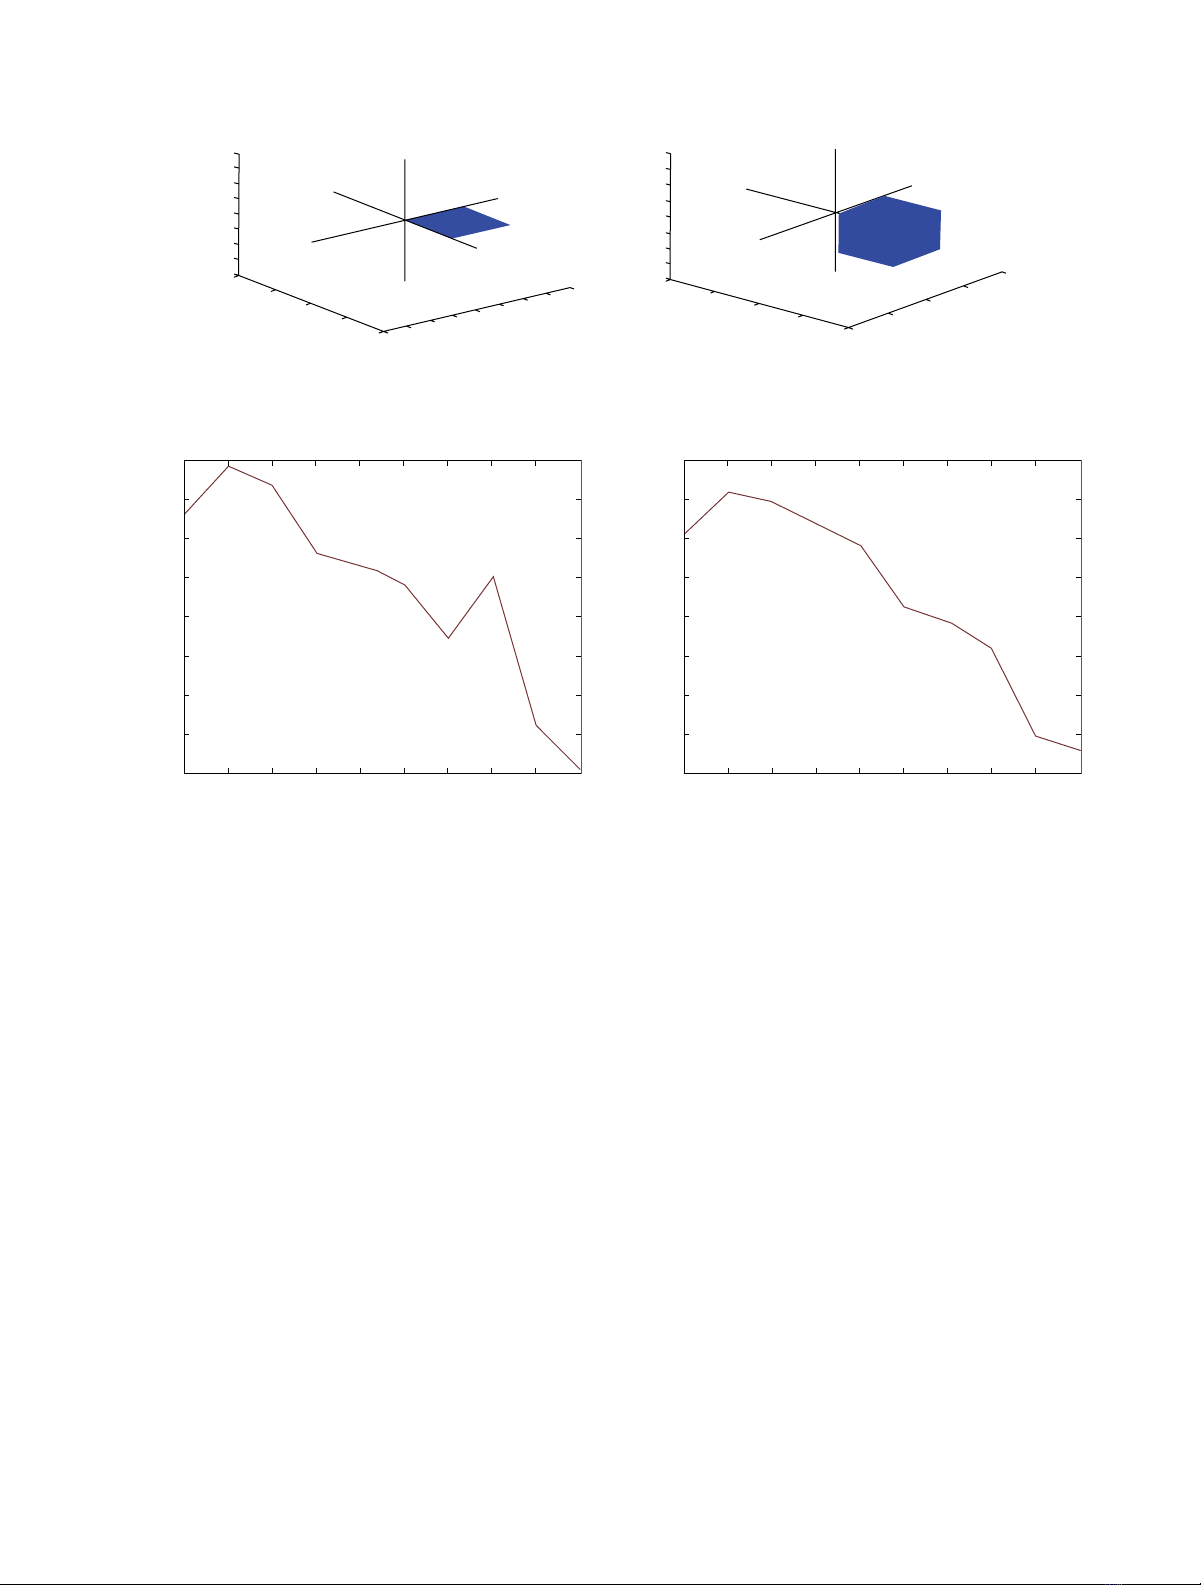
2.3. Distribution of Temporal Relations. We a re consi der ing ,
as an example, four of the thirteen Allen’s relations between
couple of temporal intervals (or segments): before, overlaps,
meets, and equals. Each relation defines a zone in which
observations will be located. Considering each temporal
relation as a point p having the coordinates (x,y,z)with
x=DE, y=DB, and z=Lap. We can see that the first and
the second zones are subparts of a 3D space, while the third
one is a plane space and the fourth zone is a half straight line.
BEFORE =p=x,y,z,0<z≤α,y<−z,x>z
,
OVERLAPS =p=x,y,z,z<0, y<0, x>0,
MEETS =p=x,y,z,x>0, y<0, z=0,
EQUALS =p=x,y,z,x=0, y=0, z<0.
(3)
The scope limit αhas been taken into account when it has
been relevant. The graphical representation of the “MEETS”
and “OVERLAPS” relations are shown in Figure 1.
A temporal relation alone may not be significant. The
occurrence number of the temporal relations, inside of the
subpart of the TRM to which they belong, will be significant
and will determine if the associated class of temporal
relations is or is not relevant enough. Thus, once the different
subparts have been identified, a global occurrence number
is associated to each one. This number is the sum of all the
votes corresponding to the temporal relations belonging to
the subpart.
Our objective is to be as generic as possible and not to
limit ourselves to a set of predefined relations like Allen’s
ones. For this aim, we need to use an automatic classification
method to identify classes of relations. Then, each class
is represented by the occurrence number of the temporal
relations it contains.
2.4. Temporal Relation Matrix Classification. For data clas-
sification in the TRMs, we use the well-known K-means
method. On the other hand, the errors produced by the
segmentation tools affect the TRM calculation. We have
presented some experiments that mainly concern the way of
handling segmentation errors and studying their effects on
TRM calculation. In these experiments, the fuzzy C-means
method is used in the classification phase [24]. The main
problem of the former method is that the number of classes
(K) needs to be initially set. To make our approach more
generic, we have tried to automatically determine the optimal
number of classes for each TRM. So, we use a splitting
algorithm that is coupled with an information criterion
as the one of Rissanen type [25]. The main idea of this
algorithm is to apply the k-means several times with different
values for kand then to retain the value that gives the most
pertinent distribution.
Next, we explain some experimentation results that we
have already obtained by applying this classification method
[26]. In these experiments, we use a video document with
thirty-one minutes duration. This video is a TV-game in
which two teams, each with two players (speaker #2, speaker
#3) and (speaker #4, speaker #5), are playing. This program
contains three animators. Speaker #1 is the principal one
that animates the game while speaker #6 and speaker #7 are
secondary ones that present the audiences that participate to
the game and the lot of gifts to be won. One audience is also
appearing in the program (speaker #8).
Figures 2and 3, respectively, represent two experiments
of two steps: (1) determining the optimal Knumber, and (2)
classifying TRMs. From an audio point of view, our TV-game
video contains eight elementary speaker segmentations that
have been manually extracted. While from a video point of
view, face segmentations have been automatically extracted
using the tool proposed in [27]. A TRM is computed for each
couple of speakers (speaker segmentations) which means a
total of twenty-eight TRMs for the speaker segmentations. α
threshold in its turn has been fixed to 10 seconds. The value
of 10 gave more significant results, due to the nature of the
document content as we will explain later. The maximum
value of the Rissanen criterion has determined the optimal
number of classes to 2, and the obtained results are shown in
Figure 2.
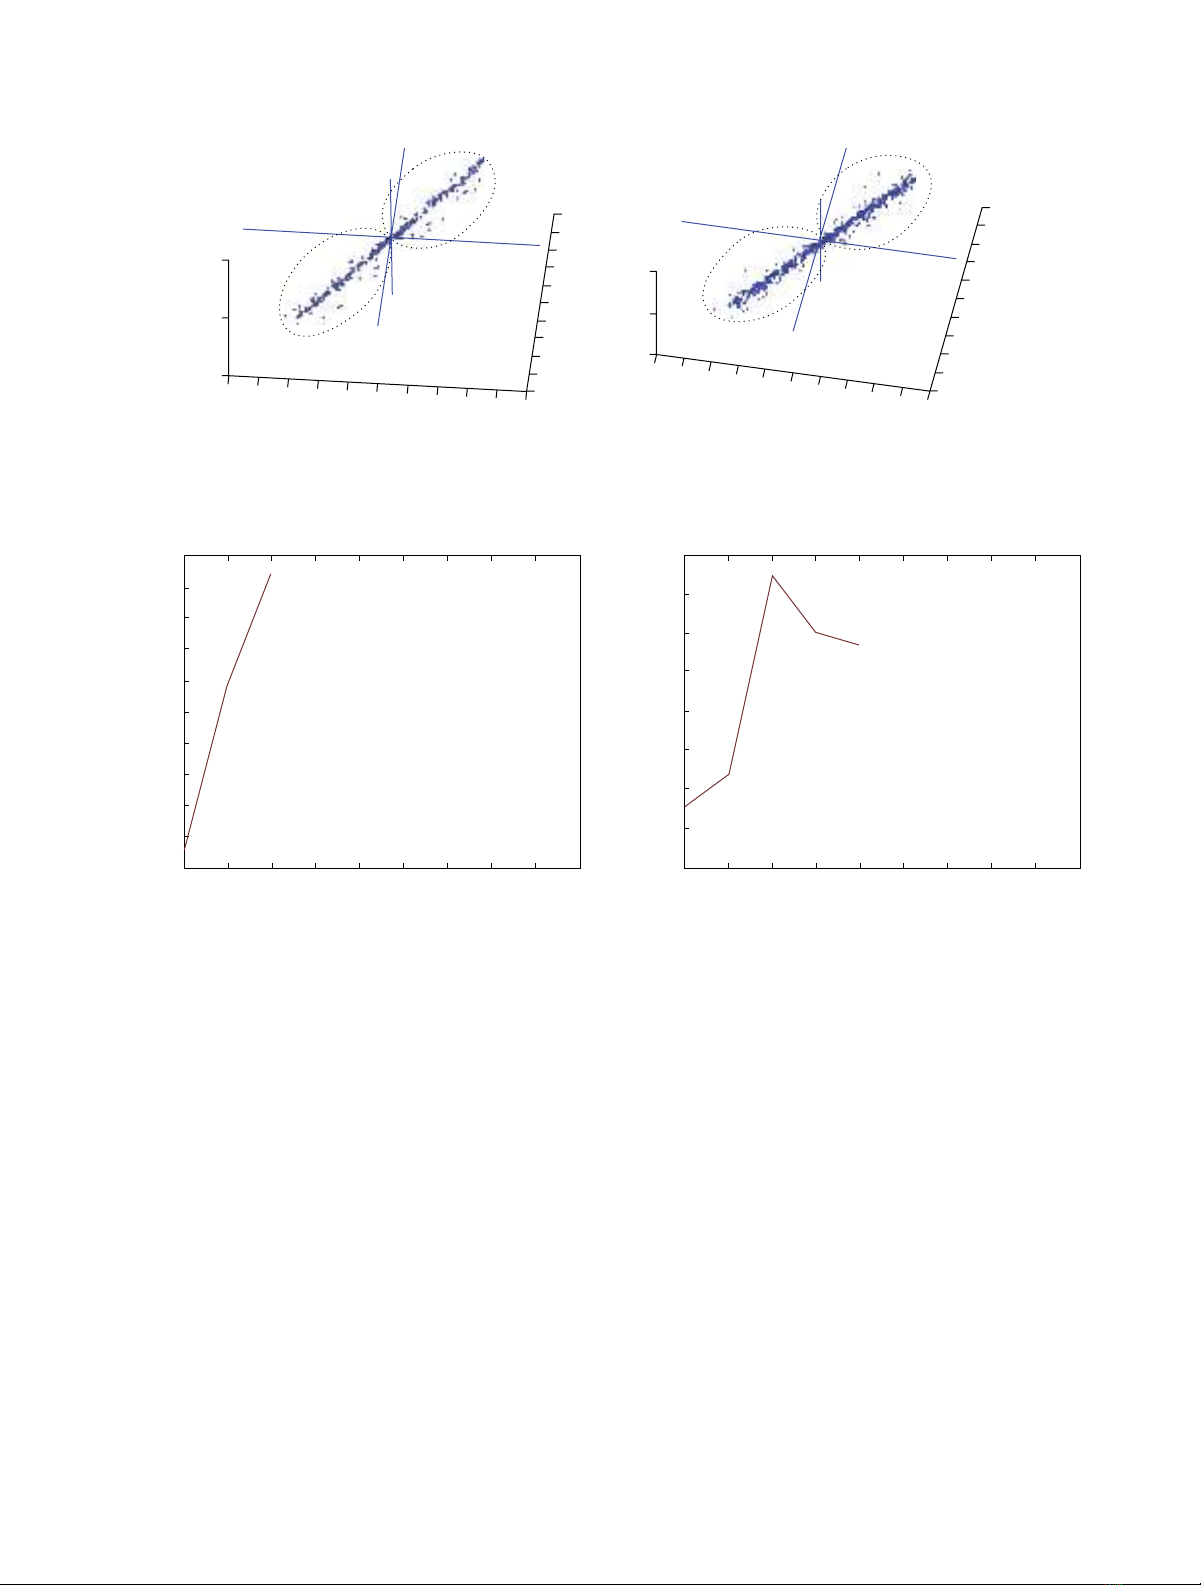
In Figures 3(a) and 3(b), respectively, we can see the
graphical representation of the temporal relations computed
between the speaker #4 and the speaker #5 (speaker #2
4 EURASIP Journal on Image and Video Processing
−40
−20
0
20
40
Lap
−40 −20 020 40
DE
−40
−20
0
20
40
DB
(a)
−40
−20
0
20
40
Lap
−40 −20
020 40
DE
−40
−20
0
20
40
DB
(b)
Figure 1: Graphical representation of the MEETS (a) and OVERLAPS (b) relations.
10987654321
Class number
−3420
−3400
−3380
−3360
−3340
−3320
−3300
−3280
−3260
Rissanen criterion
(a)
10987654321
Class number
−6400
−6350
−6300
−6250
−6200
−6150
−6100
−6050
−6000
Rissanen criterion
(b)
Figure 2: (a) Rissanen criterion value function of the class number for the TRMS(2,3), (b) Rissanen criterion value function of the class
number for the TRMS(4,5).
and speaker #3, resp.), on which the result of a 2-class
classification has been applied. The TRM in the Figure 3(b)
(TRMS(4,5), S means speaker segmentation) contains 450
votes (245 for class C1 and 205 for class C2) while the TRM
(TRMS(2,3))intheFigure3(a) contains 247 votes (123 for
classC1and124forclassC2).
Tab le 1contains the distribution of votes between classes
in each TRM where we can notice the previously commented
results.
We then apply the same process on faces. Figures 4and
5represent two other examples for the face #4 and face #5
(face #2 and face #3, resp.). Figure 4shows the optimal class
number decision (here it is 3 for the two TRMs), and Figure 5
shows the TRMs and the three-class classification results.
Tab le 2shows the distribution of votes between classes in
each TRM. In this table, C3 is equal to zero when the optimal
number of clusters in the corresponding TRM is equal to two.
After applying these first analysis steps, the question that
may be asked is: “Are these classes of temporal relations
related to more semantic events than those initially used?”
2.5. TRM Content Analysis and Event Detection. Regarding
the set of TRMs and the occurrence (vote) numbers of their
classes, the question is now to determine if these numbers
are carrying any semantic information about the document
content. In this section, we give a glance about what this
semantic information may be, particularly, in the case of our
TV-game video.
Thefirstnotethatwecanmakeisthat,inpractice,an
empty TRM between two segmentations means no interac-
tion or relevance between them. For example, considering
the TRM computed between face and applauses segmenta-
tions. An empty TRM (or even low number of votes) means
that the applauses segments are not related to the appearance
of a face on the screen. In other words, the applauses
segments are completely independent from the appearance
of a face on the screen. On the other hand, having an
important number of votes between two segmentations
certainly indicates a specific event that relates them. Return-
ing to the previous example, the high number of votes
indicates that the applauses segments are related directly
to the appearance of the face on the screen. An additional
remark is that, a two-class classification with a quite balanced
number of occurrences between them may result in having
a kind of exchange between the two segmentations in use.
More specifically, considering our TV-game example, further
EURASIP Journal on Image and Video Processing 5
C2
C1
−500
0
500
500
300
100
−100
−300
−500
500 300 100 −100 −300 −500
(a)
−500
0
500
500
300
100
−100
−300
−500
500 300 100 −100 −300 −500
C2
C1
(b)
Figure 3: (a) Graphical representation of the TRMS(2,3) and two-class classification results, (b) graphical representation of the TRMS(4,5) and
two-class classification results.
10987654321
Class number
−2200
−2180
−2160
−2140
−2120
−2100
−2080
−2060
−2040
−2020
−2000
Rissanen criterion
(a)
10987654321
Class number
−4000
−3900
−3800
−3700
−3600
−3500
−3400
−3300
−3200
Rissanen criterion
(b)
Figure 4: (a) Rissanen criterion value function of the class number for the TRMF(2,3), (b) Rissanen criterion value function of the class
number for the TRMF(4,5).
investigations on number, duration, and exchanges alterna-
tion would give other clues on the nature of these exchanges
(interview, conversation, debate...). Moreover, in case of
having a segmentation with no empty TRM with any of
the other segmentations, this implies that this segmenta-
tion is interacting in a significant way, with each of the
other segmentations. This clue is not only interesting from
a semantic content point of view, but it also indicates the
specific role of this segmentation.
By mapping the previous semantic clues to our TV-game
video, several results can be obtained. First, we can notice the
high number of votes in TRMS(2,3) and TRMS(4,5). This is due
to the fact that in this TV game, these two couples of speakers
(2,3) and (4,5) correspond to two teams of players who are
playing together and this is why many exchanges between
players of each couple can be observed. On the other hand,
regarding the nature of the document, a player can take few
seconds to think about the answer he or she is going to give.
Within a scope threshold of only one second, many temporal
relations were missed. For this reason, we tend to raise the α
value to 10, which helps us to get more significant results.
Furthermore, by considering TRMS(2,4),TRM
S(2,5),
TRMS(3,4),andTRM
S(3,5), we can observe that they are
practically empty. That is because each player of a team has
no occasion to exchange words with any player in the other
team.
Moreover, in our example, speaker #1 has no empty
TRMs and this is logical as it is the animator which interacts
with all the other speakers.
More advanced analysis step is applied to retrieve more
semantic information about the content. The idea consists in
taking two temporal relations belonging to different classes
C1, C2, and looking for a third temporal relation that may be
the composition (composition operator) of the two previous
ones. For example, let C1 represent the event “the speaker
A is talking to the speaker B”, and the class C2 associated
to the event “speaker B is talking to speaker A”. A new class
of relations may be the result of the composition of C1


