
JOURNAL OF HEMATOLOGY
& ONCOLOGY
Micallef et al. Journal of Hematology & Oncology 2010, 3:13
http://www.jhoonline.org/content/3/1/13
Open Access
REVIEW
BioMed Central
© 2010 Micallef et al; licensee BioMed Central Ltd. This is an Open Access article distributed under the terms of the Creative Commons
Attribution License (http://creativecommons.org/licenses/by/2.0), which permits unrestricted use, distribution, and reproduction in
any medium, provided the original work is properly cited.
Review
Applying mass spectrometry based proteomic
technology to advance the understanding of
multiple myeloma
Johann Micallef
1,2
, Moyez Dharsee
3
, Jian Chen
3
, Suzanne Ackloo
3
, Ken Evans
3
, Luqui Qiu
4
and Hong Chang*
1,2
Abstract
Multiple myeloma (MM) is the second most common hematological malignancy in adults. It is characterized by clonal
proliferation of terminally differentiated B lymphocytes and over-production of monoclonal immunoglobulins.
Recurrent genomic aberrations have been identified to contribute to the aggressiveness of this cancer. Despite a
wealth of knowledge describing the molecular biology of MM as well as significant advances in therapeutics, this
disease remains fatal. The identification of biomarkers, especially through the use of mass spectrometry, however,
holds great promise to increasing our understanding of this disease. In particular, novel biomarkers will help in the
diagnosis, prognosis and therapeutic stratification of MM. To date, results from mass spectrometry studies of MM have
provided valuable information with regards to MM diagnosis and response to therapy. In addition, mass spectrometry
was employed to study relevant signaling pathways activated in MM. This review will focus on how mass spectrometry
has been applied to increase our understanding of MM.
Multiple Myeloma
Multiple myeloma (MM), the second most common
blood cancer in adults, is a neoplasm of terminally differ-
entiated B-cells characterized by clonal expansion of
malignant plasma cells in the bone marrow. The most
common symptoms associated with MM include lytic
bone lesions, renal failure, calcium dysregulation, anemia
and susceptibility to infections. The median age at diag-
nosis of MM is 62 years for men and 61 years for women,
with less than 2% of those diagnosed at an age less than
40 years. The incidence of MM in the USA is more com-
mon among men (7.1 per 100,000) than women (4.6 per
100,000). In addition, MM is two times more frequent in
the black population than in the white population [1].
Despite advances in clinical care, MM remains an almost
universally fatal disease with a median survival of 3-4
years following conventional treatment and 5-7 years
with high dose therapy followed by autologous stem cell
transplantation [1].
The development of MM constitutes a series of pro-
gressive genetic events. A seminal event is the inappro-
priate translocation of oncogenes from partner
chromosomes into the immunoglobulin heavy chain
switch region (IgH) locus on chromosome 14q32. In the
past several years, five recurring translocation partners
have been defined and mapped to the earliest stages of
the developing MM clone [2-4]. The translocations
involve partner oncogenes cyclin D1 (11q13), cyclin D3
(6p21), fibroblast growth factor receptor 3 (FGFR3,
4p16), c-maf (6q23) and mafB (20q11). These recurrent
translocations are identified with high frequency in pri-
mary patient samples and, between them, are found in
approximately 50% of MM [5,6]. The remaining 50% of
MM lack translocations and are characterized by chro-
mosomal duplication (hyperdiploidy) with associated up-
regulation of cyclins D1, D2 and D3 although the molecu-
lar pathogenesis is unclear [5]. An equally early event in
the genesis of MM appears to be loss of part of chromo-
some 13 at 13q14.3, although the specific tumor suppres-
sor gene(s) in this region have yet to be identified [7,8].
These events all occur early in disease onset and are often
present during an asymptomatic and stable form of the
disease called monoclonal gammopathy of unknown sig-
nificance or MGUS. Active disease must therefore
* Correspondence: hong.chang@uhn.on.ca
1 Department of Laboratory Hematology, University Health Network, 200
Elizabeth Street, Toronto, M5G-2C4, Canada
Full list of author information is available at the end of the article

Micallef et al. Journal of Hematology & Oncology 2010, 3:13
http://www.jhoonline.org/content/3/1/13
Page 2 of 11
require subsequent genetic events such as mutation/dele-
tion of p53 or Ras mutations [9].
We have evaluated the prognostic significance of recur-
rent genomic aberrations including del(13q), t(11:14)/
CyclinD1, t(4;14)/FGFR3, t(14;16)/c-Maf, del(17p)(p53),
1q21(CKS1B) amplification, 1p21/CDC14a deletion, and
PTEN deletions, as well as CD56 expression in large
cohorts of MM patients uniformly treated at our center
[10-26]. In addition we have evaluated the impact of
chromosomal aberrations on MM patients receiving
novel therapies such as the proteasome inhibitor, borte-
zomib or the immunomodulatory drug lenalidomide.
While high-risk genetic factors (t(4;14, del(17p)(p53)
deletion, or 13q deletion) did not affect the response or
survival of refractory/relapsed MM patients treated with
bortezomib [27], del(17p)(p53) deletion had a negative
influence on progression free and overall survival of MM
patients receiving lenalidomide and dexamethasone [28].
In addition to the cytogenetic studies which have given
us significant insight into MM diagnosis and prognosis,
gene-expression profiling of MM has also significantly
contributed to our understanding of this disease. Due to
the highly heterogeneous nature and complexity of MM,
gene expression profiling is well suited to study this can-
cer as it allows for the identification and differentiation of
hundreds of genes between various disease states. Several
groups have used gene expression arrays, for example, to
evaluate drug response in MM patients. Mulligan et al.
identified a pretreatment expression pattern and predic-
tive markers that could differentiate between bortezomib
and dexamethasone response [29]. Other groups have
used expression arrays to identify genes involved in doxo-
rubicin and dexamethasone resistance in MM [30,31].
Gene expression arrays have also been used to determine
the genetic differences between plasma cells and MGUS
and MM cells [32]. These studies have made significant
contributions to our understanding of the molecular
development as well as mechanisms of drug resistance of
MM.
A complementary approach to the study of gene
expression profiling is proteomic profiling. The advan-
tages of this approach, which has been increasing in pop-
ularity over the past several years, is the ability to
determine protein expression levels, post-translational
modifications and protein-protein interactions, all of
which may have a direct consequence to cell function;
such information cannot be obtained through gene
expression profiling. Furthermore, several studies found
that there is not a significant overlap between gene and
protein expression profiles [33-35]. Therefore direct
approaches to studying the protein profile of MM are
necessary.
Traditional methods to study proteins, such as western
blot analysis or immunohistochemistry, have their short-
comings as high throughput solutions for protein profil-
ing including the need for large amounts of tissue as well
as the availability of well-characterized antibodies. Mass
spectrometry techniques, on the other hand, offer a
robust, high throughput method that overcomes many of
these limitations [36]. Most important to cancer research,
mass spectrometry can be employed to identify known
and novel differentially expressed proteins between dif-
ferent tumor samples. This would allow for the identifica-
tion of biomarkers that can be used in diagnosis,
prognosis, and treatment assessment.
Mass Spectrometry
A mass spectrometer determines the mass of a molecule
by measuring its mass-to-charge ratio (m/z). Each mass
spectrometer consist of three components; i) the source,
which generates ions from a sample either by matrix-
assisted laser desorption ionization (MALDI) or electro-
spray ionization (ESI), ii) a mass analyzer, which resolves
peptide ions according to their m/z ratio, and iii) a detec-
tor which determines ion abundance for each corre-
sponding ion resolved by the mass analyzer according to
their m/z value and generates a mass spectrum (Figure 1).
Depending on the type of mass spectrometer used, pep-
tide mass (MS) and/or peptide sequence (MS/MS) data
can be obtained from the mass spectrum. This informa-
tion is then used to search public databases for protein
identification such as those maintained by the National
Center for Biotechnology Information (NCBI) and the
European Bioinformatics Institute (EBI).
Mass Spectral Analysis
Biological samples including cell lines maintained in cul-
ture, biopsy specimens, and serum are very complex in
nature as they contain not only an abundance of proteins,
but also a large amount of lipids and nucleic acids [36].
Although the mass spectrometer is capable of resolving
complex mixtures, protein identification can be greatly
simplified if this complexity is reduced. Biological sam-
ples are typically lysed with detergents that solubilize
proteins, separating them from lipids and nucleic acids.
Subsequent procedures can then be employed to further
simplify the protein mixture. One dimensional gel elec-
trophoresis can be used to separate proteins according to
their molecular weight. Alternatively, two-dimensional
gel electrophoresis can be used to achieve greater protein
separation by resolving proteins according to their iso-
electric value (pI) and molecular weight. Following elec-
trophoresis proteins are stained with dyes such as
Coomassie blue, excised, digested "in-gel" into peptides
and then analyzed by the mass spectrometer. Although
gel electrophoresis is capable of reducing the complexity
of a mixture it has its limitations [37]. Most notably, gel
electrophoresis has a limited dynamic range of detection
Micallef et al. Journal of Hematology & Oncology 2010, 3:13
http://www.jhoonline.org/content/3/1/13
Page 3 of 11
as protein bands are excised only if they can be visualized
following staining. The level of detection by MS, however,
is below the level of detection of staining and hence many
relevant proteins may be missed. A further disadvantage
of 2D separation is that it is often difficult to reproduce
and some proteins cannot be resolved according to their
pI value [37].
An alternative method to reduce the complexity of a
protein mixture is the use of liquid chromatography (LC)
[36]. Typically, proteins are first digested into peptides
and then resolved by LC. The separation of peptides is
usually achieved according to charge and molecular
weight. Often, the peptides that are resolved by LC are
directly analyzed by the mass spectrometer. The main
advantage of LC is that this method avoids the low
dynamic range limitation encountered by gel staining.
Quantitative Proteomics
In order to improve the diagnosis, prognosis and treat-
ment stratification of those afflicted by cancer the identi-
fication of biomarkers indicative of these parameters are
necessary. Quantitative protein analysis by mass spec-
trometry in which a tumor cell may be compared to a
normal cell or a drug resistant tumor cell is compared to a
drug sensitive tumor cell, provides an effective way to dis-
cover these biomarkers. There are two main methodolo-
gies to quantify proteins within a sample, stable isotope
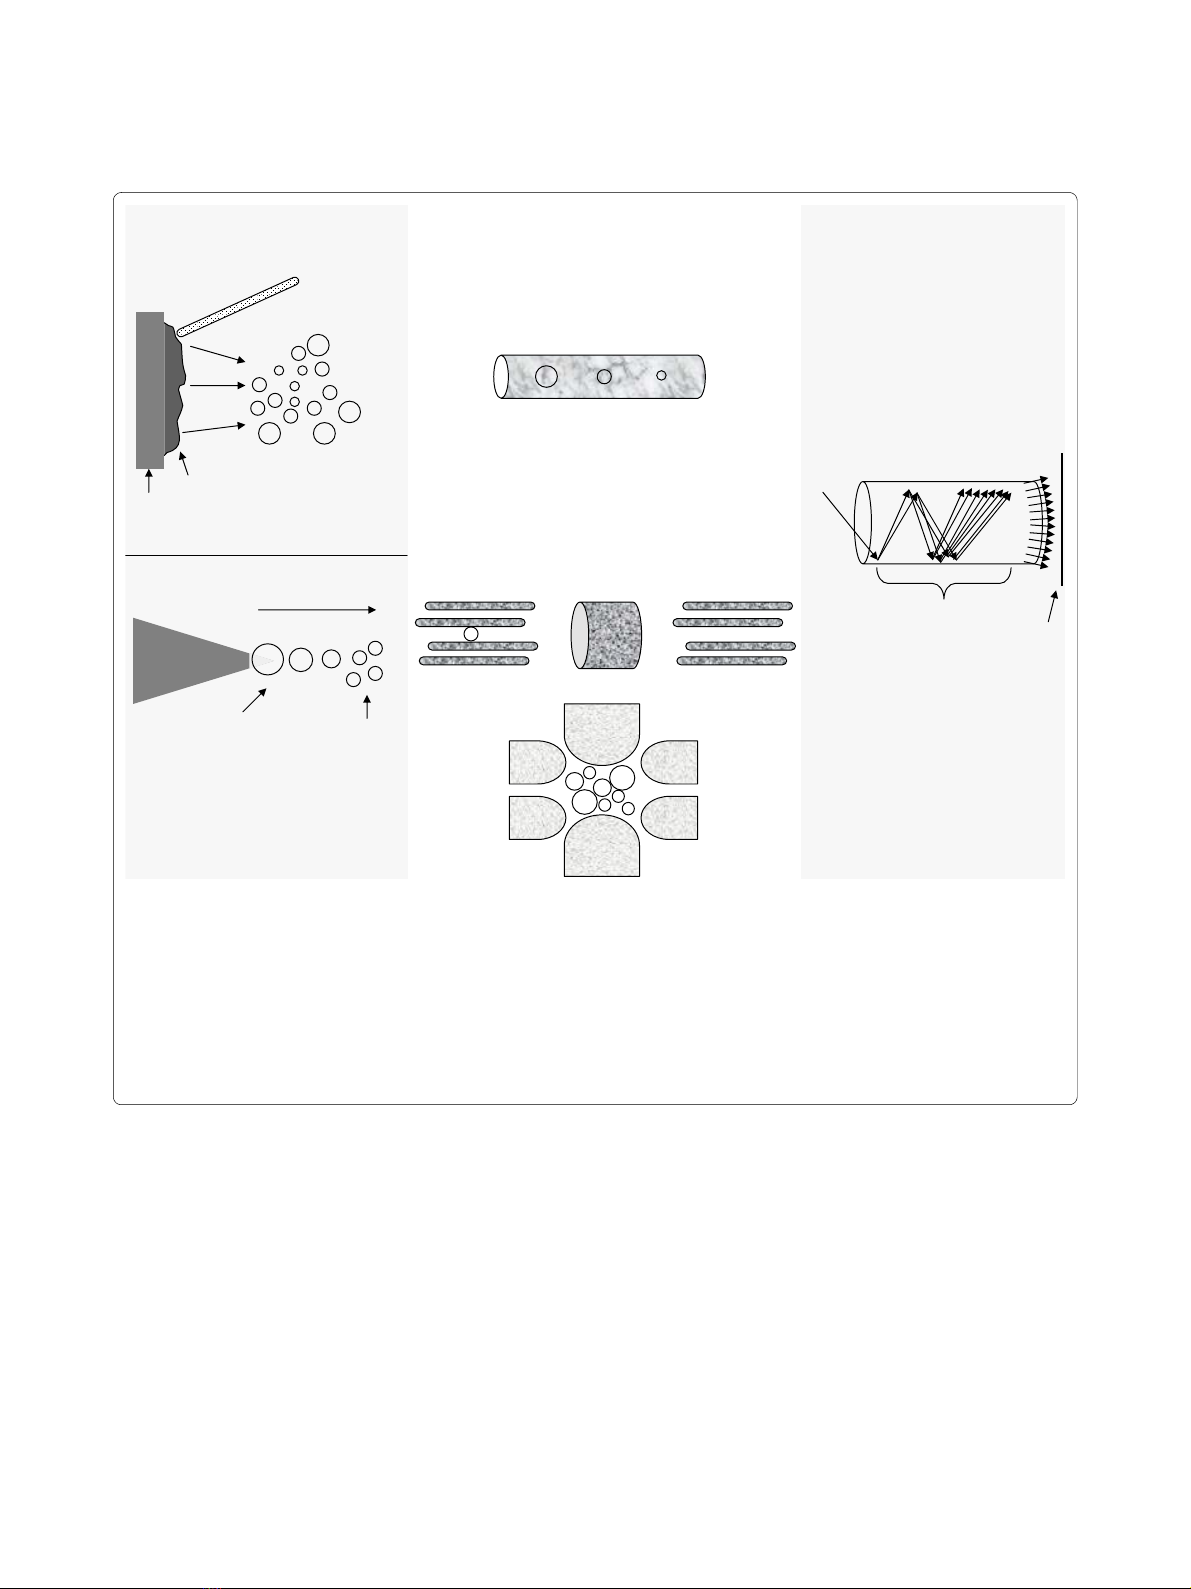
Figure 1 The mass spectrometer. (A) Source. In ESI a liquid containing a protein/peptide mixture is passed through a high-voltage capillary tube
resulting in charged peptides. In MALDI, a laser is used to excite a chemical matrix containing peptides leading to ejection of charged peptides into
the gas phase. (B) Mass analyzers. The quadrupole uses both AC and DC current to affect the trajectory of incoming charged particles. The first qua-
drupole acts as a mass filter allowing only certain ions to pass into the second quadrupole, the collision cell, where they collide with a neutral gas,
undergo fragmentation and enter into the third quadrupole that also acts as a mass filter. The ion-trap mass analyzer uses an AC voltage to "trap" ions.
By increasing the AC amplitude, ions of increasing m/z ratio are ejected and measured by the detector. In Time of Flight (TOF), ions of different m/z
values are injected into one end of the tube so that they each have approximately identical kinetic energy as they accelerate through the tube. Ions
of less mass will reach the detector faster than those that are heavier. (C) Detector. As an ion strikes the surface of the electron multiplier detector, it
causes the emission of electrons, which in turn results in the release of secondary electrons. This multiplication process results in the generation of
100 million electrons per incident ion. The arrival of the electron pulse registers as a single ion count.
+
+
++ +
+
+
+
+
++
++
+
+
+
+
+++ +
+
+
+
+
+
++
+
+
+
+
+
++
+
+
++
+
+
+ +
+
+
++
+
++
+
+
+
+
+
+
+
+
A) Source B) Mass Analyzer C) Detector
time of flight
quadrupole
ion-trap
electron multiplier
M.A.L.D.I.
E.S.I.
LASER
ions of different m/z ratio
solvated
ions
++
+
desolvated
ions
desolvation
matrix
sample
secondary electrons
outgoing
electrons
incoming
electron
recorder

Micallef et al. Journal of Hematology & Oncology 2010, 3:13
http://www.jhoonline.org/content/3/1/13
Page 4 of 11
labeling and label free methods. Both these techniques
have been widely used for biomarker discovery [38-45].
One of the most commonly used stable isotopes is the
isobaric tags for relative and absolute quantification
(iTRAQ). The iTRAQ method allows the simultaneous
comparison of up to 8 different samples. The iTRAQ
reagent labels the N-terminus of tryptic peptides as well
as the amino group side chain of lysine residues [36]. Pro-
teins from different samples are first digested to yield
peptides. Each peptide sample is then labeled with one of
the iTRAQ reagents. Each reagent consists of i) a reporter
group with a molecular weight of 113, 114, 115, 116, 117,
118, 119, or 121 Da; ii) a linker group that also varies in
molecular weight to 'balance' the difference of the
reporter group; and iii) a peptide reactive group that
reacts with the N-terminus of peptides and lysine side
chains. Labeled samples are then mixed together and
analyzed by the mass spectrometer. Collision induced
dissociation of iTRAQ-labeled peptides generates
sequence information as well as relative quantification
data between the samples.
Recent trends in discovery proteomics are now inclined
towards using label-free relative quantification based on
the linear relationship between sampling statistics
observed using LC-MS/MS and relative protein abun-
dance [46]. Sampling statistics evaluated as potential
measures of relative protein abundance include 1) the
mean peak area intensity of all peptides identified for an
individual protein in a complex sample [47]; 2) the pep-
tide count, or total number of peptides identified from a
given protein in a LC-MS/MS experiment [46,48]; and 3)
spectral counts, or the total number of tandem mass
spectra generated on a given peptide in an LC-MS/MS
experiment [47,49-52].
The use of label free techniques has several advantages
[53]. First it is more cost effective and less time consum-
ing compared to labeling methods since the labeling
reagents do not have to be purchased and experiments to
incorporate the stable isotopes into samples are bypassed.
Label free methods therefore require less sample modifi-
cation and avoid increasing sample complexity associated
with mixtures of tagged peptides. A second advantage of
label free methods is that theoretically there is no limit to
the number of samples that can be compared whereas
with isotope labeling such as iTRAQ a maximum of 8
samples can be compared at a time. Another advantage of
the label free method is that it may provide a higher
dynamic range in terms of quantification, although this
comes at the expense of unclear linearity and relatively
low accuracy [53]. Although there are several advantages
to label free methods, it is essential that these methods
are robust and reliable in order to control for any experi-
mental variables and that sample processing does affect
the outcome of analyses [54].
Mass Spectrometry to study Multiple Myeloma
Serum markers for MM diagnosis and prognosis
One of the greatest challenges we face in the clinical set-
ting is the development of tests that would allow for the
early detection of cancer. It is well accepted that the ear-
lier tumor cells are detected, the better the prognosis.
Certain cancers, including breast, colon and prostate can
be detected at an early stage through routine physical
exams. For example, screening for prostate specific anti-
gen (PSA) may be useful for the early detection of pros-
tate cancer. Unfortunately, there are no reliable
biomarkers that can be used for the early detection of
MM and patients are often diagnosed after presenting
with clinical manifestations.
A recent study has found that virtually all cases of MM
arise from MGUS [55]. On the other hand, the majority of
MGUS cases will not develop into MM. Although the sta-
tus of M-protein may offer insight into the development
of MM, it is not absolute, and thus there is a need to iden-
tify biomarkers that can predict progression to MM in
patients diagnosed with MGUS.
Several groups have been using mass spectrometry
based techniques in order to identify potential biomark-
ers that are early predictors of cancer development [56-
61]. Elucidation of these early biomarkers for various can-
cers, including MM, would be most easily identified from
plasma or serum. The advantage of screening blood is
that it is easily obtained and contains a large amount of
proteins which increase the likelihood of biomarker dis-
covery [62]. One strategy for the early detection of cancer
relies on the immune response, which is believed to make
auto-antibodies against cancer cells and because the
immune response involves an amplification process,
these antibodies may be present in sufficient quantities
for detection [63,64]. Regardless of the type of biomarker,
it will be essential that they are both tumor specific and
tissue specific so that the identification and location of
the tumor can be determined. Because an overlap most
likely exists in biomarker expression between different
tumor types, a panel of biomarkers would have to be
identified rather than relying on a single protein.
In addition to the identification of early biomarkers that
can predict MM, it is also clinically relevant to identify
markers that are used for the diagnosis and prognosis of
MM. Currently these include calcium, creatinine, hemo-
globin, albumin, beta2-microglobulin and monoclonal
antibodies. In addition, disease relapse can be monitored
by assessing the levels of monoclonal antibodies includ-
ing heavy chains as well as κ and λ light chains. Koomen's
group is currently developing mass spectral techniques
that will allow for the quantitative detection of immuno-
globulin associated peptides [65]. As MS analysis within
the clinical setting becomes more accepted and afford-
able, successful development of these tests could offer

Micallef et al. Journal of Hematology & Oncology 2010, 3:13
http://www.jhoonline.org/content/3/1/13
Page 5 of 11
advantages over current clinical tests that are more quali-
tative in nature, slower, and of lower throughput [65].
Several groups are using mass spectrometry to identify
additional biomarkers that may allow for a more specific
and sensitive method to diagnose MM. Wang et al.
employed MALDI-TOF-MS and identified a panel of
three biomarkers that correctly identified 26 out of 30
(87%) MM patients and 34 out of 34 (100%) of all normal
donors [66]. However, these markers were unable to dif-
ferentiate between MM and other plasma cell dyscrasias
including MGUS, Waldenstrom's macroglobulinemia,
solitary plasmacytoma, as well as other tumors with
osseus metastasis. Therefore, as the authors mention, it
will be necessary to increase their samples size in order to
identify additional markers that may unequivocally iden-
tify MM patients. Nevertheless this work demonstrates
the usefulness of MALDI-TOF MS for the identification
of novel biomarkers.
Another group also used mass spectrometry to identify
serum biomarkers that might discriminate between
patients with skeletal involvement [67]. This group
screened serum samples from 48 patients either with evi-
dence of skeletal involvement (24 patients) or without
evidence of skeletal involvement (24 patients). Using a
partial least squares discriminant analysis (PLS-DA), and
a non-linear, random forest (RF) classification algorithm,
they were able to predict skeletal involvement with an
accuracy between 96-100% using the PLS-DA model and
obtained a specificity and sensitivity of 87.5% each with
the RF model based on four peaks. Although this study
demonstrates the usefulness of proteomic profiling in the
diagnosis and treatment of MM progression, further vali-
dation studies in additional patient samples are needed.
Proteins that confer drug resistance in Multiple Myeloma
As mentioned earlier, MM remains a largely incurable
disease despite a plethora of chemotherapeutic drugs.
This is mainly due to the acquisition of drug resistance by
tumor cells. The molecular mechanisms responsible for
drug resistance are not well understood. Moreover, it is
likely these resistance pathways are unique for each drug.
Two scenarios can be envisioned in the acquisition of
drug resistance. First, tumor cells may express proteins
prior to drug treatment that will render them resistant,
and second, tumor cells may acquire resistance following
drug administration. An understanding of the molecular
signatures that confer drug resistance will be of signifi-
cant benefit in treatment stratification and will enable the
design of novel therapeutic strategies.
Bortezomib
Bortezomib, a proteasome inhibitor, has been approved
for the treatment of MM patients who have received at
least two prior therapies and progressed during the last
treatment [68-70]. This drug has been shown to induce
apoptosis in various cancer cells, including MM and
other lymphomas. It also affects nuclear factor-kB (NF-
kB), the bone marrow microenvironment and various
cytokine interactions, including, IL-6 [68-70]. Despite
significant benefits with regards to time to progression,
overall survival and a trend to a lower incidence of infec-
tions >grade 3, bortezomib induced an overall response
rate of only 35% in refractory and relapsed MM patients
(pivotal phase-II (SUMMIT) trial) [68]. In order to deter-
mine if recurrent molecular cytogenetic changes identi-
fied in MM contribute to the response of bortezomib
therapy, we used fluorescence in situ hybridization com-
bined with cytoplasmic immunoglobulin light chain
stainings (cIg-FISH) and found that the response to bort-
ezomib was independent of recurrent genomic aberra-
tions in MM patients [27]. These observations were
confirmed by two independent research groups [71,72].
In light of the above observations, our group is taking a
proteomic based approach in order to identify biomark-
ers that may predict and contribute to bortezomib resis-
tance. To undertake this study we have used iTRAQ
analysis to identify differentially expressed proteins
between the 8226/R5 bortezomib resistant multiple
myeloma cell line and the 8226/S bortezomib sensitive
multiple myeloma cell line. Using this approach we iden-
tified 30 proteins that were either significantly up or
down regulated in the 8226/R5 cell line compared to the
8226/S cell line [73]. Biological systems analysis of these
putative markers using Ingenuity Pathway Analysis soft-
ware revealed that they were associated with cancer-rele-
vant networks (Figure 2). Of particular interest is the
MARCKS protein which we found to be over-expressed
in the 8226/R5 cell line. MARCKS is a PKC substrate pro-
tein that has been found to be over-expressed in several
cancers, including glioblastoma multiforme where it was
shown to play a role in glioma cell invasion [74]. We have
shown that MARCKS is over-expressed in 9 (50%) of 18
multiple myeloma cell lines. In addition, a preliminary
screen of pre-bortezomib treatment MM patient samples
by immunohistochemistry showed over-expression of
MARCKS is associated with bortezomib resistance. We
are currently evaluating whether MARCKS plays a role in
drug resistance and/or contributes to other tumorgenic
properties of MM.
Protein expression data obtained from our iTRAQ
analysis comparing 8226/R5 versus 8226/S cell lines was
also compared with gene expression array data from the
literature that contrasted MM bortezomib resistant to
bortezomib sensitive cells. As expected, there was mini-
mal overlap between these datasets. However these lists
of genes and proteins showed strong complementarity in
terms of the functional and biological systems with which
they are associated, suggesting the systems affected by
them or those which they affect may be closely inter-


![PET/CT trong ung thư phổi: Báo cáo [Năm]](https://cdn.tailieu.vn/images/document/thumbnail/2024/20240705/sanhobien01/135x160/8121720150427.jpg)


