
Demethylation of radiolabelled dextromethorphan in rat microsomes
and intact hepatocytes
Kinetics and sensitivity to cytochrome P450 2D inhibitors
Annalise Di Marco
1
, Dan Yao
2
and Ralph Laufer
1
1
Department of Pharmacology, Istituto di Ricerche di Biologia Molecolare P. Angeletti (IRBM), Merck Sharp and Dohme
Research Laboratories, Rome, Italy;
2
Labeled Compound Synthesis, Department of Drug Metabolism,
Merck Research Laboratories, Rahway, NJ, USA
Liver microsomal preparations are routinely used to predict
drug interactions that can occur in vivo as a result of inhi-
bition of cytochrome P450 (CYP)-mediated metabolism.
However, the concentration of free drug (substrate and
inhibitor) at its intrahepatic site of action, a variable that
cannot be directly measured, may be significantly different
from that in microsomal incubation systems. Intact cells
more closely reflect the environment to which CYP sub-
strates and inhibitors are exposed in the liver, and it may
therefore be desirable to assess the potential of a drug to
cause CYP inhibition in isolated hepatocytes. The objective
of this study was to compare the inhibitory potencies of a
series of CYP2D inhibitors in rat liver microsomes and
hepatocytes. For this, we developed an assay suitable for
rapid analysis of CYP-mediated drug interactions in
both systems, using radiolabelled dextromethorphan, a
well-characterized probe substrate for enzymes of the
CYP2D family. Dextromethorphan demethylation exhib-
ited saturable kinetics in rat microsomes and hepatocytes,
with apparent K
m
and V
max
values of 2.1 vs. 2.8 l
M
and 0.74 nmolÆmin
)1
per mg microsomal protein vs.
0.11 nmolÆmin
)1
per mg cellular protein, respectively.
Quinine, quinidine, pyrilamine, propafenone, verapamil,
ketoconazole and terfenadine inhibited dextromethorphan
O-demethylation in rat liver microsomes and hepatocytes
with IC
50
values in the low micromolar range. Some of these
compounds exhibited biphasic inhibition kinetics, indicative
of interaction with more than one CYP2D isoform. Even
though no important differences in inhibitory potencies
were observed between the two systems, most inhibitors,
including quinine and quinidine, displayed 2–3-fold
lower IC
50
in hepatocytes than in microsomes. The cell-
associated concentrations of quinine and quinidine were
found to be significantly higher than those in the extracel-
lular medium, suggesting that intracellular accumulation
may potentiate the effect of these compounds. Studies of
CYP inhibition in intact hepatocytes may be warranted for
compounds that concentrate in the liver as the result of
cellular transport.
Keywords: CYP2D; cytochrome P450; hepatocytes; micro-
somes.
The pharmacokinetic and toxicokinetic properties of phar-
maceuticals depend in great part on their biotransformation
by drug-metabolizing enzymes. The main drug-metaboli-
zing system in mammals is cytochrome P450 (CYP), a
family of microsomal isozymes present predominantly in
the liver. Multiple CYPs catalyze the oxidation of chemicals
of endogenous and exogenous origin, including drugs,
steroids, prostanoids, eicosanoids, fatty acids, and environ-
mental toxins [1]. If a drug that is metabolized by a
particular CYP isozyme is coadministered with an inhibitor
of that same enzyme, changes in its pharmacokinetics can
occur, which can give rise to adverse effects [2–5]. It is
therefore important to predict and prevent the occurrence of
clearance changes caused by metabolic inhibition. During
the drug discovery process, it has become routine practice
in the pharmaceutical industry to assess CYP inhibition
potential of drug candidates in order to exclude potent
inhibitors from further development [6–8].
The extent of metabolic interaction between two drugs
depends on their relative K
m
and K
i
values and concentra-
tions at the site of metabolism [3]. In recent years,
substantial progress has been made in the development
of in vitro screening methods to quantitatively determine
kinetic parameters of CYP inhibition. Using either recom-
binant CYP proteins or liver microsomes, together with
appropriate probe substrates, these assays can be used to
measure K
i
values for competitive CYP inhibitors [7,9,10]. It
is not entirely clear, however, whether these systems
accurately and quantitatively reflect drug interactions that
occur in vivo. One possible drawback of recombinant
enzymes is that inhibitory potency may depend on inter-
actions with multiple CYPs present in the microsomal, but
not recombinant, systems. The intracellular concentration
of drugs (substrates and inhibitors) that is available for
interacting with a particular CYP may also depend on
Correspondence to R. Laufer, IRBM P. Angeletti, Via Pontina km
30,600, 00040 Pomezia (Roma), Italy.
Fax: + 39 0691093 654, Tel.: + 39 0691093 440,
E-mail: ralph_laufer@merck.com
Abbreviation: CYP, cytochrome P450.
(Received 5 June 2003, revised 11 July 2003,
accepted 22 July 2003)
Eur. J. Biochem. 270, 3768–3777 (2003) FEBS 2003 doi:10.1046/j.1432-1033.2003.03763.x

processes lacking in microsomes, such as drug transport
across the plasma membrane, metabolism by cytosolic
enzymes, and binding to intracellular proteins. Intact cells
more closely reflect the environment to which CYP
substrates and inhibitors are exposed in the liver, and it
may therefore be desirable to assess the potential of a drug
to cause CYP inhibition in isolated hepatocytes. Isolated
hepatocytes have been used extensively to study drug
metabolism, cytotoxicity, and induction of drug-metaboli-
zing enzymes [11–15]. However, there are few reports of
CYP inhibition studies using this system (see for example
[13,16–18]), probably because of the technical challenge
posed by the lower specific activity of CYP in cultured cells
relative to microsomal preparations.
The objective of this study was to compare the inhibitory
potencies of CYP inhibitors in microsomes and hepatocytes.
We developed an assay suitable for rapid analysis of
CYP-mediated drug interactions in both systems, using
radiolabelled dextromethorphan, a well-characterized probe
substrate for enzymes of the CYP2D family.
Materials and methods
Materials
[O-methyl-
14
C]Dextromethorphan (61 mCiÆmmol
)1
) was
synthesized at Merck Research Laboratories, Rahway,
NJ,USA.[
3
H]Quinine and [
3
H]quinidine were purchased
from American Radiolabeled Chemicals. [
3
H]Taurocholic
acid was from Perkin–Elmer Life Sciences, and [
14
C]for-
maldehyde and [
14
C]formic acid were from Amersham
Biosciences. Cell culture media were purchased from Gibco-
BRL, and chemicals from Sigma. 96-well OasisTM HLB
extraction plates and vacuum mannifold were purchased
from Waters.
Preparation of rat liver microsomes
Liver microsomes were prepared from male Sprague–
Dawley rats. Livers were homogenized in 1.15% (w/v)
KCl, and the homogenate was centrifuged at 9000 gfor
30 min. The S-9 supernatant was centrifuged at 130 000 g
for 1 h. The microsomal pellet was washed, resuspended in
0.15
M
Tris/HCl, pH 7.4, at a protein concentration of
10 mgÆmL
)1
and kept at )80 C.
Isolation of rat hepatocytes
All animal care and experimental procedures were in
accordance with national and company guidelines. Male
Sprague–Dawley rats weighing 250 g were subjected to
terminal anaesthesia using sodium pentobarbital. Rat
hepatocytes were isolated by a two-step collagenase per-
fusion method [19]. Cells were frozen in L15 medium
containing 10% fetal calf serum and 15% dimethyl sulfoxide
following the protocol described by Guyomard et al.[20]
and kept in liquid nitrogen until use. After quick thawing at
37 C, cells were loaded on L15 medium containing 0.75
M
glucose [21] and centrifuged for 1 min at 300 g.Viable
hepatocytes were separated by centrifugation over 30%
Percoll solution for 3 min at 350 g. Cell viability was
determined by Trypan Blue exclusion before freezing and
after thawing and was consistently greater than 90%. The
cells were resuspended in William’s Medium E containing
GlutaMAXTM (Ala-Glu), 5 lgÆmL
)1
insulin, 1 l
M
dexa-
methasone, and penicillin/streptomycin, and seeded on
collagen-precoated 24-well culture plates at a density of
100 000 cells per well. Cultures were maintained at 37 Cin
a humidified atmosphere of 5% CO
2
. Four hours after
plating, the medium was changed as described below.
Separation of [
O-methyl
-
14
C]dextromethorphan
from CYP2D-mediated demethylation products
The CYP2D assay described in this study is based on a
modification of procedures described previously for deter-
mining the activity of various CYP isozymes, including
CYP2D6, in hepatic microsomes [22,23]. CYP-mediated
demethylation of substrates which have the leaving methyl
group radiolabelled with
14
C, yields [
14
C]formaldehyde as
product, which can be isolated using reversed-phase (C8)
extraction cartridges [24]. We adapted this method to
96-well format, and modified the solid-phase matrix using
Oasis extraction plates. Solid-phase extraction was per-
formed using a vacuum mannifold according to the
instructions of the manufacturer. When the radiolabelled
substrate [O-methyl-
14
C]dextromethorphan, dissolved in
either microsomal assay buffer or cell incubation medium,
was applied to 96-well Oasis plates, over 99.7% of
radioactivity was retained on the extraction plate, and
could be recovered by elution with methanol. In contrast,
[
14
C]formaldehyde and [
14
C]formic acid, the products of
CYP-mediated oxidation of [O-methyl-
14
C]dextromethor-
phan, were quantitatively recovered in the combined void
volume and aqueous washing of Oasis extraction plates.
Microsomal CYP2D assays
Microsomal incubations were performed in 96-well conical
plates (Corning). They contained, in a final volume of
100 lL, 0.1
M
potassium phosphate buffer, pH 7.4, 1 l
M
[O-methyl-
14
C]dextromethorphan (15 000 d.p.m. per
assay), rat liver microsomes (3 lg), and NADPH-
regenerating system (1 m
M
NADP, 5 m
M
glucose-6-
phosphate, 3 m
M
MgCl
2
,4UÆmL
)1
glucose-6-phosphate
dehydrogenase). After preincubation for 10 min at 37 Cin
the presence or absence of test compounds, reactions were
started by the addition of the NADPH-regenerating system.
After 15 min, reactions were stopped by the addition of
10 lL1
M
HCl. Plates were centrifuged at 1100 gfor 5 min
using a microplate rotor, and supernatants loaded on 30-mg
96-well Waters Oasis extraction plates. The flow-through
was collected and plates were washed twice with 200 lL
water. Aliquots of the combined aqueous eluates were
counted in a Packard TopCount scintillation counter using
24-well scintillation plates. Product formation was totally
dependent on the presence of NADPH and was linear with
time for up to 20 min, and with microsomal protein
concentrationupto1mgÆmL
)1
(data not shown).
Hepatocyte CYP2D assays
CYP2D assays in hepatocytes were performed at 37 Cin
a humidified atmosphere of 5% CO
2
in 24-well culture
FEBS 2003 CYP2D-mediated drug interactions (Eur. J. Biochem. 270) 3769

plates containing 100 000 cells per well, unless indicated
otherwise. Four hours after plating, cells were incubated
in 500 lL cell incubation medium {hepatocyte culture
medium (HCM [25]), supplemented with ITS + (Colla-
borative Research, Bedford, MA, USA) and 10 m
M
sodium formate, which suppresses the formation of
14
CO
2
from [
14
C]formate in rat hepatocytes [26]}. Plates
were preincubated for 10 min with CYP inhibitors or
vehicle [0.5% (v/v) dimethyl sulfoxide], before addition of
1l
M
[O-methyl-
14
C]dextromethorphan (80 000 d.p.m.
per assay). Reactions were stopped after 15 min by
addition of 50 lL1
M
HCl, and cell lysates were
centrifuged in a tabletop centrifuge at high speed for
10 min. The supernatants were loaded on 30-mg 96-well
Waters Oasis extraction plates and processed as described
above for the microsomal assays, except that extraction
plates were washed three times with 250 lLwater.
Uptake of drugs into rat hepatocytes
Uptake of radiolabelled quinine, quinidine, and taurocholic
acid into rat hepatocytes was determined at 37 Cin250 lL
per well of a solution containing 116 m
M
NaCl, 5.3 m
M
KCl, 1.1 m
M
KH
2
PO
4
,0.8m
M
MgSO
4
,1.8m
M
CaCl
2
,
10 m
M
glucose, and 10 m
M
Hepes, pH 7.4. Some experi-
ments were performed in sodium-free buffer containing
choline chloride instead of NaCl. Incubations with 5 l
M
[
3
H]quinine or [
3
H]quinidine were carried out for 1, 2, 3, 5,
and 10 min in the presence or absence of 2 l
M
carbonyl
cyanide p-trifluoromethoxyphenylhydrazone. Incubations
with 1 l
M
[
3
H]taurocholic acid were performed for 20, 40,
60, 120, and 300 s in the presence or absence of extracellular
Na
+
. Plates were then washed 3 times with 1 mL ice-cold
buffer, cells were lysed with 0.1
M
NaOH, and radioactivity
was determined by scintillation counting. Cell-associated
radioactivity for [
3
H]quinine and [
3
H]quinidine reached
steady-state levels after 10 min (data not shown). Results
were corrected for radioactivity associated with cells at time
zero, and expressed as cell/medium concentration ratio
(C/M) at steady state, using an estimated intracellular
volume of 4 lLÆ(10
6
cells)
)1
[27]. [
3
H]Taurocholate uptake
was linear for up to 2 min (data not shown). Uptake
clearance was calculated by dividing the initial
uptake velocity by the substrate concentration.
Determination of drug binding to hepatic proteins
For the determination of the liver tissue binding of
[
3
H]quinine and [
3
H]quinidine, rat liver was homogenized
in 0.1
M
potassium phosphate buffer and dialyzed against
the same buffer for 12 h at 4 C to remove coenzymes. The
compounds were mixed with tissue homogenates (10, 20
and 30%, w/v) or rat liver microsomes (0.03 mgÆmL
)1
) at
concentrations of 1 or 10 l
M
, and incubated at 37 Cfor
30 min. Reaction tubes were then centrifuged in a tabletop
centrifuge for 20 min at high speed, and the supernatants
were loaded on Centrifree ultrafiltration devices (Millipore)
to separate the unbound fractions. Non-specific adsorption
of [
3
H]quinine to the filters was prevented by precoating
using unlabelled quinine (1 m
M
). The fraction not bound to
liver proteins (f
u
) was calculated according to the following
equation [28]:
fu¼Cf=½Cfþð100=nCbÞ ð1Þ
where C
f
is unbound drug in ultrafiltrate, C
b
is bound
drug, and nis the percentage of liver homogenate.
Biochemical assays
Protein was determined by the Bradford assay (Bio-Rad)
using BSA as standard. Lactate dehydrogenase activity was
determined in hepatocyte cell suspensions before plating,
and in monolayers 4 h after plating, using a colorimetric
method (Cytotoxicity detection kit; Roche Diagnostics).
ATP content of cell monolayers was determined after cell
extraction with 1.7% (w/v) trichloroacetic acid using
luciferase/luciferin reagent (Sigma) and luminescent pro-
duct detection. The intracellular concentration of ATP
was calculated considering an intracellular volume of
4lLÆ(10
6
cells)
)1
[27].
Statistical methods
Curve fitting was performed by nonlinear regression
according to the Levenberg-Marquardt algorithm, using
KALEIDAGRAPH
TM 3.52 (Synergy Software, Reading, PA,
USA). Statistical significance was assessed using a two-
tailed Student’s ttest.
Results
Viability, metabolic and transport activities
of cryopreserved rat hepatocytes
To assess the metabolic state of hepatocytes used in this study,
we determined cell-attachment efficiency, ATP content, and
Na
+
-dependent taurocholate transport, a typical differenti-
ated hepatocyte function mediated by the sodium taurocho-
late cotransporting polypeptide (NTCP) [29]. The efficiency
of cell attachment, determined by measuring cellular lactate
dehydrogenase activities before and after plating, was
70 ± 6% (n¼2). Intracellular ATP concentrations were
2.3 ± 0.4 m
M
(mean ± SEM, n¼3), which is in close
agreement with previously reported values (2.4 m
M
[30]).
Cells transported [
14
C]taurocholate with an uptake clearance
of 24 ± 2 lLÆmin
)1
per mg cellular protein (n¼2). In the
absence of extracellular Na
+
, uptake clearance was reduced
sevenfold. These values are similar to those previously
reported for Na
+
–taurocholate cotransport in rat hepato-
cytes (V
max
/K
m
¼17.5 lLÆmin
)1
Æmg
)1
[29]).
Dextromethorphan O-demethylation in rat hepatocytes
and microsomes
When [O-methyl-
14
C]dextromethorphan was incubated with
rat hepatocytes, radiolabelled reaction product(s) were
produced in a time-dependent and cell-concentration-
dependent manner (Fig. 1). The reaction products were
not retained by OasisTM polymeric reversed-phase sorbent,
similarly to standard [
14
C]formaldehyde and [
14
C]formate
(and unlike the substrate [O-methyl-
14
C]dextromethor-
phan). Metabolite formation from [O-methyl-
14
C]dextro-
methorphan in rat hepatocytes increased with substrate
concentration in a saturable manner (Fig. 2A). The reaction
3770 A. Di Marco et al.(Eur. J. Biochem. 270)FEBS 2003
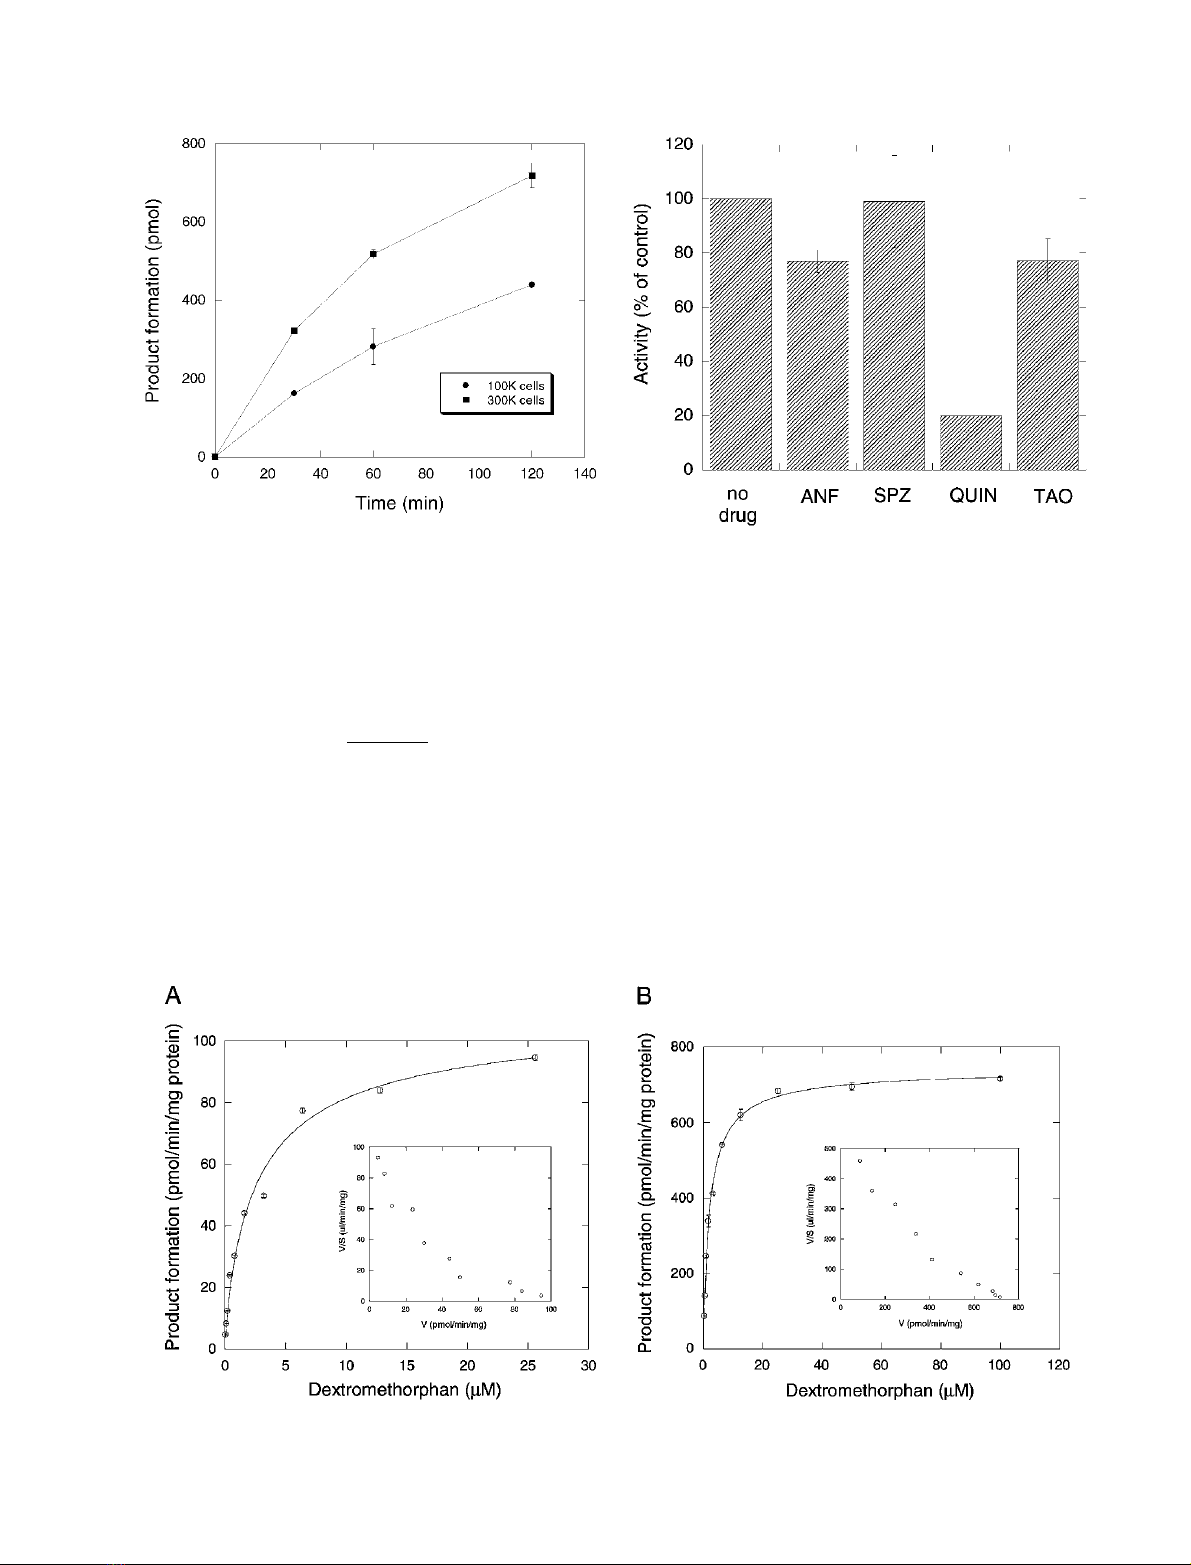
rate as a function of substrate concentration was fitted to
the Hill equation:
v¼Vmax Sn
Sn
50 þSnð2Þ
where vand V
max
are the observed and maximal rates of
metabolism, S
50
is the substrate concentration at
half V
max
, and nis the Hill coefficient. The values
obtained were S
50
¼2.80 ± 0.01 l
M
,V
max
¼0.11 ±
0.01 nmolÆmin
)1
per mg cellular protein, and
n¼0.82 ± 0.01. An Eadie–Hofstee plot of these data
was monotonous, with slight deviation from linearity
(Fig. 2A, inset).
For comparison, we also determined the kinetics of
dextromethorphan O-demethylation in rat microsomes
(Fig. 2B). Fitted kinetic constants were S
50
¼2.10 ±
0.01 l
M
,V
max
¼0.74 ± 0.01 nmolÆmin
)1
per mg micro-
somal protein, and n¼0.88 ± 0.01. Also in this case, the
Eadie–Hofstee plot of these data was monotonous, with
slight deviation from linearity (Fig. 2B, inset).
We next examined the effect of isoform-specific CYP
inhibitors on dextromethorphan O-demethylation. As
shown in Fig. 3, the reaction in rat hepatocytes was
inhibited by quinine, which is a known inhibitor of rat
CYP2D [31–33], but not by a-naphthoflavone (inhibitor of
Fig. 1. Time-dependent and cell-concentration-dependent demethylation
of [O-methyl-
14
C]dextromethorphan in rat hepatocytes. Substrate was
incubated with 100 000 cells (circles) or 300 000 cells (squares) and
product formation was determined at the indicated times. Results are
mean ± deviation from duplicate experiments.
Fig. 2. Kinetics of [O-methyl-
14
C]dextromethorphan demethylation in rat hepatocytes (A) and rat liver microsomes (B). Data were fitted to the Hill
equation as described in Results. Each point is the mean ± deviation from duplicate experiments. Insets: Eadie–Hofstee plots of the data.
Fig. 3. Effect of CYP inhibitors on [O-methyl-
14
C]dextromethorphan
demethylase activity in rat hepatocytes. Results are expressed as per-
centage enzymatic activity relative to that of the vehicle control.
Inhibitors used were: 1 l
M
a-naphthoflavone (ANF), 10 l
M
sulfa-
phenazole (SPZ), 10 l
M
quinine (QUIN), and 10 l
M
troleandomycin
(TAO). Results are mean ± deviation from duplicate experiments.
FEBS 2003 CYP2D-mediated drug interactions (Eur. J. Biochem. 270) 3771
rat CYP1A1/2 [34]), sulfaphenazole (rat CYP2C11 [35]),
and troleandomycin (rat CYP3A [36]). The selected inhi-
bitor concentrations were based on the above literature
references.
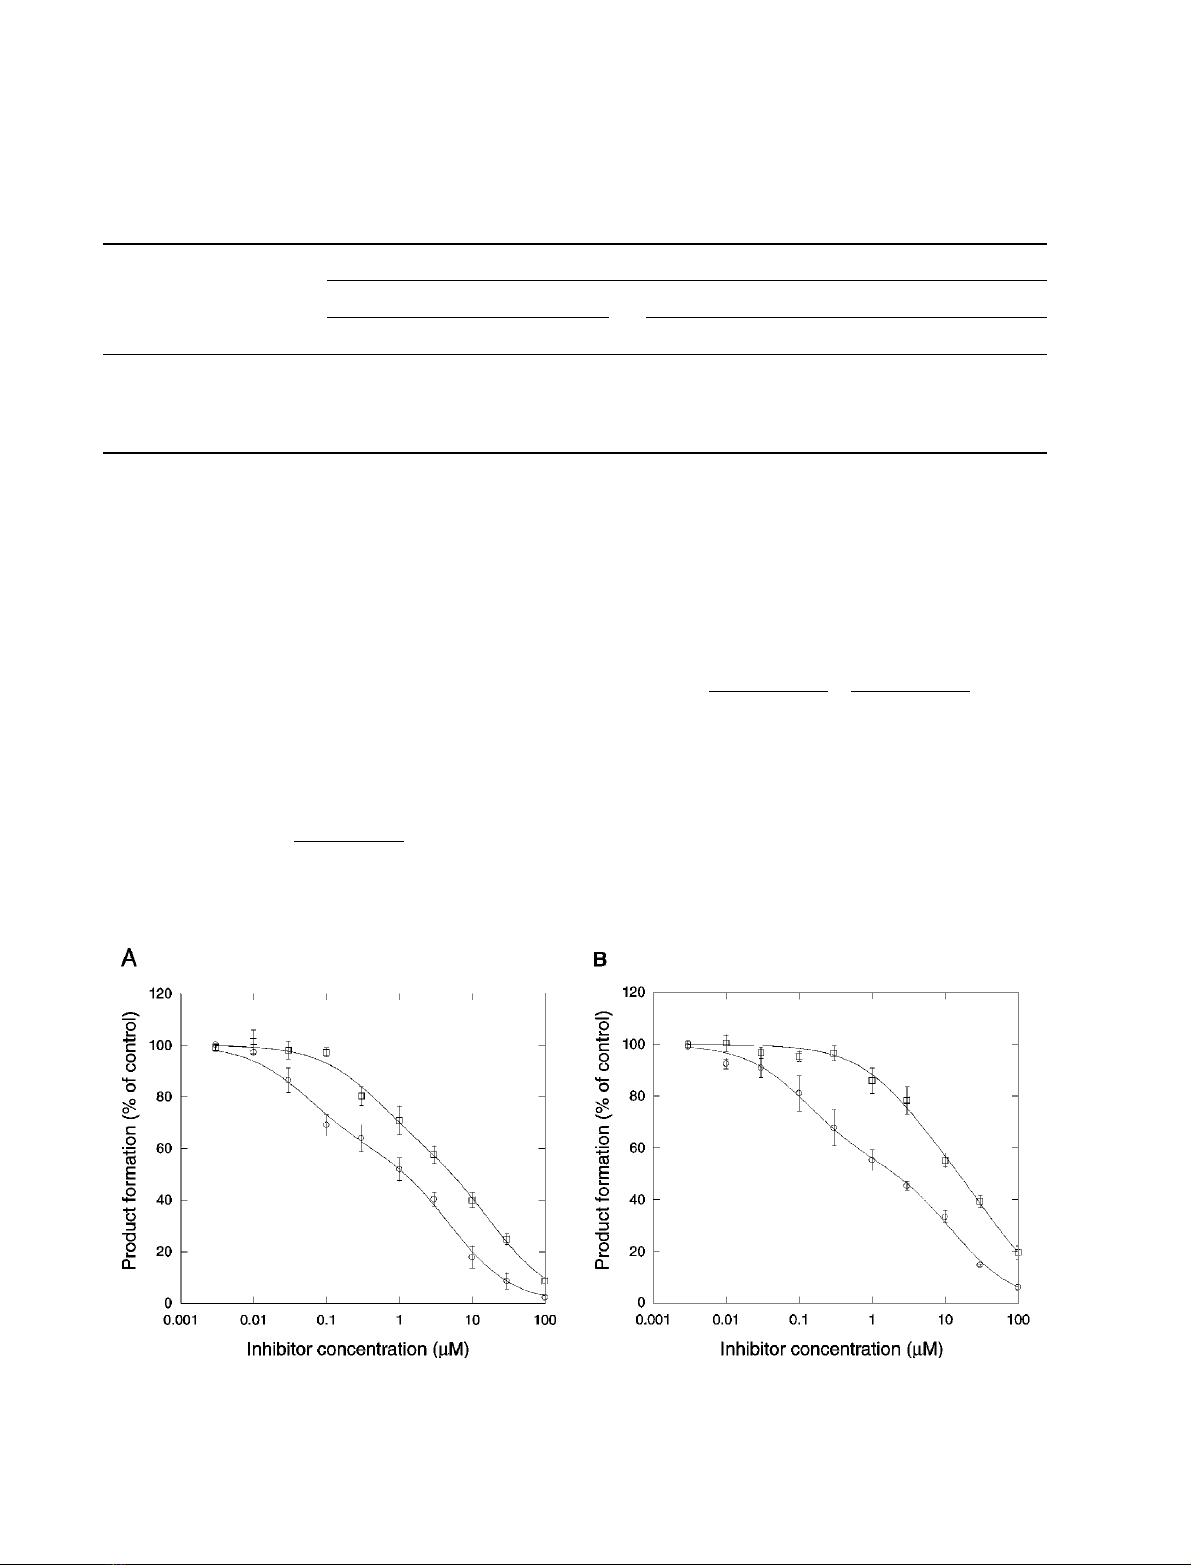
Effect of quinine and quinidine on dextromethorphan
O-demethylation
A characteristic feature of rat CYP2D enzymes is that, in
contrast with the human enzyme, they are inhibited by
quinine more potently than by quinidine [17,31,37]. As
shown in Fig. 4A, quinine was a more potent inhibitor than
quinidine of [O-methyl-
14
C]dextromethorphan O-demethy-
lation in rat hepatocytes. Inhibition curves were fitted to a
four-parameter logistic model:
Y¼1
1þðx=IC50Þnð3Þ
where Yis the fraction of enzyme activity relative to
no-inhibitor controls, Xis the concentration of inhi-
bitor, IC
50
the concentration for half-maximal inhibi-
tion, and nthe slope factor. The results of the fitting are
summarized in Table 1. Quinine and quinidine had IC
50
values of 0.9 and 4.7 l
M
, respectively. The slope factors
were 0.57 and 0.64, respectively, suggesting interaction
with more than one enzyme or binding site.
Inhibition curves were also fitted to a two-site inhibition
model (Fig. 4):
Y¼A
1þðx=IC501Þþ1A
1þðx=IC502Þð4Þ
where Yis the fraction of enzyme activity relative to
no-inhibitor controls, Ais the fraction of enzymes with
IC
50-1
, and 1 )Athe fraction of enzymes with IC
50-2
.As
shown in Table 1, correlation coefficients (r) for the
nonlinear regression curve fits using the two-enzyme
model were slightly higher than those for the logistic fits.
Approximately 40% of the enzymatic activity in rat
hepatocytes was inhibited by quinine and quinidine with
high affinity (IC
50-1
0.06 and 0.51 l
M
, respectively), and
Fig. 4. Effect of quinine and quinidine on [O-methyl-
14
C]dextromethorphan demethylase activity. (A) Rat hepatocytes; (B) rat liver microsomes.
Enzymatic activity was determined in the presence of quinine (circles) or quinidine (squares), and results were expressed as percentage of control
activity in the absence of inhibitor. Data represent mean ± SEM from three to five separate experiments. Curves were fitted to a two-site inhibition
model as described in Results.
Table 1. Kinetic parameters for inhibition of [O-methyl-
14
C]dextromethorphan demethylation by quinine and quinidine in rat liver microsomes and rat
hepatocytes. Inhibition data (Fig. 4) were fitted to a four-parameter logistic model or a two-site inhibition model as described in the text. n,slope
factor; A, fraction of high-affinity sites; IC
50
, concentration that produces 50% inhibition; IC
50-1
,IC
50
for high-affinity sites; IC
50-2
,IC
50
for low-
affinity sites; r, correlation coefficient of the nonlinear regression curve fit. Results are parameter values (± SEM), as calculated by the curve-fitting
software.
Inhibitor
Enzyme
source
Fit type
4-parameter logistic 2 enzymes
rIC
50
nrAIC
50-1
IC
50-2
Quinine Hepatocytes 0.9912 0.9 ± 0.16 0.57 ± 0.05 0.9981 0.40 ± 0.04 0.06 ± 0.02 5.0 ± 1.0
Quinidine Hepatocytes 0.9956 4.7 ± 0.51 0.64 ± 0.04 0.9980 0.41 ± 0.07 0.51 ± 0.18 19.0 ± 4.7
Quinine Microsomes 0.9954 1.7 ± 0.21 0.53 ± 0.03 0.9986 0.45 ± 0.03 0.13 ± 0.03 12.6 ± 2.1
Quinidine Microsomes 0.9980 15.0 ± 0.9 0.72 ± 0.03 0.9976 0.45 ± 0.14 3.3 ± 1.5 48.9 ± 20.4
3772 A. Di Marco et al.(Eur. J. Biochem. 270)FEBS 2003


%20--%3e%3cdefs%3e%3cstyle%3e%20.st0%20{%20fill:%20%23fff;%20}%20.st1%20{%20fill:%20%237800fa;%20}%20%3c/style%3e%3c/defs%3e%3cpath%20class='st1'%20d='M117.78,12.18H43.11c2.9,3.47,4.65,7.94,4.65,12.82,0,5.6-2.3,10.66-6.01,14.29h76.02l7.22-13.56-7.22-13.56Z'/%3e%3cg%3e%3cpath%20class='st0'%20d='M53.58,26.17h-.59v-1.46h.59v-4.96h2.83c1.78,0,2.67.94,2.67,2.82v5.76c0,1.87-.89,2.81-2.67,2.81h-2.83v-4.96ZM55.36,21.37v3.34h1.1v1.46h-1.1v3.34h1.01c.61,0,.91-.37.91-1.1v-5.93c0-.74-.3-1.1-.91-1.1h-1.01Z'/%3e%3cpath%20class='st0'%20d='M65.99,31.14h-1.8l-.31-2.07h-2.19l-.31,2.07h-1.64l1.82-11.39h2.62l1.82,11.39ZM65.28,18.04c-.25.46-.51.77-.75.94-.21.15-.47.22-.79.22-.26,0-.57-.07-.92-.22l-.38-.15c-.14-.05-.26-.07-.37-.07-.3,0-.53.18-.71.54l-.91-.68c.25-.46.51-.77.75-.94.21-.14.48-.21.79-.21.26,0,.57.07.92.21l.38.15c.14.05.26.07.37.07.3,0,.53-.18.71-.54l.91.68ZM61.91,27.52h1.73l-.87-5.76-.87,5.76Z'/%3e%3cpath%20class='st0'%20d='M74.53,26.89v1.52c0,1.91-.89,2.86-2.67,2.86s-2.67-.95-2.67-2.86v-5.93c0-1.91.89-2.86,2.67-2.86s2.67.95,2.67,2.86v1.11h-1.69v-1.22c0-.75-.31-1.12-.93-1.12s-.93.37-.93,1.12v6.15c0,.74.31,1.11.93,1.11s.93-.37.93-1.11v-1.63h1.69Z'/%3e%3cpath%20class='st0'%20d='M81.4,31.14h-1.8l-.31-2.07h-2.19l-.31,2.07h-1.64l1.82-11.39h2.62l1.82,11.39ZM75.9,19.2l1.52-1.91h1.71l1.51,1.91h-1.61l-.76-.95-.75.95h-1.61ZM77.32,27.52h1.73l-.87-5.76-.87,5.76ZM83.1,15.99l-1.76,1.91h-1.26l1.17-1.91h1.86Z'/%3e%3cpath%20class='st0'%20d='M84.86,19.75c1.78,0,2.67.94,2.67,2.82v1.48c0,1.87-.89,2.81-2.67,2.81h-.85v4.28h-1.79v-11.39h2.64ZM84.01,21.37v3.86h.85c.58,0,.87-.36.87-1.08v-1.71c0-.71-.29-1.07-.87-1.07h-.85Z'/%3e%3cpath%20class='st0'%20d='M93.51,19.75c1.78,0,2.67.94,2.67,2.82v1.48c0,1.87-.89,2.81-2.67,2.81h-.85v4.28h-1.79v-11.39h2.64ZM92.66,21.37v3.86h.85c.58,0,.87-.36.87-1.08v-1.71c0-.71-.29-1.07-.87-1.07h-.85Z'/%3e%3cpath%20class='st0'%20d='M98.8,31.14h-1.79v-11.39h1.79v4.88h2.03v-4.88h1.83v11.39h-1.83v-4.88h-2.03v4.88Z'/%3e%3cpath%20class='st0'%20d='M105.36,24.55h2.46v1.62h-2.46v3.34h3.09v1.63h-4.88v-11.39h4.88v1.63h-3.09v3.18ZM108.17,17.29l-1.76,1.91h-1.26l1.17-1.91h1.86Z'/%3e%3cpath%20class='st0'%20d='M112.2,19.75c1.78,0,2.67.94,2.67,2.82v1.48c0,1.87-.89,2.81-2.67,2.81h-.85v4.28h-1.79v-11.39h2.64ZM111.35,21.37v3.86h.85c.58,0,.87-.36.87-1.08v-1.71c0-.71-.29-1.07-.87-1.07h-.85Z'/%3e%3c/g%3e%3ccircle%20class='st1'%20cx='25'%20cy='25'%20r='20'/%3e%3cpath%20class='st0'%20d='M32.78,19.27c2.92,0,4.43,2.55,5.28,5.33l.71,2.17c.14.38-.33.75-.71.75h-5.61c.19-.33.24-.71.09-1.08l-.75-2.45c-.43-1.32-.99-2.64-1.79-3.77.75-.57,1.65-.94,2.78-.94h0ZM25,18.38c3.25,0,4.9,2.78,5.89,5.89l.76,2.45c.14.42-.33.8-.8.8h-11.69c-.42,0-.94-.38-.8-.8l.75-2.45c.99-3.11,2.64-5.89,5.89-5.89h0ZM25,11.35c1.74,0,3.11,1.37,3.11,3.11s-1.37,3.11-3.11,3.11-3.11-1.41-3.11-3.11,1.41-3.11,3.11-3.11h0ZM17.27,19.27c1.08,0,1.98.38,2.73.94-.8,1.13-1.37,2.45-1.74,3.77l-.8,2.45c-.14.38-.05.75.09,1.08h-5.56c-.42,0-.9-.38-.75-.75l.71-2.17c.9-2.78,2.41-5.33,5.33-5.33h0ZM17.27,12.91c1.51,0,2.78,1.27,2.78,2.83s-1.27,2.83-2.78,2.83-2.83-1.27-2.83-2.83,1.27-2.83,2.83-2.83h0ZM32.78,12.91c1.56,0,2.78,1.27,2.78,2.83s-1.23,2.83-2.78,2.83-2.83-1.27-2.83-2.83,1.27-2.83,2.83-2.83h0ZM27.07,28.56v.09c0,.57-.24,1.08-.61,1.46h0v.05c-.38.33-.9.57-1.46.57s-1.08-.24-1.46-.61h0c-.38-.38-.61-.9-.61-1.46v-.09h1.41v.09c0,.19.05.38.19.47v.05c.09.09.28.19.47.19s.38-.09.47-.19v-.05c.14-.09.24-.28.24-.47t-.05-.09h1.41ZM30.99,28.56v.09c0,1.65-.66,3.16-1.74,4.24-1.08,1.08-2.59,1.79-4.24,1.79s-3.16-.71-4.24-1.79l-.05-.05c-1.04-1.08-1.7-2.55-1.7-4.2v-.09h1.41v.09c0,1.27.47,2.4,1.27,3.25h.05c.85.85,1.98,1.37,3.25,1.37s2.4-.52,3.25-1.37c.85-.8,1.37-1.98,1.37-3.25v-.09h1.37ZM34.99,28.56v.09c0,2.78-1.13,5.28-2.92,7.07-1.79,1.79-4.29,2.92-7.07,2.92s-5.23-1.13-7.07-2.92c-1.79-1.79-2.92-4.29-2.92-7.07v-.09h1.41v.09c0,2.4.94,4.53,2.5,6.08,1.56,1.56,3.72,2.5,6.08,2.5s4.52-.94,6.08-2.5c1.56-1.56,2.5-3.68,2.5-6.08v-.09h1.41Z'/%3e%3c/svg%3e)