
BioMed Central
Page 1 of 13
(page number not for citation purposes)
Virology Journal
Open Access
Research
Evolution of the M gene of the influenza A virus in different host
species: large-scale sequence analysis
Yuki Furuse, Akira Suzuki, Taro Kamigaki and Hitoshi Oshitani*
Address: Department of Virology, Tohoku University Graduate School of Medicine, 2-1 Seiryou-machi Aoba-ku, Sendai, Japan
Email: Yuki Furuse - furusey@mail.tains.tohoku.ac.jp; Akira Suzuki - suzukia@mail.tains.tohoku.ac.jp;
Taro Kamigaki - kamigakit@mail.tains.tohoku.ac.jp; Hitoshi Oshitani* - oshitanih@mail.tains.tohoku.ac.jp
* Corresponding author
Abstract
Background: Influenza A virus infects not only humans, but also other species including avian and
swine. If a novel influenza A subtype acquires the ability to spread between humans efficiently, it
could cause the next pandemic. Therefore it is necessary to understand the evolutionary processes
of influenza A viruses in various hosts in order to gain better knowledge about the emergence of
pandemic virus. The virus has segmented RNA genome and 7th segment, M gene, encodes 2
proteins. M1 is a matrix protein and M2 is a membrane protein. The M gene may be involved in
determining host tropism. Besides, novel vaccines targeting M1 or M2 protein to confer cross
subtype protection have been under development. We conducted the present study to investigate
the evolution of the M gene by analyzing its sequence in different species.
Results: Phylogenetic tree revealed host-specific lineages and evolution rates were different
among species. Selective pressure on M2 was stronger than that on M1. Selective pressure on M1
for human influenza was stronger than that for avian influenza, as well as M2. Site-by-site analyses
identified one site (amino acid position 219) in M1 as positively selected in human. Positions 115
and 121 in M1, at which consensus amino acids were different between human and avian, were
under negative selection in both hosts. As to M2, 10 sites were under positive selection in human.
Seven sites locate in extracellular domain. That might be due to host's immune pressure. One site
(position 27) positively selected in transmembrane domain is known to be associated with drug
resistance. And, two sites (positions 57 and 89) locate in cytoplasmic domain. The sites are involved
in several functions.
Conclusion: The M gene of influenza A virus has evolved independently, under different selective
pressure on M1 and M2 among different hosts. We found potentially important sites that may be
related to host tropism and immune responses. These sites may be important for evolutional
process in different hosts and host adaptation.
Background
The influenza virus is a common cause of respiratory
infection all over the world. The influenza A virus can
infect not only humans but also avian, swine, and equine
species. The virus has a negative single-stranded RNA with
eight gene segments, namely PB2, PB1, PA, HA, NP, NA,
M, and NS. The subtype of influenza A virus is determined
by the antigenicity of two surface glycoproteins, hemaglu-
Published: 29 May 2009
Virology Journal 2009, 6:67 doi:10.1186/1743-422X-6-67
Received: 15 April 2009
Accepted: 29 May 2009
This article is available from: http://www.virologyj.com/content/6/1/67
© 2009 Furuse et al; licensee BioMed Central Ltd.
This is an Open Access article distributed under the terms of the Creative Commons Attribution License (http://creativecommons.org/licenses/by/2.0),
which permits unrestricted use, distribution, and reproduction in any medium, provided the original work is properly cited.

Virology Journal 2009, 6:67 http://www.virologyj.com/content/6/1/67
Page 2 of 13
(page number not for citation purposes)
tinin (HA) and neuraminidase (NA). The subtypes cur-
rently circulating in the human population are H1N1 and
H3N2. Influenza A viruses cause epidemics and pandem-
ics by antigenic drift and antigenic shift, respectively [1].
Antigenic drift is an accumulation of point mutations
leading minor and gradual antigenic changes. Antigenic
shift involves major antigenic changes by introduction of
new HA and/or NA subtype into human population.
All known HA and NA subtypes are maintained in avian
species, and all mammalian influenza A viruses are
thought to be derived from the avian influenza A virus
pool [1]. In avian species, influenza A viruses are in an
evolutionary stasis [1]. In contrast, all gene segments of
mammalian viruses continue to accumulate amino acid
substitutions [1]. Today, the emergence of an influenza
pandemic is of great global concern. If a novel influenza A
subtype acquires the ability to spread between humans
efficiently, it could cause the next pandemic [1]. This abil-
ity is acquired by reassortment between human and non-
human influenza A viruses or by the accumulation of
mutations in the non-human influenza virus. It is neces-
sary to understand the evolutionary processes of influenza
A viruses in various hosts so that we have better knowl-
edge about the emergence of this pandemic virus. We con-
ducted the present study to investigate the evolution of
the M gene among different species. Although there are
numerous studies on the evolution of the HA gene [2-7],
only a few studies on the evolution of the M gene have
been conducted [8].
The M gene is intriguing because it encodes both matrix
and membrane proteins, and has multiple functions. The
M gene (1027 bps) encodes two proteins, namely M1 (at
nucleotide position 26 to 784) and M2 (at nucleotide
position 26 to 51 and 740 to 1007) [9]. M1 is a matrix
protein that lies just beneath the viral envelope in the
form of dimers and interacts with viral ribonucleoprotein
(vRNP) complex, forming a bridge between the inner core
components and the membrane proteins [10-13]. vRNPs
harbor the determinants for host range [1,14,15]. M1 con-
tacts with both viral RNA and NP, promoting the forma-
tion of RNP complexes and causing the dissociation of
RNP from the nuclear matrix [16-21]. M1 plays a vital role
in assembly by recruiting the viral components to the site
of assembly and essential role in the budding process
including formation of viral particles [22,23]. M2 is a
membrane protein which is inserted into the viral enve-
lope and projects from the surface of the virus as tetramers
[24,25]. The M2 protein comprises 97 amino acids – 24 in
the extracellular domain, 19 in the transmembrane
domain, and 54 in the cytoplasmic domain. Extracellular
domain of M2 is recognized by hosts' immune system
[26-28]. Transmembrane domain of M2 has ion channel
activity, which involved in uncoating process of the virus
in cell [29]. Amantadine inhibits virus replication by
blocking the acid-activated ion channel. The cytoplasmic
domain of M2 interacts with M1 and is required for
genome packaging and formation of virus particles [30-
36].
The molecular mechanism of how the host range of influ-
enza A viruses is determined is still not fully understood.
The M gene may be involved in determining host tropism.
Besides, novel vaccines targeting M1 or M2 proteins to
confer cross-subtype protection have been shown to be
promising [37-43]. Therefore, understanding of evolution
of the M gene is of great importance and practical rele-
vance.
Results
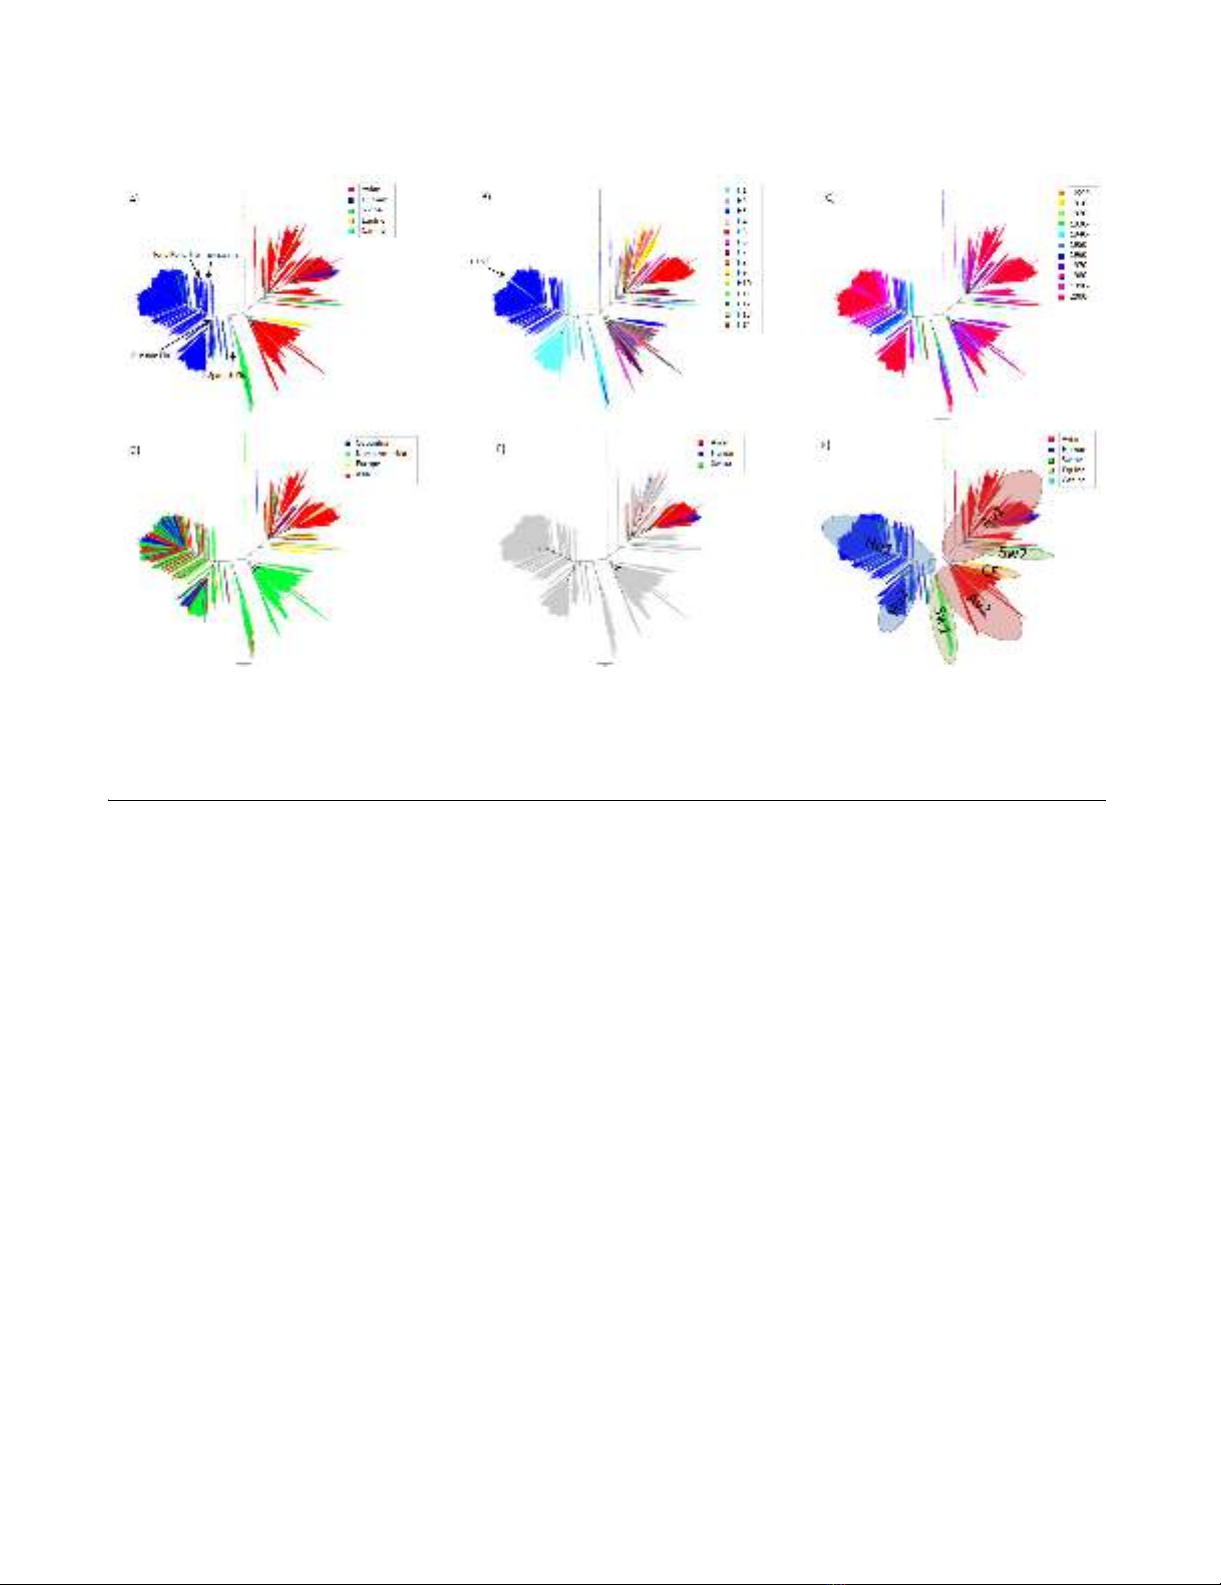
Phylogenetic Tree
The phylogenetic trees for the M gene of all the sequence
data we analyzed are shown in Figure 1. We defined "lin-
eage" as an aggregate of large branches. The phylogenetic
analysis revealed seven host-specific lineages: 1) human
lineage (Hu1) consisting of H1N1 between 1918 and
1954 (Spanish Flu and its progeny viruses), H2N2
between 1957 and 1967 (Asian Flu and its progeny
viruses), and H3N2 (Hong Kong Flu and its progeny
viruses) after 1968; 2) another human lineage (Hu2) con-
sisting of H1N1 (Russian Flu) after 1977; 3) avian lineage
(Av1) including viruses mainly from Asia but also from
other regions; 4) another avian lineage (Av 2) including
viruses mostly from North America; 5) swine lineage
(Sw1), located between human and avian lineages,
mainly from North America; 6) another swine lineage
(Sw2) diverging from Av1 and consisting of swine viruses
after 1980, mainly from Europe; and 7) canine/equine
lineage (CE) diverging from the root of Av2.
The M gene of all known human influenza A viruses, i.e.,
H1N1 between 1918 and 1957, H2N2 between 1957 and
1968, H3N2 after 1968, and H1N1 after 1977 was derived
from that of the 1918 Spanish Flu. One lineage (Hu1)
included three different subtypes (H1N1 between 1918
and 1957, H2N2 between 1957 and 1968, and H3N2
after 1968), which means that the same M gene was main-
tained in human influenza even after two antigenic shifts
in 1957 and 1968. Another lineage (Hu2) included H1N1
after 1977. This M gene was also derived from Spanish
Flu, but underwent different evolutionary processes and
formed another lineage. Since H1N1 re-emerged in 1977
as Russian Flu, the two subtypes (H1N1 and H3N2) have
been co-circulating in human populations and have
formed two distinct lineages (Hu1 and Hu2). However,
Hu2 exclusively includes H1N1 viruses and all human
H3N2 are included in Hu1 (Figure 1B). On the other
hand, both avian influenza lineages (Av1 and Av2) did
not show any subtype specificity, and included many dif-
Virology Journal 2009, 6:67 http://www.virologyj.com/content/6/1/67
Page 3 of 13
(page number not for citation purposes)
ferent subtypes (Figure 1A and 1B). In avian lineages, even
small branches of the phylogenetic tree are shared by dif-
ferent subtypes.
Although strains with the M gene in both avian lineages
(Av1 and Av2) have been seen sporadically in humans,
they have not been maintained in the population (blue
characters in Av1 and Av2, Figure 1A and 1F). Strains with
the M gene in swine lineages also infect humans, but these
swine viruses have not been established in human popu-
lations (blue characters in Sw1 and Sw2, Figure 1A and
1F). All H5N1 viruses that infected humans as well as the
H5N1 virus that infected swine possessed share the M
gene of the avian influenza lineage (Av1, (Figure 1E).
Evolutionary Rate
For evolutionary rate analysis, we included the sequences
of only host-specific lineages and excluded other
sequences such as those of the H5N1 influenza in humans
(Figure 1F. See "Materials and methods"). The profile of
the sequences analyzed is shown in Table 1. Evolutionary
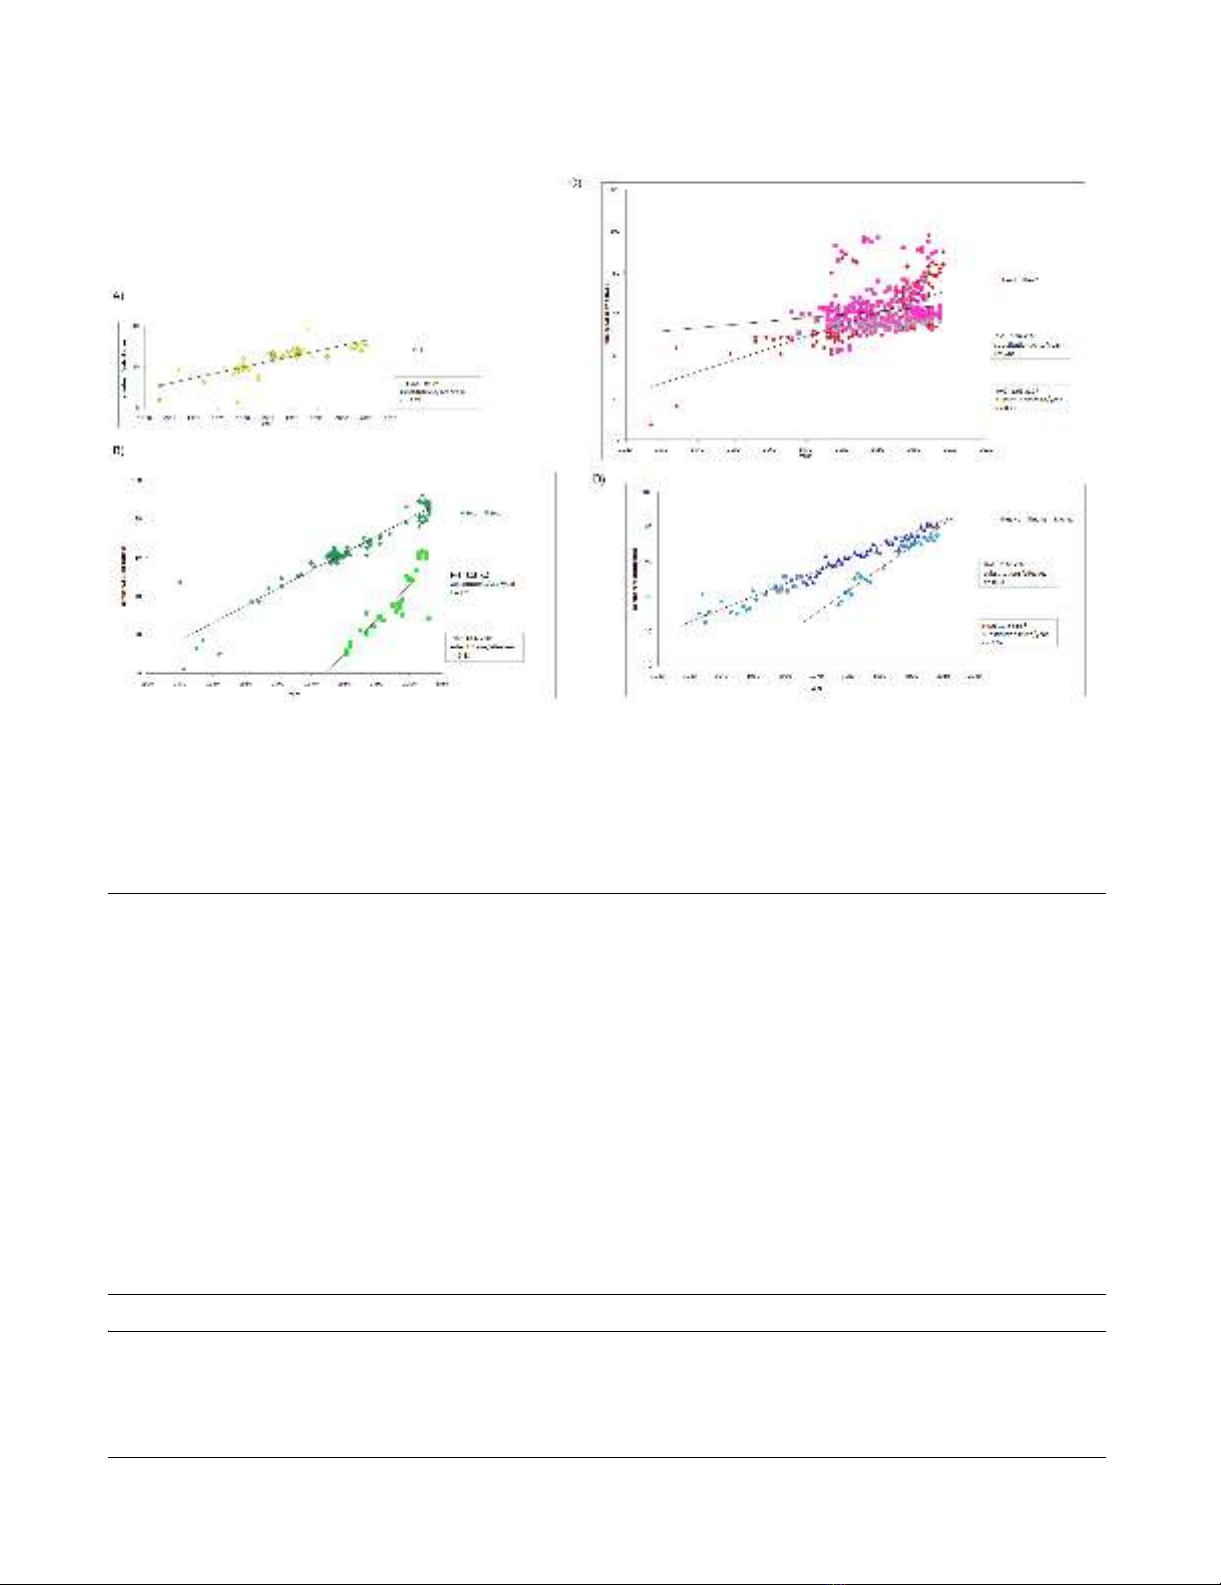
rates were estimated for each lineage (Figure 2).
Av2 of avian influenza A viruses showed the slowest evo-
lutionary rate (1.63 × 10⁻⁴ substitutions per site per year).
All human and swine Influenza A viruses had a signifi-
cantly faster evolutionary rate than avian viruses (Table
2). In addition, evolutionary rates were significantly dif-
ferent even between lineages of same host. Hu2 has
evolved more rapidly than Hu1, and Sw2 has evolved
more rapidly than Sw1 (Figure 2 and Table 2).
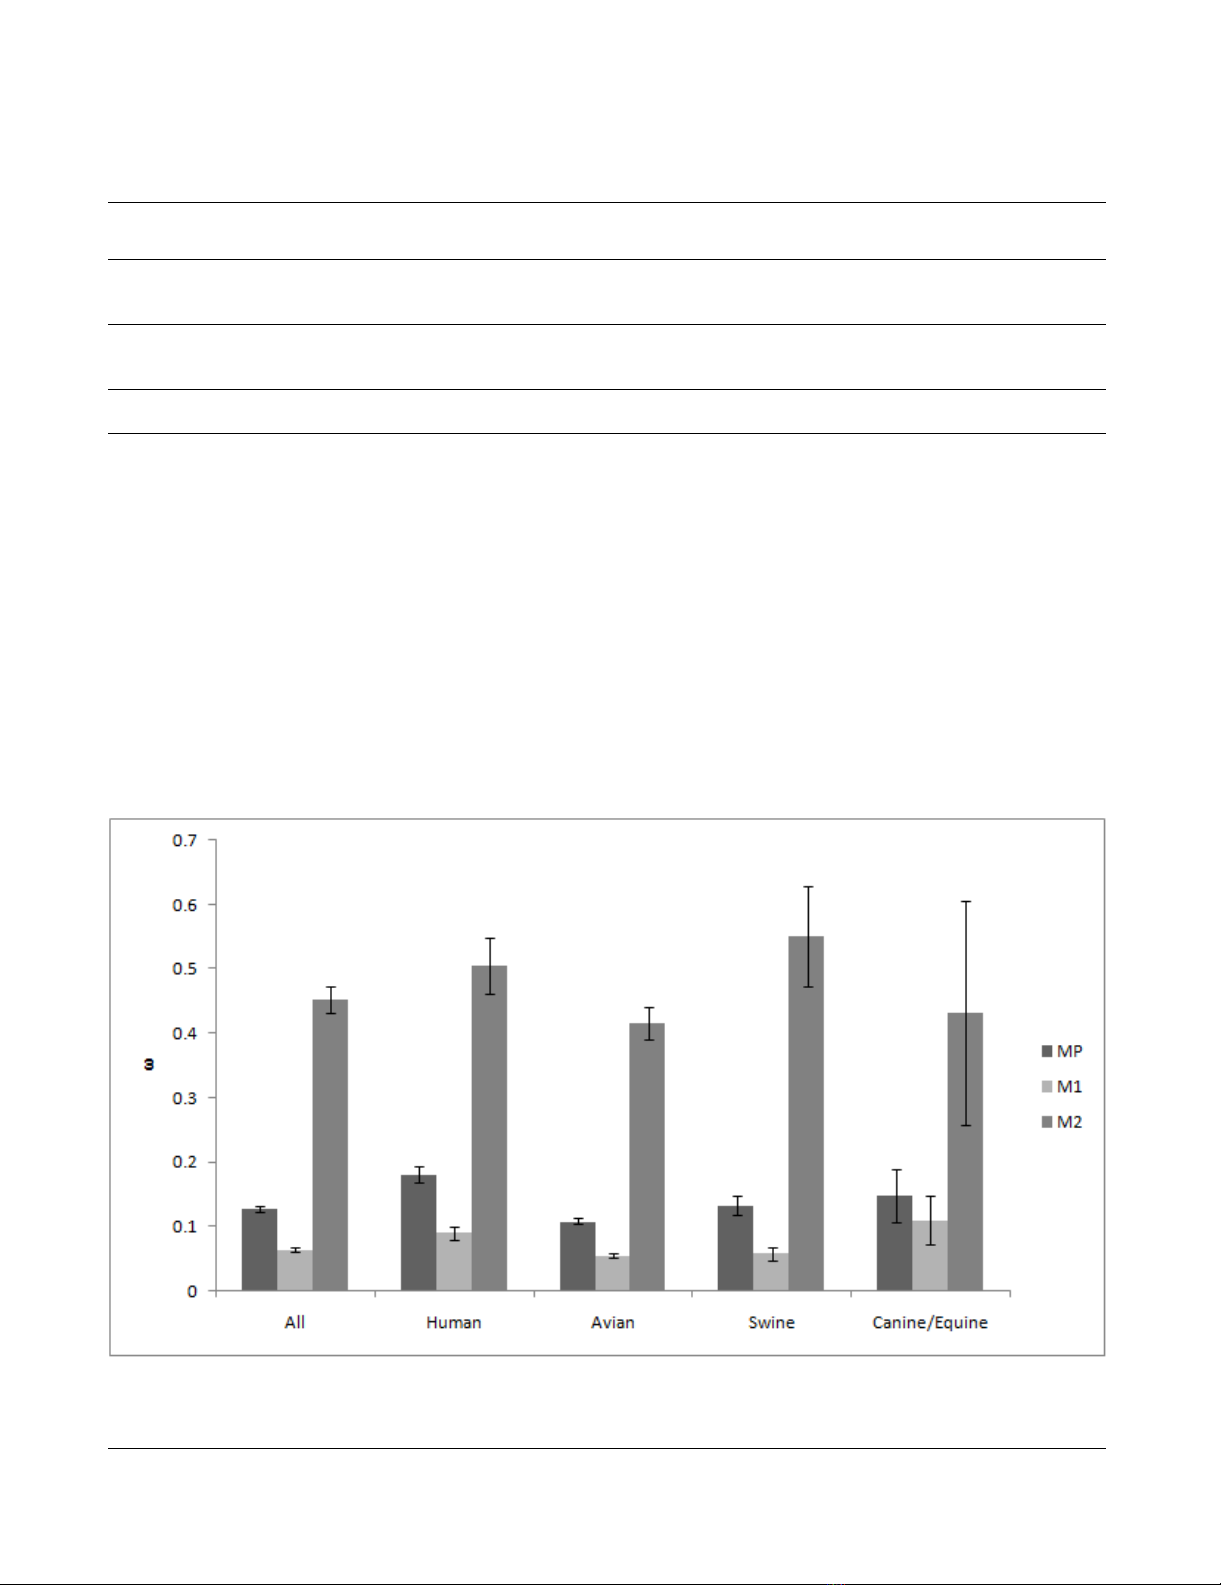
Selective Pressures
The selective pressures for the entire sequence (we defined
the magnitude of the pressure as "ω") were 0.13 for the
entire coding region of the M gene, 0.06 for M1, and 0.45
for M2 (Figure 3). A higher selective pressure indicates
that the gene (or the site) is under stronger selection (pos-
itive selection) for amino acid substitution. Lower selec-
tive pressure indicates that the gene (or the site) is under
stronger negative selection to retain the same amino
acid(s) because changes may lead to incompetence or
abortion [44,45]. Selective pressure was statistically
stronger in M2 than that in M1 for all hosts.
ω of the entire coding region of the M gene for human and
swine influenza was significantly higher (no overlap of
95% confidence intervals) than that for the avian influ-
enza (Figure 3). ω for both M1 and M2 of human influ-
enza are also significantly larger than that for avian
influenza (Figure 3).
Phylogenetic trees for the M geneFigure 1
Phylogenetic trees for the M gene. Figures shows phylogenetic trees constructed using RAxML. Scale bar shows evolu-
tionary distance inferred by RAxML algorithm. Trees are shaded in colors according to host (A), subtype (B), year (C), geo-
graphical location (D), and H5N1 (E). To compare evolutionary characteristics such as evolution rate and selective pressure,
we named each lineage as shown in (F).
Virology Journal 2009, 6:67 http://www.virologyj.com/content/6/1/67
Page 4 of 13
(page number not for citation purposes)
Site-by-site Analyses
Site-by-site (by each codon) analyses for human influenza
were conducted by SLAC (the entire tree [eSLAC], internal
branches [iSLAC], and terminal branches [tSLAC]), and
FEL (the entire tree [eFEL] and internal branches [iFEL])
methods [45]. We conducted the analyses by testing
hypotheses for the entire tree, internal branches, and ter-
minal branches (See "Materials and methods").
"dN/dS" indicates the magnitude of selective pressure on
each codon. When dN/dS on a certain codon is signifi-
cantly greater than 1, the site is considered to be under sig-
nificant positive selection. When dN/dS on a certain
codon is significantly smaller than 1, the site is considered
to be under significant negative selection. Figure 4 shows
P-values calculated by eSLAC and eFEL for each codon,
indicating negative or positive selection. eSLAC and eFEL
gave similar results. The sites under significant negative
selection for human influenza were found in 159 out of
252 codons (63.1%) in M1 and 26 out of 97 (26.8%) in
M2. Only one codon (0.4%) in M1 and eight codons
(8.2%) in M2 were under significant positive selection by
eFEL for human influenza. The sites under positive selec-
tion identified by at least one test are listed in Table 3. The
site in M1 under significant positive selection was posi-
tion 219 (from here, "position" indicates the amino acid
Evolutionary rateFigure 2
Evolutionary rate. Number of nucleotide substitutions compared to the oldest strain in each lineage is plotted. Evolutionary
rates are calculated from the slope of the tangent of a simple regression line (number of substitutions/site/year), for canine/
equine (A), swine (B), avian (C), and human (D). Correlation coefficient (r) was estimated using the Pearson correlation. Refer-
ence strains are A/chicken/Brescia/1902(H7N7) for Av1, A/turkey/Massachusetts/3740/1965(H6N2) for Av2, A/equine/Miami/
1/1963(H3N8) for CE, A/Brevig Mission/1/1918(H1N1) for Hu1 and Hu2, A/swine/Iowa/15/1930(H1N1) for Sw1, and A/swine/
Netherlands/25/80(H1N1) for Sw2. Mean and 95% confidence interval (shown in parentheses) are calculated by SPSS.
Table 1: Profile of sequences analyzed for selective pressure
Host Total number Number after excluding identical sequences Year Mean diversity
All hosts 5060 3011 1902 – 2008 0.100
Human 2763 1217 1918 – 2008 0.050
Avian 2009 1492 1902 – 2008 0.077
Swine 201 123 1930 – 2006 0.069
Canine/Equine 87 53 1963 – 2005 0.015
Virology Journal 2009, 6:67 http://www.virologyj.com/content/6/1/67
Page 5 of 13
(page number not for citation purposes)
position, i.e., the codon). Figure 5 shows that this site is
located at the edge of the structure and is a part of a T-cell
and MHC cell epitope. Of ten sites positively selected in
M2, seven sites are in the extracellular domain (positions
11, 12, 13, 14, 16, 21, and 23), one site is in the trans-
membrane domain (position 27), and two sites in the
cytoplasmic domain (positions 57 and 89, Table 3).
To define the evolutionary difference for each codon in
human and avian influenza, we also calculated site-by-site
selective pressures for avian influenza by eFEL. Consensus
sequences of human and avian viruses were compared to
identify major differences between these two hosts. We
identified the sites at which consensus amino acids were
different between the human and avian viruses and
showed selective pressures (Figure 6 and Table 4). A sum-
mary of the site-by-site analyses including positive and
negative selection for human and avian influenza, and
differences in the consensus sequences are shown in Fig-
ure 7. Position 219 in M1, which is under significant pos-
itive selection in the human virus, is under significant
negative selection in the avian virus. Positions 115 and
Table 2: Comparison of evolutionary rates among different hosts
Av1 Av2 awithin each host
Evolutionary rate (number of substitutions/site/year) 5.76 × 10⁻⁴ 1.63 × 10⁻⁴
Hu1 7.34 × 10⁻⁴ 0.020 < 0.001
Hu2 12.8 × 10⁻⁴ < 0.001 < 0.001 < 0.001
Sw1 9.23 × 10⁻⁴ < 0.001 < 0.001
Sw2 18.4 × 10⁻⁴ < 0.001 < 0.001 < 0.001
CE 5.40 × 10⁻⁴ 0.795 0.007
List of P-values for differential evolutionary rates.
aP-values for lineages of same host: Hu1 vs. Hu2 and Sw1 vs. Sw2.
Bold values are those deemed to show significantly positive selection (P < 0.05).
Selective pressure among hostsFigure 3
Selective pressure among hosts. Selective pressures for the entire sequence (ω) are calculated for the entire coding region
of the M gene, and separately for M1 and M2. Error bar shows 95% confidence interval.


![PET/CT trong ung thư phổi: Báo cáo [Năm]](https://cdn.tailieu.vn/images/document/thumbnail/2024/20240705/sanhobien01/135x160/8121720150427.jpg)


%20--%3e%3cdefs%3e%3cstyle%3e%20.st0%20{%20fill:%20%23fff;%20}%20.st1%20{%20fill:%20%237800fa;%20}%20%3c/style%3e%3c/defs%3e%3cpath%20class='st1'%20d='M117.78,12.18H43.11c2.9,3.47,4.65,7.94,4.65,12.82,0,5.6-2.3,10.66-6.01,14.29h76.02l7.22-13.56-7.22-13.56Z'/%3e%3cg%3e%3cpath%20class='st0'%20d='M53.58,26.17h-.59v-1.46h.59v-4.96h2.83c1.78,0,2.67.94,2.67,2.82v5.76c0,1.87-.89,2.81-2.67,2.81h-2.83v-4.96ZM55.36,21.37v3.34h1.1v1.46h-1.1v3.34h1.01c.61,0,.91-.37.91-1.1v-5.93c0-.74-.3-1.1-.91-1.1h-1.01Z'/%3e%3cpath%20class='st0'%20d='M65.99,31.14h-1.8l-.31-2.07h-2.19l-.31,2.07h-1.64l1.82-11.39h2.62l1.82,11.39ZM65.28,18.04c-.25.46-.51.77-.75.94-.21.15-.47.22-.79.22-.26,0-.57-.07-.92-.22l-.38-.15c-.14-.05-.26-.07-.37-.07-.3,0-.53.18-.71.54l-.91-.68c.25-.46.51-.77.75-.94.21-.14.48-.21.79-.21.26,0,.57.07.92.21l.38.15c.14.05.26.07.37.07.3,0,.53-.18.71-.54l.91.68ZM61.91,27.52h1.73l-.87-5.76-.87,5.76Z'/%3e%3cpath%20class='st0'%20d='M74.53,26.89v1.52c0,1.91-.89,2.86-2.67,2.86s-2.67-.95-2.67-2.86v-5.93c0-1.91.89-2.86,2.67-2.86s2.67.95,2.67,2.86v1.11h-1.69v-1.22c0-.75-.31-1.12-.93-1.12s-.93.37-.93,1.12v6.15c0,.74.31,1.11.93,1.11s.93-.37.93-1.11v-1.63h1.69Z'/%3e%3cpath%20class='st0'%20d='M81.4,31.14h-1.8l-.31-2.07h-2.19l-.31,2.07h-1.64l1.82-11.39h2.62l1.82,11.39ZM75.9,19.2l1.52-1.91h1.71l1.51,1.91h-1.61l-.76-.95-.75.95h-1.61ZM77.32,27.52h1.73l-.87-5.76-.87,5.76ZM83.1,15.99l-1.76,1.91h-1.26l1.17-1.91h1.86Z'/%3e%3cpath%20class='st0'%20d='M84.86,19.75c1.78,0,2.67.94,2.67,2.82v1.48c0,1.87-.89,2.81-2.67,2.81h-.85v4.28h-1.79v-11.39h2.64ZM84.01,21.37v3.86h.85c.58,0,.87-.36.87-1.08v-1.71c0-.71-.29-1.07-.87-1.07h-.85Z'/%3e%3cpath%20class='st0'%20d='M93.51,19.75c1.78,0,2.67.94,2.67,2.82v1.48c0,1.87-.89,2.81-2.67,2.81h-.85v4.28h-1.79v-11.39h2.64ZM92.66,21.37v3.86h.85c.58,0,.87-.36.87-1.08v-1.71c0-.71-.29-1.07-.87-1.07h-.85Z'/%3e%3cpath%20class='st0'%20d='M98.8,31.14h-1.79v-11.39h1.79v4.88h2.03v-4.88h1.83v11.39h-1.83v-4.88h-2.03v4.88Z'/%3e%3cpath%20class='st0'%20d='M105.36,24.55h2.46v1.62h-2.46v3.34h3.09v1.63h-4.88v-11.39h4.88v1.63h-3.09v3.18ZM108.17,17.29l-1.76,1.91h-1.26l1.17-1.91h1.86Z'/%3e%3cpath%20class='st0'%20d='M112.2,19.75c1.78,0,2.67.94,2.67,2.82v1.48c0,1.87-.89,2.81-2.67,2.81h-.85v4.28h-1.79v-11.39h2.64ZM111.35,21.37v3.86h.85c.58,0,.87-.36.87-1.08v-1.71c0-.71-.29-1.07-.87-1.07h-.85Z'/%3e%3c/g%3e%3ccircle%20class='st1'%20cx='25'%20cy='25'%20r='20'/%3e%3cpath%20class='st0'%20d='M32.78,19.27c2.92,0,4.43,2.55,5.28,5.33l.71,2.17c.14.38-.33.75-.71.75h-5.61c.19-.33.24-.71.09-1.08l-.75-2.45c-.43-1.32-.99-2.64-1.79-3.77.75-.57,1.65-.94,2.78-.94h0ZM25,18.38c3.25,0,4.9,2.78,5.89,5.89l.76,2.45c.14.42-.33.8-.8.8h-11.69c-.42,0-.94-.38-.8-.8l.75-2.45c.99-3.11,2.64-5.89,5.89-5.89h0ZM25,11.35c1.74,0,3.11,1.37,3.11,3.11s-1.37,3.11-3.11,3.11-3.11-1.41-3.11-3.11,1.41-3.11,3.11-3.11h0ZM17.27,19.27c1.08,0,1.98.38,2.73.94-.8,1.13-1.37,2.45-1.74,3.77l-.8,2.45c-.14.38-.05.75.09,1.08h-5.56c-.42,0-.9-.38-.75-.75l.71-2.17c.9-2.78,2.41-5.33,5.33-5.33h0ZM17.27,12.91c1.51,0,2.78,1.27,2.78,2.83s-1.27,2.83-2.78,2.83-2.83-1.27-2.83-2.83,1.27-2.83,2.83-2.83h0ZM32.78,12.91c1.56,0,2.78,1.27,2.78,2.83s-1.23,2.83-2.78,2.83-2.83-1.27-2.83-2.83,1.27-2.83,2.83-2.83h0ZM27.07,28.56v.09c0,.57-.24,1.08-.61,1.46h0v.05c-.38.33-.9.57-1.46.57s-1.08-.24-1.46-.61h0c-.38-.38-.61-.9-.61-1.46v-.09h1.41v.09c0,.19.05.38.19.47v.05c.09.09.28.19.47.19s.38-.09.47-.19v-.05c.14-.09.24-.28.24-.47t-.05-.09h1.41ZM30.99,28.56v.09c0,1.65-.66,3.16-1.74,4.24-1.08,1.08-2.59,1.79-4.24,1.79s-3.16-.71-4.24-1.79l-.05-.05c-1.04-1.08-1.7-2.55-1.7-4.2v-.09h1.41v.09c0,1.27.47,2.4,1.27,3.25h.05c.85.85,1.98,1.37,3.25,1.37s2.4-.52,3.25-1.37c.85-.8,1.37-1.98,1.37-3.25v-.09h1.37ZM34.99,28.56v.09c0,2.78-1.13,5.28-2.92,7.07-1.79,1.79-4.29,2.92-7.07,2.92s-5.23-1.13-7.07-2.92c-1.79-1.79-2.92-4.29-2.92-7.07v-.09h1.41v.09c0,2.4.94,4.53,2.5,6.08,1.56,1.56,3.72,2.5,6.08,2.5s4.52-.94,6.08-2.5c1.56-1.56,2.5-3.68,2.5-6.08v-.09h1.41Z'/%3e%3c/svg%3e)