
BioMed Central
Page 1 of 16
(page number not for citation purposes)
Retrovirology
Open Access
Research
Biphasic decay kinetics suggest progressive slowing in turnover of
latently HIV-1 infected cells during antiretroviral therapy
Marek Fischer*, Beda Joos, Barbara Niederöst, Philipp Kaiser, Roland Hafner,
Viktor von Wyl, Martina Ackermann, Rainer Weber and
Huldrych F Günthard*
Address: University Hospital Zürich, Division of Infectious Diseases, Rämistrasse 100, 8092 Zürich, Switzerland
Email: Marek Fischer* - marek.fischer@usz.ch; Beda Joos - beda.joos@usz.ch; Barbara Niederöst - barbara.niederoest@usz.ch;
Philipp Kaiser - philippkaiser@hotmail.com; Roland Hafner - roland.hafner@usz.ch; Viktor von Wyl - Viktor.vonWyl@usz.ch;
Martina Ackermann - martina.ackermann@gmx.ch; Rainer Weber - rainer.weber@usz.ch; Huldrych F Günthard* - huldrych.guenthard@usz.ch
* Corresponding authors
Abstract
Background: Mathematical models based on kinetics of HIV-1 plasma viremia after initiation of
combination antiretroviral therapy (cART) inferred HIV-infected cells to decay exponentially with
constant rates correlated to their strength of virus production. To further define in vivo decay
kinetics of HIV-1 infected cells experimentally, we assessed infected cell-classes of distinct viral
transcriptional activity in peripheral blood mononuclear cells (PBMC) of five patients during 1 year
after initiation of cART
Results: In a novel analytical approach patient-matched PCR for unspliced and multiply spliced viral
RNAs was combined with limiting dilution analysis at the single cell level. This revealed that HIV-
RNA+ PBMC can be stratified into four distinct viral transcriptional classes. Two overlapping cell-
classes of high viral transcriptional activity, suggestive of a virion producing phenotype, rapidly
declined to undetectable levels. Two cell classes expressing HIV-RNA at low and intermediate
levels, presumably insufficient for virus production and occurring at frequencies exceeding those of
productively infected cells matched definitions of HIV-latency. These cells persisted during cART.
Nevertheless, during the first four weeks of therapy their kinetics resembled that of productively
infected cells.
Conclusion: We have observed biphasic decays of latently HIV-infected cells of low and
intermediate viral transcriptional activity with marked decreases in cell numbers shortly after
initiation of therapy and complete persistence in later phases. A similar decay pattern was shared
by cells with greatly enhanced viral transcriptional activity which showed a certain grade of levelling
off before their disappearance. Thus it is conceivable that turnover/decay rates of HIV-infected
PBMC may be intrinsically variable. In particular they might be accelerated by HIV-induced
activation and reactivation of the viral life cycle and slowed down by the disappearance of such
feedback-loops after initiation of cART.
Published: 26 November 2008
Retrovirology 2008, 5:107 doi:10.1186/1742-4690-5-107
Received: 30 June 2008
Accepted: 26 November 2008
This article is available from: http://www.retrovirology.com/content/5/1/107
© 2008 Fischer et al; licensee BioMed Central Ltd.
This is an Open Access article distributed under the terms of the Creative Commons Attribution License (http://creativecommons.org/licenses/by/2.0),
which permits unrestricted use, distribution, and reproduction in any medium, provided the original work is properly cited.

Retrovirology 2008, 5:107 http://www.retrovirology.com/content/5/1/107
Page 2 of 16
(page number not for citation purposes)
Background
Current combination antiretroviral therapy (cART) does
not attack virus-infected cells themselves but targets viral
replication at major steps in the viral life cycle [1]. Thus,
the decline of HIV-1 plasma viremia induced by cART has
been interpreted to reflect cell-specific decay rates of HIV-
infected cells with different life-spans and rates of virus
production [2,3]: A first phase of decay, perceptible within
the first weeks of cART, has been attributed to the initial
loss of productively infected activated T-lymphocytes.
Due to their intrinsically short life-span [4] and to direct
viral and immunity-mediated cytopathic effects [5], these
cells are prone for rapid cell-death.
Later phases of decay were thought to reflect expanded
life-spans of virus producing macrophages or memory T-
lymphocytes [5]. In addition, latently infected cells reacti-
vated to productivity, may also contribute to the pool of
HIV-virions observed in later decay phases [2,3]. When
viremia levels fall below the threshold of detection, per-
sisting infection is primarily due to a long lived reservoir
of latently infected CD4+ cells [6-8].
Mathematical models based on plasma viremia only indi-
rectly allow inferring kinetics of latently infected cells
which lack virus production. Direct quantification of
latently infected cells ex vivo has commonly been attained
by viral outgrowth assays of resting CD4+-T-lymphoctyes
[6]. These bioassays relying on inducibility and longevity
of donor and indicator cells may underestimate numbers
of latently infected cells. Accordingly, their frequencies
during cART have been estimated to be very low, in the
order of 1 in 106 lymphocytes [8]. Further characterization
of the cells constituting the latent reservoirs has revealed
that only a very low percentage of resting CD4 T-cells car-
rying HIV-DNA can be induced ex vivo to give rise to viral
transcription[9] or antigen production [10].
This contrasts with comparatively high levels of cell-asso-
ciated viral RNA (hundreds to thousands of viral RNA
copies/106 cells) observed in peripheral blood of patients
on cART, even in the absence of detectable plasma viremia
[11-14]. Recently, evidence has accumulated that HIV-
RNA persisting during cART may to a large extent reflect
basal transcription in latently infected cells devoid of vir-
ion production [9,12,15-17]. Such bulk measurements of
cellular HIV-1 RNAs, despite their potential to monitor
viral activity far beyond undetectable viremia [15], have
considerable shortcomings, namely their lack of unam-
biguous differentiation between viral transcription in
latently versus productively infected cells.
In the present study we refined the analysis of HIV-tran-
scription, by combining highly sensitive PCR assays for a
panel of unspliced (UsRNA) and multiply spliced
(MsRNA) HIV-RNA species with limiting dilution end-
point analysis of PBMC. Using this approach, we were
able to dissect the population of HIV-RNA+ PBMC accord-
ing to their level of viral transcription and to determine
frequencies and kinetics of cells expressing proviral DNA
at different rates.
Results
Analysis of HIV-1 transcription in serial dilutions of PBMC
Individually adjusted RT-PCR targeting HIV-1 nucleic
acids was performed on serial dilutions of PBMC assessing
HIV-DNA, UsRNA, total MsRNA and MsRNA-tatrev or
MsRNA-nef [15]. In parallel to testing total RNA extracts,
vRNA-ex representing cell-associated viral particles, was
quantified in separate replicate specimens [12,18]. Limit-
ing dilution analysis of HIV-RNA+ cells was performed to
compute their frequencies which also allowed determin-
ing the average per-cell expression of HIV-RNA.
As shown in figure 1A, the numbers of cells expressing
UsRNA or MsRNA experienced significant decreases (p =
0.0006) as a result of antiretroviral treatment while
decrease of total HIV-infected PBMC was less pronounced
(p = 0.14). Paired analysis throughout the course of obser-
vation (one-way Anova-Friedman test, comparison of fre-
quencies of HIV-DNA+, UsRNA+, MsRNA+, vRNA+ cells
per patient and per time-point; p < 0.0001) showed that
total HIV-infected PBMC exceeded cells expressing viral
RNA, which revealed a preponderance of transcriptionally
silent provirus in peripheral blood. Moreover, cells
expressing UsRNA were invariably more frequent than
cells expressing MsRNA and the latter were more frequent
than cells positive for UsRNA-ex. These findings provide
evidence for the existence of cells expressing solely UsRNA
and cells expressing MsRNA and presumably also UsRNA
and a third very rare population of cells positive for vRNA-
ex.
To further characterize HIV-RNA expression, average
intracellular per-cell expression of UsRNA and MsRNA
was calculated by normalizing RNA copy numbers to fre-
quencies of total HIV-infected PBMC (figure 1B) or to
cells actually expressing viral RNA (figure 1C). Using
either mode of calculation, per-cell expression of MsRNA
was significantly lower in samples obtained during cART
as compared to samples from untreated patients (total
cells: 4-fold decrease; p = 0.002; figure 1B, HIV-RNA+ cells
9-fold decrease; p = 0.0004; figure 1C). Reduction of per-
cell UsRNA-expression during treatment attained high sta-
tistical significance when normalized to total HIV-
infected PBMC (20-fold; p < 0.0001; figure 1B) but was
perceptible only as a trend when UsRNA-expression was
normalized to UsRNA+ cells (1.2-fold, p = 0.14; figure
1C). Thus, per-cell MsRNA expression and to a lesser
extent also UsRNA-expression appeared to split up into
two discernible states. From these findings the following
implications can be inferred:
Retrovirology 2008, 5:107 http://www.retrovirology.com/content/5/1/107
Page 3 of 16
(page number not for citation purposes)
i) Several classes of HIV-infected cells differing in their
viral transcriptional activity co-occur before therapy. After
initiation of cART cells with lower RNA content appear to
outlast cells expressing higher levels of viral RNA.
ii) Three cell classes can be dissected directly using limit-
ing cell-dilution, by virtue of their hierarchical distribu-
tion of frequencies: a class which expresses solely UsRNA,
one class expressing MsRNA and presumably also UsRNA
and a class of cells positive for vRNA-ex.
iii) Cells expressing MsRNA may host one or more sub-
categories of infected cells with lower and higher viral
transcriptional activity.
A model for stratification of viral RNA content in HIV-1
infected PBMC
To account for the observed complexity of HIV-RNA
expression in PBMC, we designed a simple model to
resolve and identify cell categories of different transcrip-
tional states. In particular, the data presented above sug-
gest the coexistence of four main classes of HIV-RNA+ cells
namely, ILow (low transcriptional activity), IIMedium (inter-
mediate transcriptional activity), IIHigh (high transcrip-
tional activity) and IIIExtra(ongoing extracellular virion
shedding).
ILow
HIV-1 infected cells containing solely UsRNA. The existence
of this cell class is deduced from our observations that
UsRNA-positive cells were invariably more frequent than
cells expressing MsRNA.
IIMedium
HIV-1 infected cells expressing MsRNA at low levels. Evidence
for this class of cells is based on significant differences in
per-cell MsRNA content in PBMC from patients on cART
as compared to untreated patients. It is highly likely that
such cells express UsRNA because MsRNAs are obligato-
rily derived from primary unspliced HIV-transcripts [19].
IIHigh
HIV-1 infected cells with elevated viral transcription. Signifi-
cantly higher relative expression of both UsRNA and
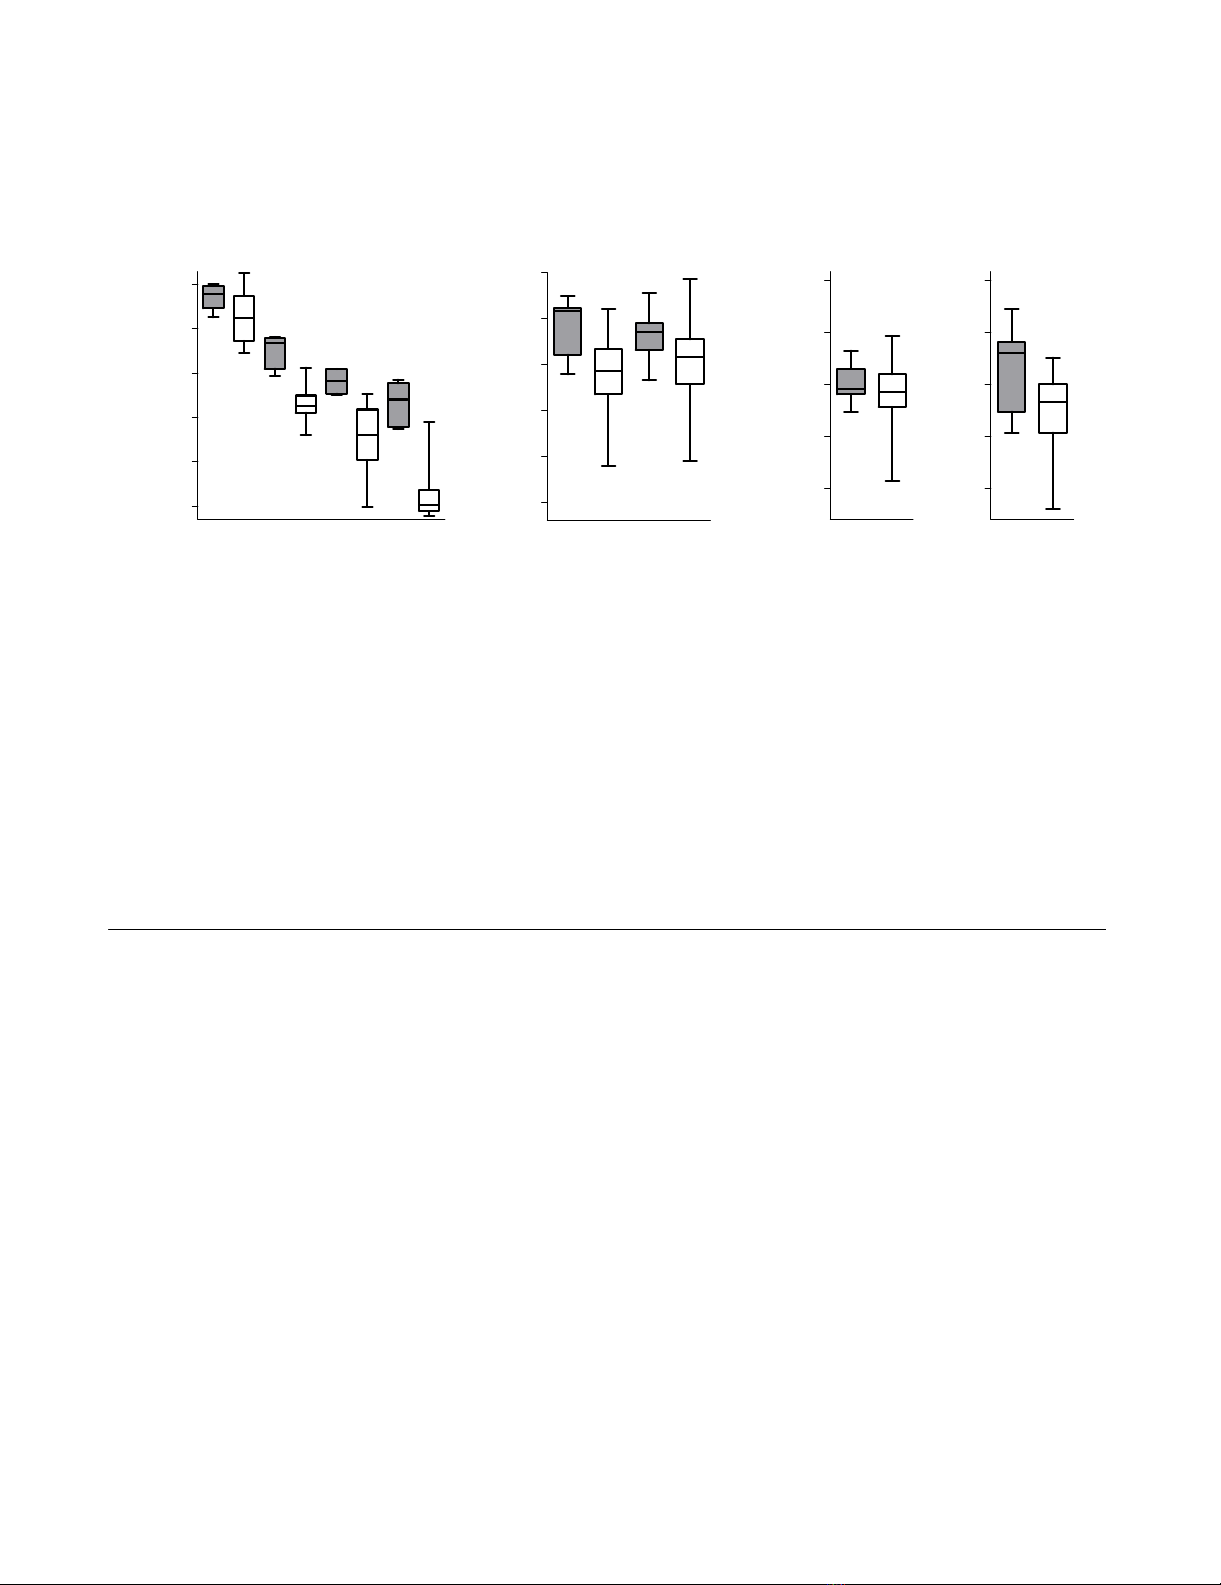
Antiretroviral therapy mediated decreases in HIV-infected cells and average cellular viral transcriptional activityFigure 1
Antiretroviral therapy mediated decreases in HIV-infected cells and average cellular viral transcriptional activ-
ity. HIV-RNA (UsRNA, MsRNA, vRNA-ex), HIV-DNA levels and frequencies of PBMC positive for HIV-RNAs were measured
before start of cART (grey boxes) and at six time-points during treatment (white boxes). Signature signifies the type of viral
nucleic acid measured for determination of infected cell-numbers. Sample sizes in each group (n = sample numbers, analysis of
5 patients, one time point before cART, six time-points during therapy, only data of time points with PCR-positive samples
were included) are indicated below diagrams and p-values of Mann-Whitney comparison of treated versus untreated groups
are indicated above. Groups are displayed as "box and whiskers" showing the median, 75% percentiles and range of each data
set. A: Frequencies of total infected PBMC, as represented by HIV-DNA levels and frequencies of PBMC expressing viral RNAs
determined by limiting dilution as described in figure 2. (B: Average per-cell expression of intracellular viral RNAs (UsRNA,
MsRNA) normalized to HIV-DNA (representing the total number of HIV-infected cells). C: Average per-cell expression of
intracellular viral RNAs normalized to the numbers of PBMC expressing viral RNA. To favour sampling of balanced average
populations, solely viral RNA measurements from specimens containing more than 106 PBMC were analyzed in B and C (n = 2–
6 per time-point and patient).
10
1
RNA-copies/DNA copies
10
0
10
-1
10
-2
10
-3
10
-4
18
RNA-copies/Us-RNA
+
cell
10
3
10
2
10
1
10
0
10
-1
RNA-copies/Ms-RNA
+
cell
10
3
10
2
10
1
10
0
10
-1
UsRNA MsRNA
-+ +-
119 9218
Signature:
cART:
n=
5
UsRNA vRNA-ex
-+ +-
28 1055
HIV-DNA
-+
30 18
UsRNA MsRNA
-+ +-
119 9218
10
4
HIV+ cells/10
6
PBMC
10
3
10
2
10
1
10
0
10
-1
p=0.0004
p=0.14
p<0.0001
p=0.002
p=0.0006
p=0.0006
p=0.14
B: Viral intracellular RNA normalized
to total HIV-infected cells
A: Frequencies of PBMC
positive for HIV-1 nucleic acids
C: Viral intracellular RNA normalized
to cells expressing HIV-RNA
p=0.003
MsRNA
5
-+
30

Retrovirology 2008, 5:107 http://www.retrovirology.com/content/5/1/107
Page 4 of 16
(page number not for citation purposes)
MsRNA in untreated versus treated patients, suggests fre-
quent presence of cells exhibiting Tat/Rev-mediated tran-
scriptional activation [20,21] at baseline.
IIIExtra
Cells carrying virion-enclosed HIV-1 RNA. Such cells to a
major extent represent productively infected cells in a
state of ongoing or recent burst of viral shedding as previ-
ously demonstrated by their association with activated
viral transcription [12,15,16].
Applying distinct criteria as compiled in table 1, allowed
to calculate the number of cells allocated to each cell-class
for each specimen containing viral RNA. Thus frequencies
of cell-classs were calculated during the course of cART. By
using our dataset comprising 476 HIV-RNA+ specimens of
total RNA extracts, relative per-cell expression of UsRNA
and MsRNA in the three transcriptional categories ILow,
IIMedium and IIHigh could be calculated as outlined in figure
2.
Distinct transcriptional signatures of HIV-infected PBMC
Analysis of viral RNA per-cell contents (figure 3) con-
firmed that relative expression of HIV-RNA increased in
the three transcriptional categories ILow, IIMedium and IIHigh.
Median viral RNA expression ranged from 3.7 HIV-RNA
copies/cell in class-ILow to 15 copies/cell in class-IIMedium
and to 333 copies/cell in class-IIHigh. Notably, in class-IIMe-
dium UsRNA expression was approximately four times
higher than MsRNA expression (p < 0.0001, Wilcoxon
signed rank test), whereas class-IIHigh showed an inverse
pattern with MsRNA expression equaling or slightly
exceeding UsRNA expression (p = 0.06; Wilcoxon signed
rank test). Thus class-IIMedium and class-IIHigh displayed dif-
ferent viral transcriptional signatures.
To further validate our stratification of HIV-infected
PBMC, relative RNA contents of UsRNA and MsRNA in
ILow, IIMedium and IIHigh were compared in specimens
obtained prior to and during therapy. In the stratum with
basal viral transcription of exclusively UsRNA (ILow), per-
cell viral RNA contents did not differ between baseline
and cART (geometric mean, 95%CI, baseline = 2.1, 1.1–
3.9 copies/cell; n = 22; on cART = 3.1, 2.4–4.0 copies/cell;
n = 158, Mann Whitney test p = 0.22) indicating that this
cell-class did not comprise additional subcategories. Sim-
ilarly, in class IIMedium cells, per cell content of UsRNA plus
MsRNA did not reveal a statistically significant difference
when baseline samples were compared to specimens
obtained during cART (geometric mean, 95%CI, baseline
= 26, 13–47 copies/cell; n = 26, on cART = 14, 11–18 cop-
ies/cell; n = 170, Mann Whitney test p = 0.06). Since sam-
ples obtained during cART also comprised study week 2,
when plasma viremia had not yet stabilized, we also per-
formed comparison of baseline samples to cART without
the specimens from week 2. Similarly this analysis did not
reveal statistically significant differences between the two
groups (data not shown, Mann-Whitney test, p = 0.11).
Thus, viral RNA expression in class-IIMedium cells did not
experience evident changes during the course of antiretro-
viral therapy.
Conversely, viral RNA content was 5× higher (Mann Whit-
ney test p < 0.0001) in class-IIHigh at baseline (geometric
mean, 95%CI= 532, 334–846 copies/cell; n = 50) as com-
pared to on-therapy samples (geometric mean, 95%CI =
102, 66–158 copies/cell, n = 50).
This shows that categorization of cells expressing MsRNA
into the classes IIMedium and IIHigh was still not sufficient to
delineate the full scale of viral transcriptional patterns. On
a biological level, this finding provides evidence that
class-IIHigh in untreated patients may harbor a subcategory
of HIV-infected cells expressing hundreds of viral RNA
copies per cell which likely represents productively
infected lymphocytes. Due to limitations in sample size
and resolution, transcriptional class-IIHigh could not be
further dissected. However, we observed that cells express-
ing significant amounts of vRNA-ex (class-IIIExtra, table 1),
a surrogate of productive HIV-infection [12,15,16],
occurred primarily before initiation of cART and were in
general rarer than class-IIHigh cells. Hence it is conceivable
that class-IIIExtra represents a productively infected sub-
category of class-IIHigh. Because the procedure for measur-
ing vRNA-ex necessitates nucleolytic digestion of
intracellular RNA and precludes simultaneous quantifica-
tion of intracellular MsRNA and UsRNA, co-localization
of class-IIIExtra cells with class-IIHigh in a given sample
could not be tested. A minor subcategory of cells harbor-
ing vRNA-ex at very low levels (class-IIIR, table 1) was not
further characterized because it was likely that these cells
may not be HIV-infected but carry passively absorbed
plasma virus [12].
Kinetics of HIV-1 infected PBMC during cART
Turnover and kinetics of HIV-1+ PBMC were analyzed and
compared to the decay of plasma viremia as shown in fig-
ure 4 and table 2.
Plasma viremia during one year of cART showed a two
phase decline with an initial half-life (mean ± sem, days)
of 1.6 ± 0.2 d and a second phase with a half-life of 8.1 ±
2.3 d and suppression of viremia predominantly below
levels of 50 RNA copies/ml after 12 weeks of treatment
(figure 4A). The fact that plasma viremia of patients 111
and 112 were slightly elevated at study week 48 was not
considered a therapy failure, since plasma viremia
returned to levels below 50 copies/ml at the next visit and
remained suppressed during treatment for a further year
(data not shown).
Retrovirology 2008, 5:107 http://www.retrovirology.com/content/5/1/107
Page 5 of 16
(page number not for citation purposes)
Whereas the total number of HIV-1 infected cells, as
assessed by HIV-1 DNA levels, experienced comparably
modest (74 ± 7%) and slow (t1/2 = 71 ± 60 d) decreases,
in general more than 90% of HIV-1 RNA+ cells decayed
rapidly after therapy initiation. HIV-infected cell cate-
gories of elevated transcriptional activity (class IIHigh,
class-IIIExtra) became frequently undetectable after initi-
ation of cART. However, their overall kinetics did not
unequivocally match plain single phase exponential
decay.
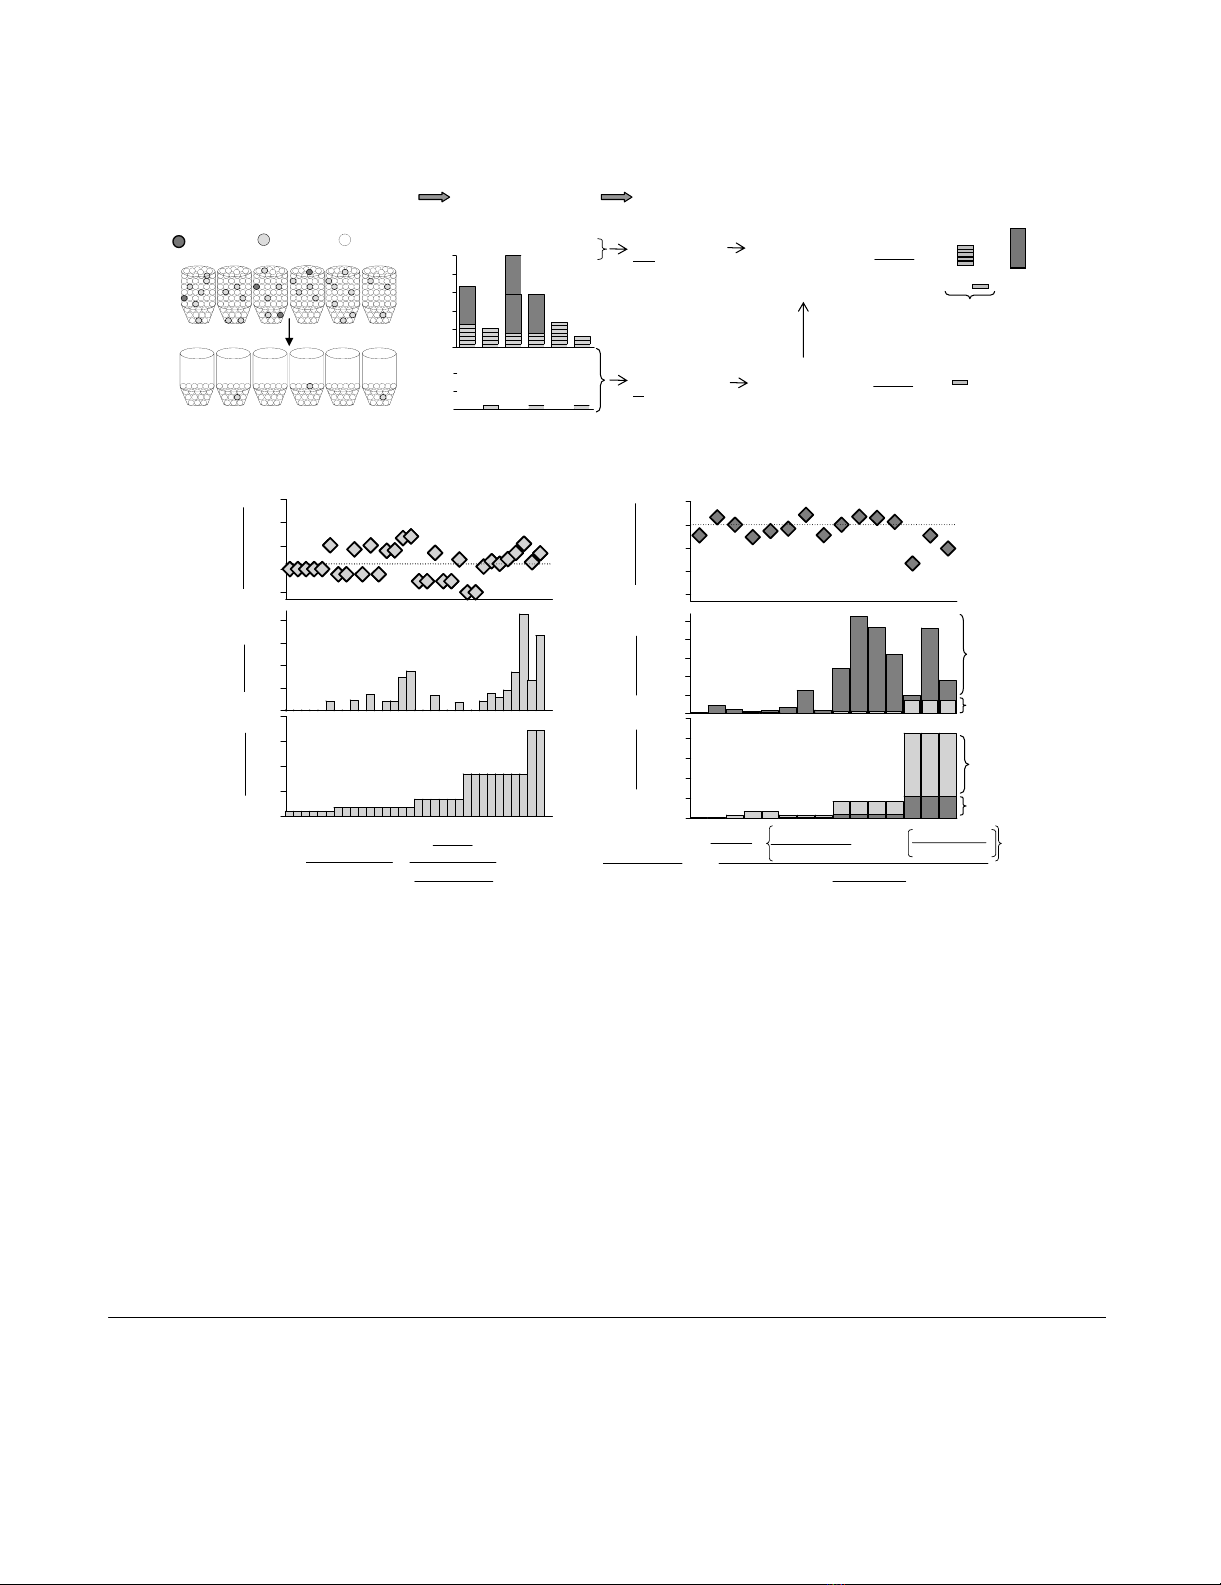
Outline of experimental strategyFigure 2
Outline of experimental strategy. A: Algorithm for combining limiting dilution of cells with RT-PCR. HIV-RNAs (in this
example MsRNAs) of serial 5-fold dilutions of cells (left panel) are measured by RT-PCR (middle panel). Analysis of replicates
of each dilution (right panel) reveals both the viral RNA content and the frequencies (estimated by 50% end-points) HIV-RNA+
cells. Applying criteria listed in table 1, in this case expression of either MsRNA-tatrev or MsRNA-nef (class-IIMedium) and
expression of both MsRNA-tatrev and MsRNA-nef (class-IIHigh), cell classes differing in HIV-RNA content can be discerned.
Specific HIV-RNA expression in each class of MsRNA+ cells can then be normalized by dividing MsRNA copies by the numbers
of infected cells. In specimens positive for class-IIHigh cells which always contain class-IIMedium, the contribution of class-IIMedium
needs to be considered (see formulas in panel B). Note that analysis of UsRNA contents in different cell-classes followed the
same schemes. B: Analysis of specific MsRNA per-cell expression exemplified for patient 112. MsRNA expression (middle pan-
els) was normalized to the number of HIV-RNA+ cells (bottom panels) resulting in MsRNA expression per cell (top panels).
The left three panels comprise specimens positive for class-IIMedium expression only. In the right three panels indicating speci-
mens positive for class-IIHigh MsRNA, the average contribution of class-IIMedium+ cells (light grey bars) was subtracted from
MsRNA copy numbers before normalization to the number of class-IIHigh + cells. The dotted lines in the top panels show the
geometric means (meangm) of all data-points. Note that RNA copies per sample and frequencies of MsRNA+ cells (middle and
bottom panels) are depicted in a linear scale which may result in column heights hardly discernible from zero. Formulas at the
bottom describe the calculations performed. Bars show PCR results of separate replicates of PBMC dilutions, horizontal axes
in the diagrams have no dimension
extrapolated
contribution
of II
Medium
+
cells
0
MsRNA
+
cells
sample
10
2
10
1
10
3
10
0
10
-1
2000
1500
2500
1000
500
200
150
250
100
50
MsRNA
sample
MsRNA copies
Class-II
H
+ cell
MsRNA copies
II
Medium
+ cell II
Medium+
cells
sample
MsRNA
sample
=MsRNA copies
II
High+
cell =
II
Medium+
cells
sample
MsRNA
sample mean
gm
൮í
II
High+
cells
sample
MsRNA copies
II
Medium+
cell
MsRNA copies
II
Medium
+ cell
10
2
10
1
10
3
10
0
10
-1
75
50
100
25
0
15
10
20
5
MsRNA
sample
MsRNA
+
cells
sample
mean
gm
Analysis of specimens positive for
class-II
Medium
but negative for class-II
High
cells
Analysis of specimens positive for
class-II
Medium
and for class-II
High
cells
Contribution
of II
High
+
cells
Number
of II
Medium
+
cells
Number
of II
High
+
cells
~5 II
Medium+
cells/tube
II
High+
cells
50% - endpoint
~1 cell/tube
II
Medium+
cells
50% - endpoint
~1 cell/tube
Preparation of serially diluted cells Calculation of cell-frequencies, and per cell viral RNA content
MsRNA-tatrev
and MsRNA-nef
MsRNA-tatrev
or MsRNA-nef =
MsRNA
sample
MsRNA
sample
RNA
content of
II
Medium +
=+
RNA
content of -
II
High+
cells
B
A
RNA-quantification
+- ++ - -
++ + +++
-+ -+ -+
5-fold dilution
uninfectedII
Medium
II
High
extrapolated
contribution
of II
Medium
+
cells
5 x


![PET/CT trong ung thư phổi: Báo cáo [Năm]](https://cdn.tailieu.vn/images/document/thumbnail/2024/20240705/sanhobien01/135x160/8121720150427.jpg)


