
RESEARC H Open Access
Characterization of vascular strain during in-vitro
angioplasty with high-resolution ultrasound
speckle tracking
Prashant Patel
1
, Rohan Biswas
1
, Daewoo Park
1,2
, Thomas J Cichonski
1
, Michael S Richards
3
, Jonathan M Rubin
4
,
Sem Phan
5
, James Hamilton
6
, William F Weitzel
1*
* Correspondence:
weitzel@umich.edu
1
Department of Internal Medicine,
University of Michigan, Ann Arbor,
MI, USA
Abstract
Background: Ultrasound elasticity imaging provides biomechanical and elastic
properties of vascular tissue, with the potential to distinguish between tissue motion
and tissue strain. To validate the ability of ultrasound elasticity imaging to predict
structurally defined physical changes in tissue, strain measurement patterns during
angioplasty in four bovine carotid artery pathology samples were compared to the
measured physical characteristics of the tissue specimens.
Methods: Using computational image-processing techniques, the circumferences of
each bovine artery specimen were obtained from ultrasound and pathologic data.
Results: Ultrasound-strain-based and pathology-based arterial circumference
measurements were correlated with an R
2
value of 0.94 (p = 0.03). The experimental
elasticity imaging results confirmed the onset of deformation of an angioplasty
procedure by indicating a consistent inflection point where vessel fibers were fully
unfolded and vessel wall strain initiated.
Conclusion: These results validate the ability of ultrasound elasticity imaging to
measure localized mechanical changes in vascular tissue.
Introduction
Peripheral vascular disease is a widespread problem in the United States [1-3]. Current
treatment options aimed at tissue revascularization are effective; however, practitioners
continue to face the underlying disease process of neointimal hyperplasia leading to rest-
enosis [4-7]. Ultrasonography has been used for graft surveillance to detect stenotic
lesions [8]. The use of local elasticity imaging has provided more accurate estimates of
the biomechanical properties of tissue by directly measuring intramural strain. Ultraso-
nography with phase-sensitive speckle-tracking algorithms is increasingly used as a
robust, noninvasive tool for assessing the mechanical and elastic properties of subsurface
structures, including vascular tissue [9-11]. Recent investigation indicates the potential
of using Doppler strain rate imaging to clinically assess elastic properties of the vessel
wall in patients with coronary artery disease [12]. Beyond the direct strain measurements
that have been employed to date, ultrasound elasticity imaging has the potential to
distinguish simple tissue motion or “translation”from the strain or “deformation”that
we investigate in this study.
Patel et al.Theoretical Biology and Medical Modelling 2010, 7:36
http://www.tbiomed.com/content/7/1/36
© 2010 Patel et al; licensee BioMed Central Ltd. This is an Open Access article distributed under the terms of the Creative Commons
Attribution License (http://creativecommons.org/licenses/by/2.0), which permits unrestricted use, distribution, and reproduction in
any medium, provided the original work is properly cited.

Since angioplasty is a common treatment for stenosis and results in changes in the
arterial fiber anatomy of the tunica media as the angioplasty balloon expands, we
investigated the ultrasound elasticity imaging characteristics of angioplasty in the
laboratory setting. We hypothesized that elasticity imaging may detect different strain
patterns as the arterial fibers unfold during balloon expansion. We further hypothe-
sized that normal strain and shear strain may indicate physical changes in fiber archi-
tecture corresponding to the angioplasty process. To evaluate the ability of ultrasound
elasticity imaging to detect definable histologic changes induced during angioplasty, we
compared ultrasound strain measurements of bovine artery specimens with the physi-
cal characteristics of the vessel obtained on pathology tissue specimen examination.
Methods
Elasticity Imaging Data
High-resolution imaging data can be obtained using radio frequency (RF) ultrasound
signals containing speckle information to accurately track the motion of structures
within an imaged object such as the lumen wall of an artery [13,14]. The first step in
this process is to estimate the motion, or displacement, of the object from frame to
frame. The frames need not be adjacent. The displacement of the object in the ultra-
sound images is estimated using a two-dimensional, correlation-based, phase-sensitive
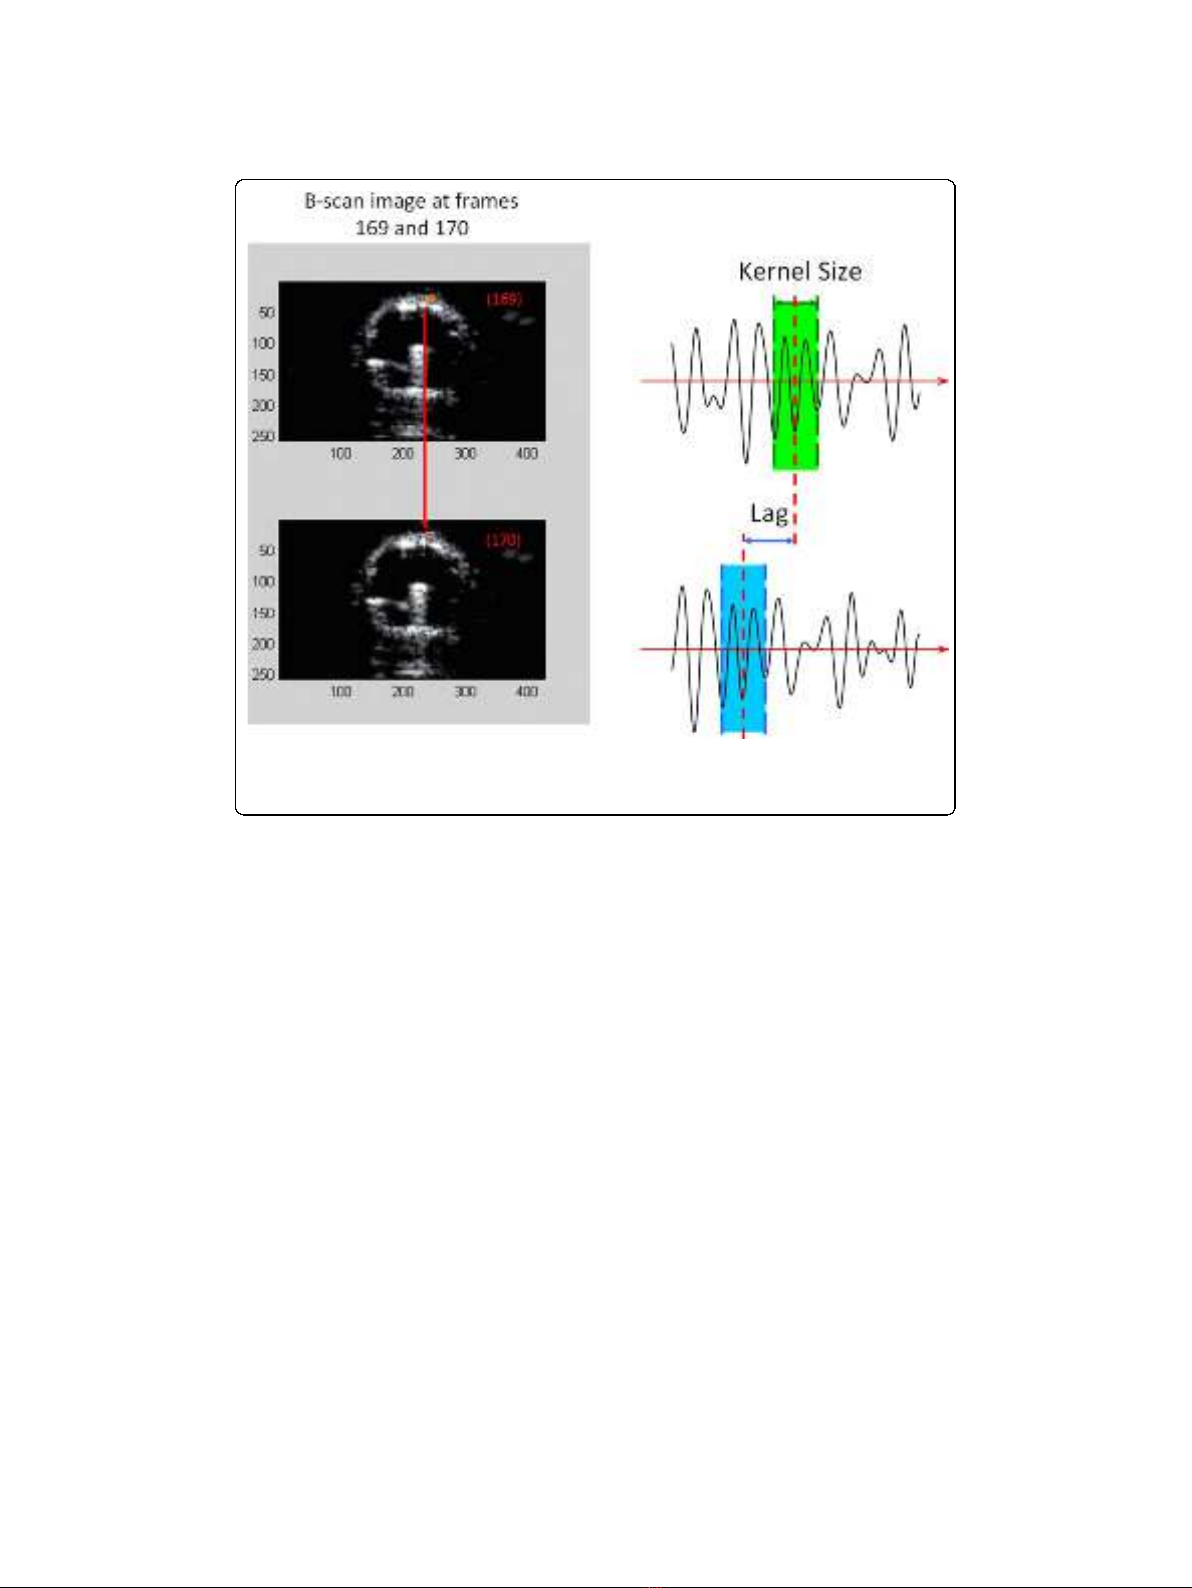
speckle-tracking technique [15]. Figure 1 illustrates the displacement “lag”from one
frame to the next calculated using the underlying RF ultrasound signal. The axial dis-
placement is then further refined by determining the zero-crossing position of the
phase of the analytic signal correlation. Strain values are determined by numerically
calculating the spatial derivatives (gradients) of the displacement values.
The components of strain were determined according to the location of the arterial
wall. The two principal strain components were axial strain, which is the strain along
the beam direction, and lateral strain, which is perpendicular to the axial strain. The
derivative, with respect to time, of the displacement provides the strain. For two-
dimensional speckle tracking, this process is repeated multiple times for each beam
and between adjacent beams that comprise the image. For our study, the axial and lat-
eral displacements were calculated at the position of the maximum correlation coeffi-
cient, using a correlation kernel size approximately equal to the speckle spot. The axial
displacement estimate was then further refined by determining the phase-zero crossing
position of the analytic signal correlation. A spatial filter twice as large as the kernel
size was used to enhance signal-to-noise ratio for better spatial resolution. A weighted
correlation window was used with spatial filtering of adjacent correlation functions to
reduce frame-to-frame displacement error. To support the calculation of strain, inter-
frame motion of reference frame pixels was integrated to produce the accumulated tis-
sue displacement. Spatial derivatives of the displacements were calculated in a region
of the artery to estimate the radial normal strain. All strain values were measured in
the axial direction, where resolution is at least an order of magnitude greater than that
in the lateral direction. Thus, the axial strain is more accurate due to the direction of
the beam.
Ultrasound data and video B-scans were obtained for four of five bovine carotid
artery specimens and used to determine the vessel diameter and path-length data
(Artegraft®, North Brunswick, NJ, USA). The fifth artery specimen served as the
Patel et al.Theoretical Biology and Medical Modelling 2010, 7:36
http://www.tbiomed.com/content/7/1/36
Page 2 of 11
control, which would indicate the “plasty,”or change in fiber architecture, of the other
samples. These reasonably uniform tissue samples were preserved in 1% propylene
oxide and 40% aqueous U.S.P. ethyl alcohol. Because this in vitro model is highly idea-
lized, it is limited in accounting for the behavior of diseased vessels which may be
hyperplastic or atherosclerotic. However, the samples are produced for clinical use in
vascular bypass and dialysis access construction, making them an excellent vascular
substrate for our angioplasty study.
A WorkHorse™II (AngioDynamics, Queensbury, NY, USA) angioplasty balloon
(10-mm diameter by 4-cm length) was inserted into each artery. The standard, non-
compliant balloon was expanded manually using linearly increasing pressure while
observing the pressure sensor reading during ultrasound data capture. Specimens were
suspended in an ultrasound water tank containing physiologic (9%) saline solution.
Imaging was performed using a Siemens Sonoline Elegra scanner (SSN4363, Deerfield,
IL, USA) with a 7.5-MHz linear ultrasound transducer fixed in a harness for data col-
lection while the angioplasty balloon was inflatedfrom0to5atmofpressureinall
experimental specimens. The uninflated pressures were transmitted to the wall during
inflation by balloon unfolding. However, the interaction between the unfolding balloon
and the arterial wall is likely to be complicated, and some of the friction between the
balloon surface and the intima is zero. Because we were unable to measure these
effects, they were not included in the experimental method. Once the balloon was
inflated, no further pressure in the balloon was transmitted to the arterial wall. Uneven
stress due to balloon folding was a limitation of our experimental method; however,
Figure 1 The displacement of the vessel wall from frame to frame observed using the “lag”
distance in the underlying ultrasound signal. These displacements are estimated using correlation-
based algorithms and phase-sensitive speckle tracking.
Patel et al.Theoretical Biology and Medical Modelling 2010, 7:36
http://www.tbiomed.com/content/7/1/36
Page 3 of 11

this is the way angioplasty is conducted in the clinical setting. The balloon-inflated ves-
sels were fully expanded at 2 atm. Real-time RF data were collected and processed off-
line using computational techniques for each artery.
Four regions of interest (ROIs) were selected on the leading edge of the top wall of
each vessel. They were sequentially ordered based on their position relative to the center
of the leading edge. These ROIs were tracked for observing strain patterns during angio-
plasty balloon deformation in the ultrasound B-scan image and determined the regions
on the vessel wall where longitudinal strain, shear strain and average data quality index
(DQI) would be calculated on the basis of the radial displacement of the lumen wall.
The longitudinal strain was calculated as the gradient of the longitudinal displacement
(derivative of the displacement) along the ultrasound beam, and the shear strain was cal-
culated as the partial derivative of the longitudinal displacement (movement along the
ultrasound beam) across the beams. The DQI is the measure of the frame-to-frame cor-
relation, using the phase-sensitive cross-correlation methods previously developed [15].
The DQI is therefore a measure of the accuracy of motion tracking between frames,
used to quantify the quality of the data. A maximal value of 1 indicates the highest level
of tracking reliability. Young’s moduli were obtained for the ROIs and compared against
reported normal physiologic moduli calculated for similar vascular tissue.
The two-dimensional longitudinal strain is defined as
xx
u
x
=∂
∂,
y
y
u
y
=∂
∂and the
two-dimensional shear strain is defined as
xy yx
yx
u
x
u
y
==∂
∂+∂
∂
1
2.The ∂
∂
u
x
yis
the normal strain in axial direction, along the beam, and the ∂
∂
u
y
xis the normal strain
in lateral direction. As mentioned before, the axial direction is more accurate than the
lateral direction, so shear strain was regarded as
xy yx
y
u
x
==
∂
∂.
The Young’s modulus of elasticity for the tissue is EFL
AL
==
0
0∆, ... , where sis
the stress, εis the strain, F is the applied force in Newtons, L
0
represents the initial
non-deformed length, A
0
is the cross-sectional area, and ∆L is the change in length.
Because the tissue exhibits a non-linear elastic response, the Young’s modulus varies
depending on the values of L
0
and ∆L, with the tangent to the stress-strain curve indi-
cating the Young’s modulus for a specific L
0
. However, as ∆L approaches zero, inac-
curacies in measurement become more pronounced. For our analysis we assumed a
linear elastic response (Hooke’s Law) over the region of interest, as ∆Lissmallfor
angioplasty-induced pressure variations considered in our investigation.
The ultrasound path lengths were determined using Adobe Illustrator CS2 (AI CS2;
Adobe, San Jose, CA, USA) software and the Pathlength plug-in for the program (Tele-
graphics, Australia) to find the length of each traced fiber given only in the superficial
unit of points. Using AI CS2, the n
th
frame and the final frame from the B-mode video
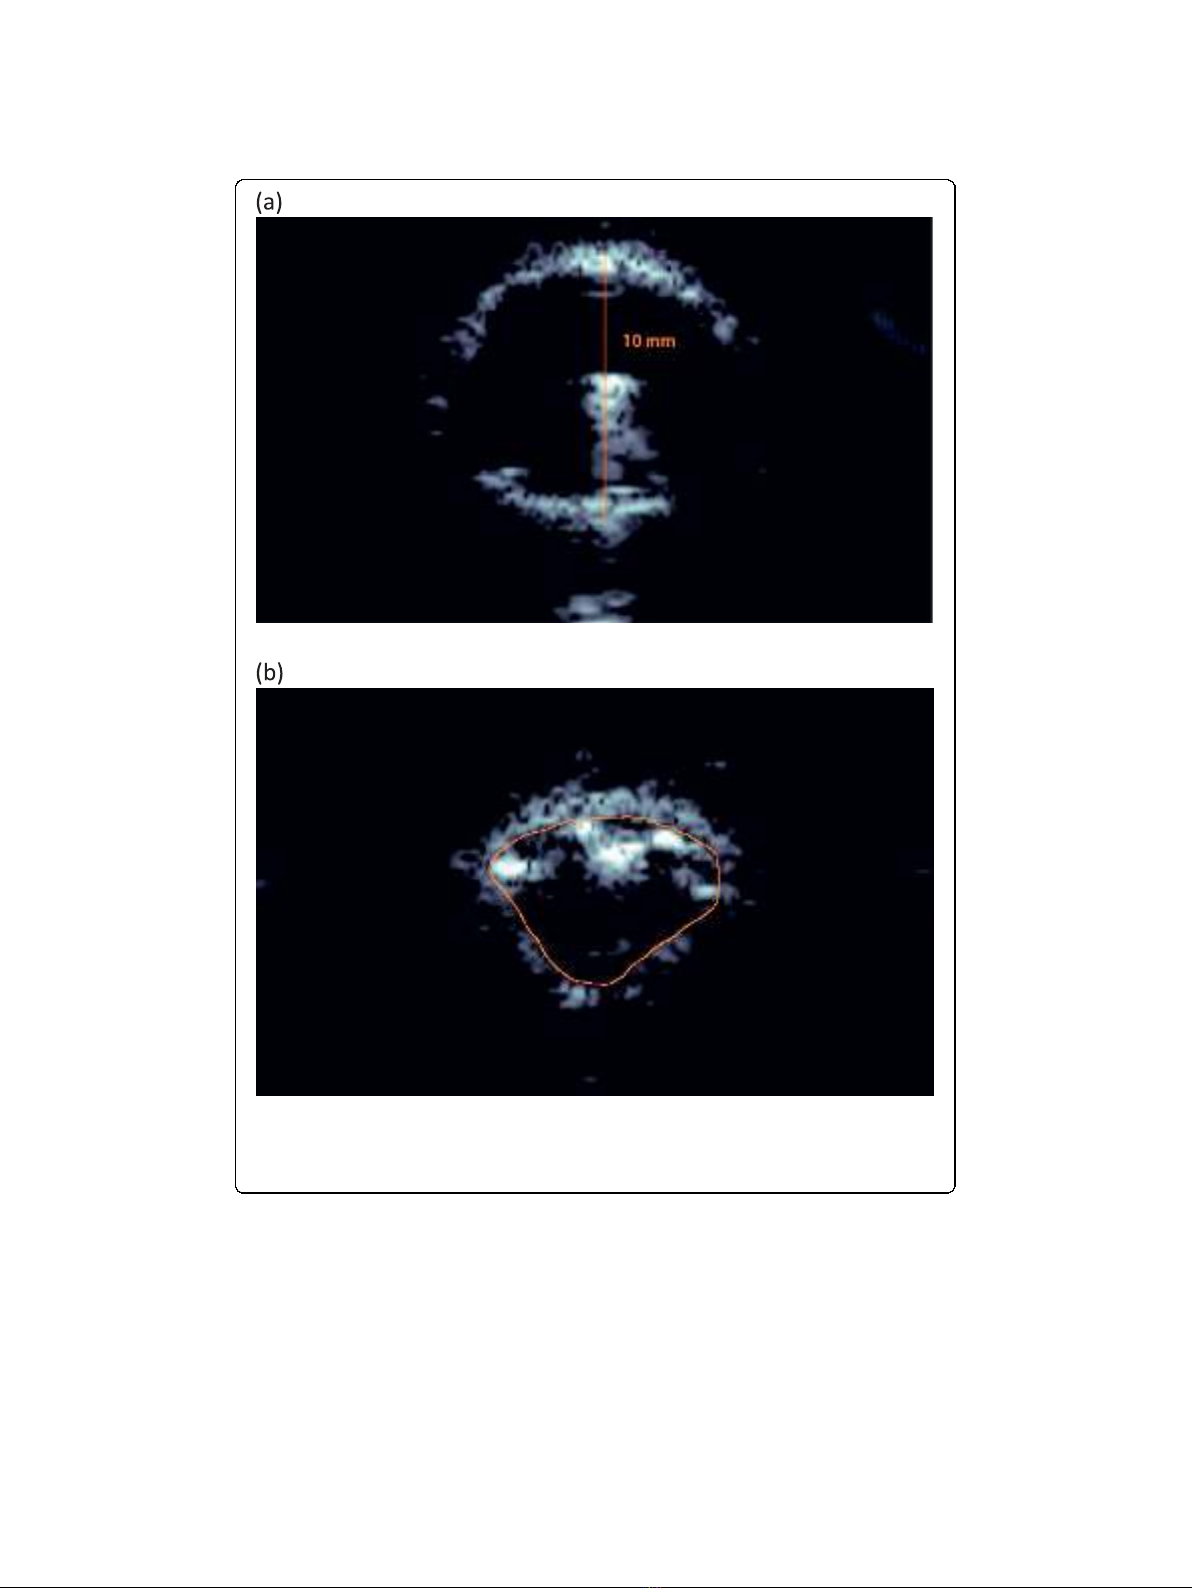
were compared for each artery, as seen in Figure 2 for artery 1. The final frame shows
the fully inflated angioplasty balloon. Because the diameter of the balloon had a known
valueof10mm,itwaspossibletousethefinalframetoobtainthemillimeter/points
ratio that would be used in calculating elasticity-imaging circumference in millimeters
from the ultrasound B-scan image. The circumference of the vessel wall in the n
th
frame, C
n
, was traced and measured using the Pathlength filter and converted into
millimeters using the final frame’s millimeter/points ratio.
Patel et al.Theoretical Biology and Medical Modelling 2010, 7:36
http://www.tbiomed.com/content/7/1/36
Page 4 of 11
Pathology Data
Five histologic slides were prepared by staining a cross-section of each of the five
bovine carotid artery specimens with Masson’s trichrome solution (for collagen) to
observe the extra-cellular matrix composition. Four magnified images of each specimen
were obtained. Figure 3(a) delineates the major region of interest, the tunica media, in
these slides.
Using AI CS2 and the Pathlength plug-in, ten separate fibers were traced by hand in
each magnified image. Figure 3(b) shows the traced, or “true”paths (black lines) and
Figure 2 B-scan images of artery 1. Given that the diameter of the full-blown angioplasty balloon is 10
mm in the final frame (a), when the artery was stretched to comply with the balloon, the circumference of
the vessel wall in the n
th
frame (b) could be estimated by tracing the inner arterial wall. Note that the
superficial spots are parts of the folded balloon.
Patel et al.Theoretical Biology and Medical Modelling 2010, 7:36
http://www.tbiomed.com/content/7/1/36
Page 5 of 11


![PET/CT trong ung thư phổi: Báo cáo [Năm]](https://cdn.tailieu.vn/images/document/thumbnail/2024/20240705/sanhobien01/135x160/8121720150427.jpg)


