
Genome Biology 2005, 6:R22
comment reviews reports deposited research refereed research interactions information
Open Access
2005Shyamsundaret al.Volume 6, Issue 3, Article R22
Research
A DNA microarray survey of gene expression in normal human
tissues
Radha Shyamsundar*†, Young H Kim*, John P Higgins*, Kelli Montgomery*,
Michelle Jorden*, Anand Sethuraman‡, Matt van de Rijn*, David Botstein‡¶,
Patrick O Brown†§ and Jonathan R Pollack*
Addresses: *Department of Pathology, Stanford University School of Medicine, 269 Campus Drive, CCSR 3245A, Stanford, CA 94305-5176,
USA. †Department of Biochemistry, Stanford University School of Medicine, 279 Campus Drive, Stanford, CA 94305-5307, USA. ‡Department
of Genetics, Stanford University, Stanford, CA 94305, USA. §Howard Hughes Medical Institute, Stanford University School of Medicine, 279
Campus Drive, Stanford, CA 94305-5307, USA. ¶Lewis-Sigler Institute for Integrative Genomics, Princeton University, Princeton, NJ 80544,
USA.
Correspondence: Patrick O Brown. E-mail: pbrown@cmgm.stanford.edu. Jonathan R Pollack. E-mail: pollack1@stanford.edu
© 2005 Shyamsundar et al.; licensee BioMed Central Ltd.
This is an Open Access article distributed under the terms of the Creative Commons Attribution License (http://creativecommons.org/licenses/by/2.0),
which permits unrestricted use, distribution, and reproduction in any medium, provided the original work is properly cited.
Gene expression profiles in normal human tissues<p>A systematic survey of gene expression in 115 human tissue samples using cDNA microarrays provides a dataset that can be used as a baseline for comparison with expression in diseased tissue.</p>
Abstract
Background: Numerous studies have used DNA microarrays to survey gene expression in cancer
and other disease states. Comparatively little is known about the genes expressed across the gamut
of normal human tissues. Systematic studies of global gene-expression patterns, by linking variation
in the expression of specific genes to phenotypic variation in the cells or tissues in which they are
expressed, provide clues to the molecular organization of diverse cells and to the potential roles
of the genes.
Results: Here we describe a systematic survey of gene expression in 115 human tissue samples
representing 35 different tissue types, using cDNA microarrays representing approximately 26,000
different human genes. Unsupervised hierarchical cluster analysis of the gene-expression patterns
in these tissues identified clusters of genes with related biological functions and grouped the tissue
specimens in a pattern that reflected their anatomic locations, cellular compositions or physiologic
functions. In unsupervised and supervised analyses, tissue-specific patterns of gene expression were
readily discernable. By comparative hybridization to normal genomic DNA, we were also able to
estimate transcript abundances for expressed genes.
Conclusions: Our dataset provides a baseline for comparison to diseased tissues, and will aid in
the identification of tissue-specific functions. In addition, our analysis identifies potential molecular
markers for detection of injury to specific organs and tissues, and provides a foundation for
selection of potential targets for selective anticancer therapy.
Published: 14 February 2005
Genome Biology 2005, 6:R22
Received: 29 November 2004
Revised: 14 January 2005
Accepted: 18 January 2005
The electronic version of this article is the complete one and can be
found online at http://genomebiology.com/2005/6/3/R22

R22.2 Genome Biology 2005, Volume 6, Issue 3, Article R22 Shyamsundar et al. http://genomebiology.com/2005/6/3/R22
Genome Biology 2005, 6:R22
Background
DNA microarrays [1,2] have been used to profile gene expres-
sion in cancer and other diseases. In cancer, for example,
microarray profiling has been applied to classify tumors
according to their sites of origin [3-5], to discover previously
unrecognized subtypes of cancer [6-11], to predict clinical
outcome [12-14] and to suggest targets for therapy [15,16].
However, the identification of improved markers for diagno-
sis and molecular targets for therapy will depend on knowl-
edge not only of the genes expressed in the diseased tissues of
interest, but also on detailed information about the expres-
sion of the corresponding genes across the gamut of normal
human tissues.
At present there is relatively little data on gene expression
across the diversity of normal human tissues [17-20]. Here we
report a DNA microarray-based survey of gene expression in
a diverse collection of normal human tissues and also present
an empirical method for estimating transcript abundance
from DNA microarray data.
Results
Hierarchical clustering of gene expression in normal
tissues
To survey gene expression across normal human tissues, we
analyzed 115 normal tissue specimens representing 35 differ-
ent human tissue types, using cDNA microarray representing
26,260 different genes (see Materials and methods). To
explore the relationship among samples and underlying fea-
tures of gene expression, we applied an unsupervised two-
way (that is, genes against samples) hierarchical clustering
method using the 5,592 cDNAs (representing 3,960 different
UniGene clusters [21]) whose expression varied most across
samples (Figure 1a; also see Additional data file 2). Overall,
tissue samples clustered in large part according to their ana-
tomic locations, cellular compositions or physiologic func-
tions (Figure 1b). For example, lymphoid tissues (lymph
node, tonsil, thymus, buffy coat and spleen) clustered
together, as did gastrointestinal tissues (stomach, gall blad-
der, liver, pancreas, small bowel and colon), muscular tissues
(heart and skeletal muscle), secretory tissues (parathyroid,
thyroid, prostate, seminal vesicle and salivary gland), and
female genitourinary tissues (ovary, fallopian tube, uterus,
cervix and bladder). Brain and testis were also found to clus-
ter together, largely because genes encoding ribosomal pro-
teins and lymphoid-specific genes were expressed at
particularly low levels in both tissues, the latter possibly
reflecting immunological privilege [22].
The two-way unsupervised analysis also identified clusters of
coexpressed genes (annotated in Figure 1), which represented
both tissue-specific structures and systems (discussed further
below) and coordinately regulated cellular processes. For
example, on the basis of the shared characteristics of well
annotated genes in the clusters, we identified clusters repre-
senting cell proliferation [23], mitochondrial ATP produc-
tion, mRNA processing, protein translation and endoplasmic
reticulum-associated protein modification and secretion.
Interestingly, proliferation, mitochondrial ATP production
and protein translation were each represented by two distinct
clusters of genes, suggesting that subsets of these functions
might be differentially regulated among different tissues. One
gene cluster corresponded to sequences on the mitochondrial
chromosome [24]; we interpret this feature to reflect the rel-
ative abundance of mitochondria in each tissue sample.
Identifying tissue-specific gene expression
While tissue-specific gene expression features were apparent
in the hierarchical cluster, in order to identify tissue-specific
genes more systematically we performed supervised analyses
using the significance analysis of microarrays (SAM) method
([25], see Materials and methods). Tissue-specific genes were
identified for all tissues analyzed, and included named genes
with known tissue-specific functions, as well as named genes
and anonymous expressed sequence tags (ESTs) that had not
been previously characterized as having tissue-specific func-
tions. For example, while the set of liver-specific genes (Fig-
ure 2) included, as expected, genes encoding blood-clotting
factors (for example, F2, F7), complement components (C1R,
C2), lipid (APOB, APOE) and metal transport proteins (TF,
CP), and proteins for detoxification (CYP2D6, CYP3A7),
amino acid metabolism (PAH, HAL) and carbohydrate
metabolism (G6PT1, GYS2), other intriguing genes, for exam-
ple, WRNIP1 (Werner helicase interacting protein 1), BIRC5
(survivin), ANGPTL3 (angiopoietin-like 3), and CNTNAP1
(contactin associated protein 1), were also identified as selec-
tively expressed in liver. The new connections these results
might make between our knowledge of the gene and its prod-
uct on the one hand, and our knowledge of the physiological
functions, cellular characteristics and pathologies of a specific
organ, on the other, are a step towards better understanding
of both the genes and the organs. Interestingly, we also iden-
tified a smaller number of genes displaying selectively
decreased expression in some organs, for example, splicing
factor SF3B1 in the liver (Figure 2b): we speculate that the
decreased expression of such genes may have a role in regu-
lating cellular/tissue differentiation. Tissue-specific genes
characteristically expressed in each of the tissues we exam-
ined are viewable in Additional data file 6 (see also Additional
data file 3).
Recent efforts by the Gene Ontology (GO) Consortium have
resulted in the systematic annotation of genes, ascribing
genes to specific biological processes, cellular components
and molecular functions [26]. This annotation system, while
rudimentary, facilitates the systematic exploration of the
expression of genes reflecting specific biological processes,
cellular components and molecular functions in these normal
tissues. For example, the gene sets encoding tyrosine kinase,
G-protein-coupled receptor and transcription factor func-
tions, as well as components of the extracellular matrix and
http://genomebiology.com/2005/6/3/R22 Genome Biology 2005, Volume 6, Issue 3, Article R22 Shyamsundar et al. R22.3
comment reviews reports refereed researchdeposited research interactions information
Genome Biology 2005, 6:R22
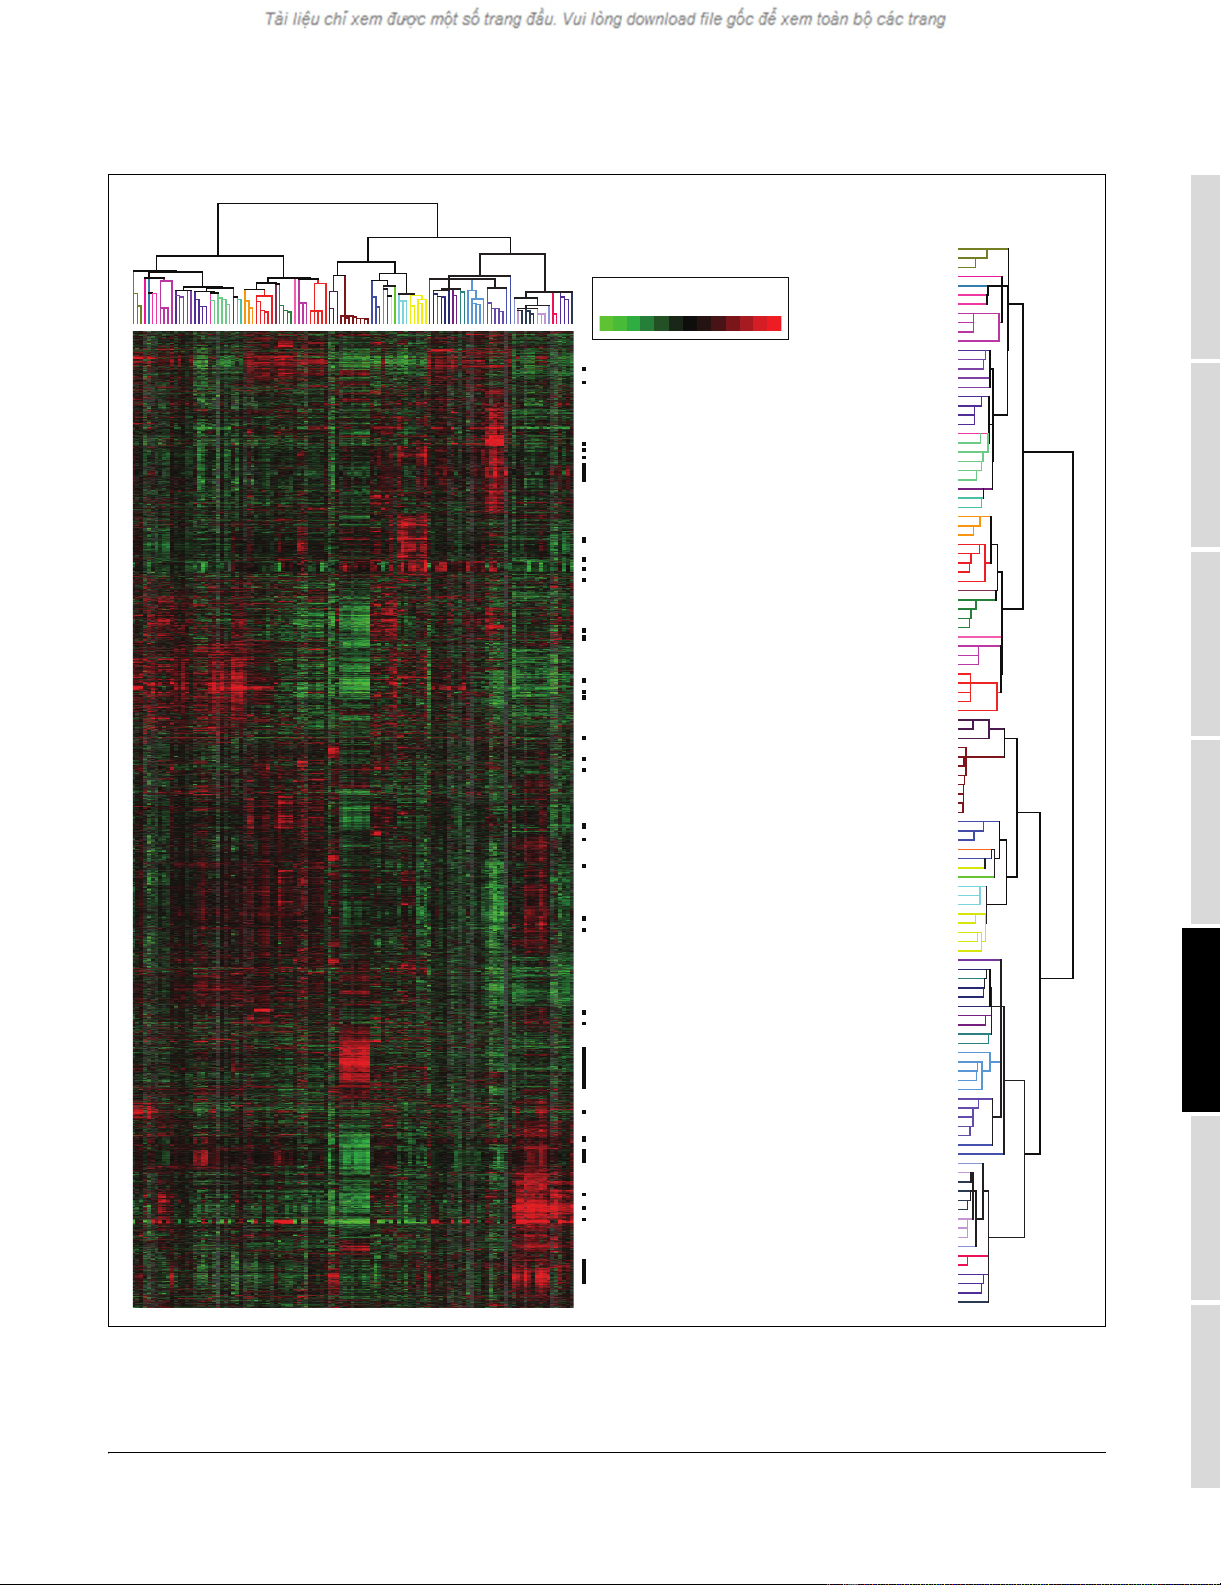
Hierarchical cluster analysis of normal tissue specimensFigure 1
Hierarchical cluster analysis of normal tissue specimens. (a) Thumbnail overview of the two-way hierarchical cluster of 115 normal tissue specimens
(columns) and 5,592 variably-expressed genes (rows). Mean-centered gene expression ratios are depicted by a log2 pseudocolor scale (ratio fold-change
indicated); gray denotes poorly-measured data. Selected gene-expression clusters are annotated. The dataset represented here is available as Additional
data file 2. (b) Enlarged view of the sample dendrogram. Terminal branches for samples are color-coded by tissue type.
Esophagus 0022
Esophagus 0406
Esophagus 0331
Placenta 2876
Vagina 0304
Cervix 2209
Cervix 2385
Lung 1356
Lung 0221
Lung 1351
Lung 0330
Ovary 0408
Fallopian tube 065B
Fallopian tube 065A
Fallopian tube 2184
Fallopian tube 2386
Ovary 0466
Ovary 0314
Ovary 0538
Ovary 1080
Cervix, endo cervical canal 1200
Uterine corpus, myometriun 1205
Uterus, endomyometrium 0002
Uterus, endomyometrium 0126
Uterus, endomyometrium 0158
Uterus, endomyometrium 002B
Small bowel, duodenum 0825
Bladder 1678
Bladder 1004
Seminal vesicle 0233
Seminal vesicle 0234
Seminal vesicle 0235
Prostate 1277
Prostate 0845
Prostate 0805
Prostate 0782
Prostate 1045
Breast, lactating 0162
Salivary gland, parotid 0506
Salivary gland, parotid 0493
Salivary gland, parotid 0396
Salivary gland, parotid 1762
Epididymus 2125
Parathyroid 2995
Parathyroid 1748
Parathyroid 0499
Thyroid 0838
Thyroid 1193
Thyroid 3077
Thyroid 0182
Thyroid 0029
Testes 1853
Testes 1068
Testes 0553
Brain, temporal cortex 2272
Brain, occipital cortex 2271
Brain, frontal cortex 2271
Brain, frontal cortex 2272
Brain, occipital cortex 2273
Brain, occipital cortex 2272
Brain, temporal cortex 2273
Brain, frontal cortex 2273
Adrenal 0433
Adrenal 1111
Adrenal 1354
Thyroid 0555
Adrenal 0558
Heart 0559
Pericardium 0465
Muscle, abdominal 0031
Diaphragm 0366
Muscle, right calf 0315
Heart 0980
Heart 0477
Heart 2869
Heart 0841
Heart 0024
Gallbladder 2131
Stomach, fundus 0878
Colon, ascending 0222
Stomach, body 0468
Stomach, body 0328
Stomach, pylorus 2173
Small bowel, ileum 0359
Small bowel, duodenum 2174
Colon, sigmoid 0361
Colon 2075
Kidney 0265
Kidney 1651
Kidney 1594
Kidney 0226
Kidney 0088
Liver 0560
Liver 1274
Liver 1267
Liver 0032
Liver 0586
Pancreas 2650
Pancreas 0432
Thymus 0512
Tonsil 1398
Lymph node 1337
Lymph node 0599
Lymph node, axillary 0936
Lymph node, axillary 1187
Tonsil 1428
Tonsil 3011
Tonsil 2852
Thymus 0035
Buffycoat 3643
Buffycoat 3642
Spleen 0405
Spleen 0089
Spleen 0125
Lymph node 2096
Gastrointestinal
Epithelial
Liver
Protein folding
Metallothioneins
Mitochondrial enzymes (ATP production)
Skeletal/cardiac muscle
Mitochondrial genome
Skeletal muscle
2
4
>8
0.5
0.25
<0.125
1
Brain
B cells
Prostate
Protein translation
Smooth Muscle
Male specific (Y-chromosomal)
Protein translation
Parathyroid
Testis
Cell proliferation
Connective tissue/ Extracellular matrix
Basement membrane
Epidermal/Epithelial
Stress response
Complement
Adrenal
Endoplasmic reticulum/Secretion
T cells
Monocytes
mRNA processing
Cell proliferation (PCNA)
Mitochondrial enzymes (ATP production)
Female specific
Testis
(b)
(a)
R22.4 Genome Biology 2005, Volume 6, Issue 3, Article R22 Shyamsundar et al. http://genomebiology.com/2005/6/3/R22
Genome Biology 2005, 6:R22
the process of programmed cell death, each demonstrate tis-
sue-specific patterns of expression (Figure 3; see also Addi-
tional data files 4 and 7).
Estimating transcript abundance
DNA microarray experiments are often performed as com-
parative two-color hybridizations, permitting precise quanti-
fication of the ratio of each gene's expression between two
samples. In the experiments reported here, each tissue sam-
ple was compared by hybridization to the same 'common ref-
erence' mRNA (see Materials and methods), a standard
experimental design permitting the comparison of expression
across all samples [27]. Therefore, the primary measure-
ments give us a precise picture of the variation in relative lev-
els of each gene's expression among the samples. While this
information is sufficient for many purposes, a quantitative
comparison of the expression levels of transcripts of different
genes is also of interest, for example in selecting especially
highly expressed genes for potential diagnostic markers or
therapeutic targets. Single-channel fluorescence intensities
can provide a crude estimate of the relative transcript abun-
dance of different genes, but do not control for the variable
quantities of spotted DNA.
To estimate transcript levels for our dataset, we used micro-
array hybridization to compare the common reference mRNA
against normal female genomic DNA. We reasoned that, for
each gene on the microarray, the ratio of mRNA to genomic
DNA should reflect the relative level of transcript in the com-
mon reference compared to normal genomic DNA (for which
each gene is present in two copies per cell). For each tissue
sample in our study, the ratio of expression for each gene in
that sample versus common reference mRNA, multiplied by
the ratio for that gene in common reference mRNA versus
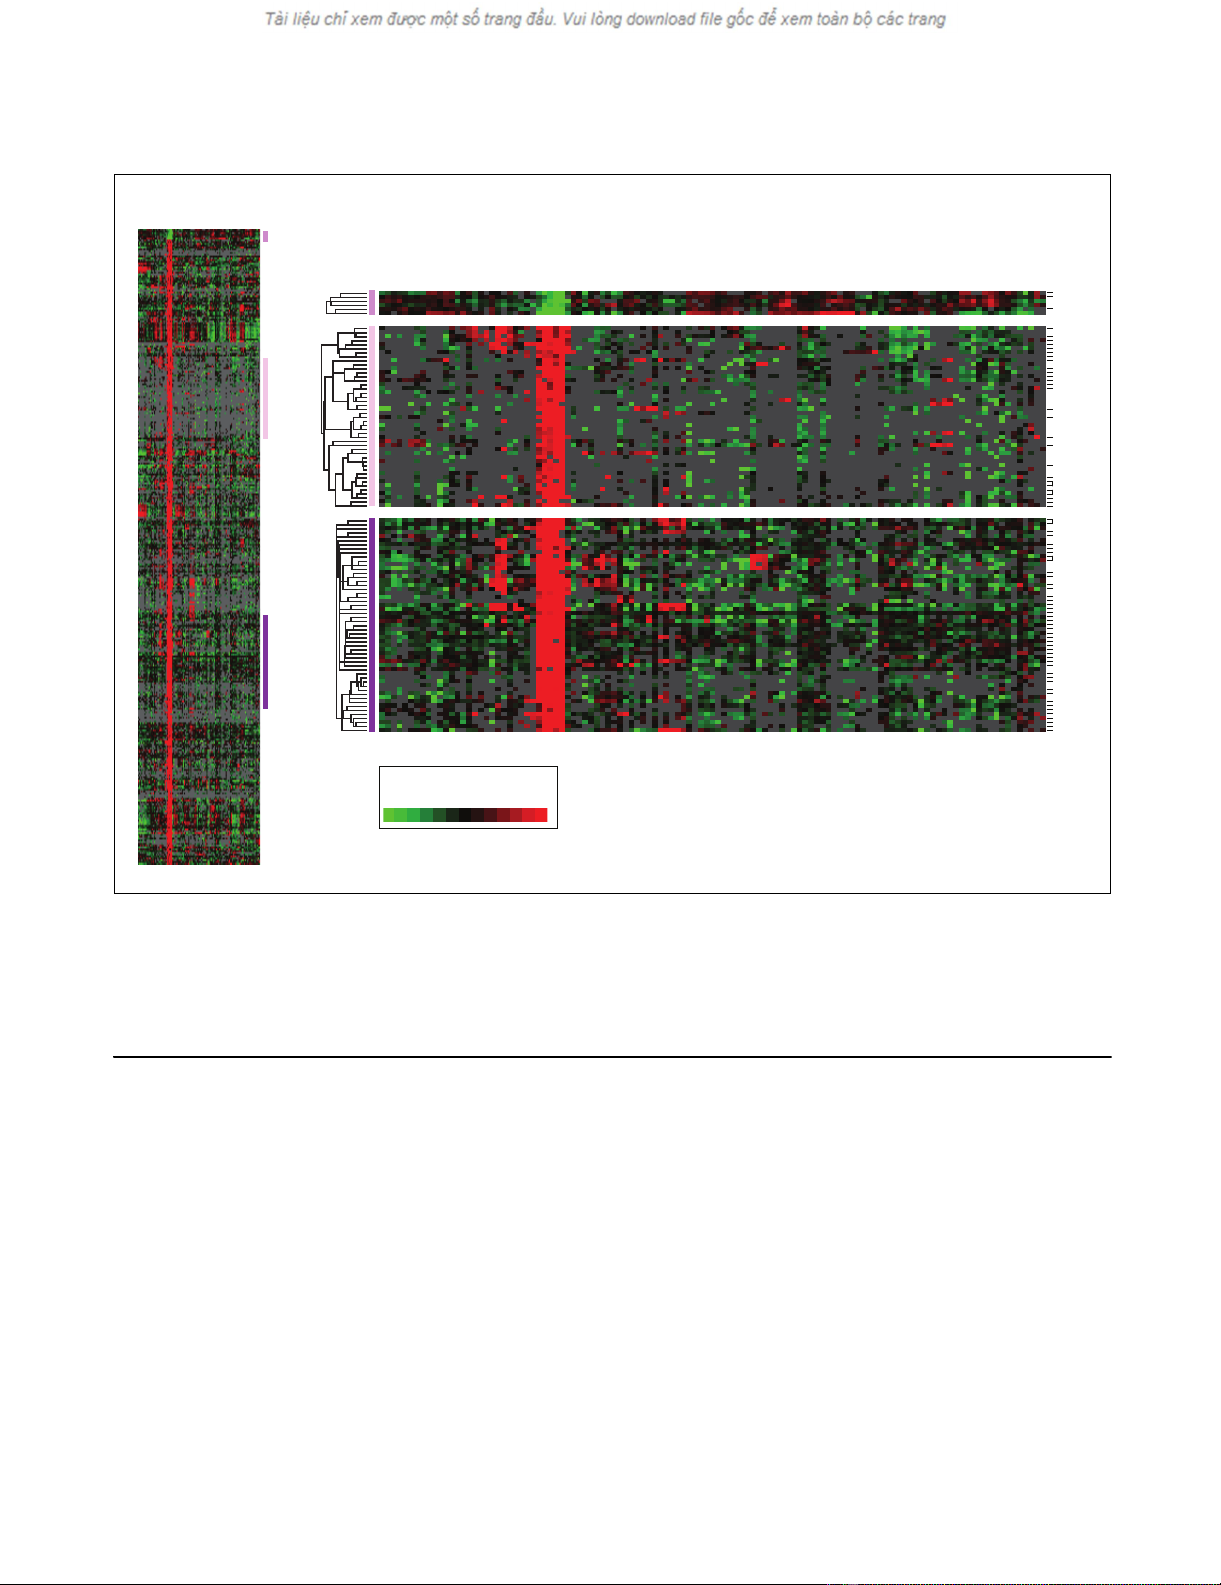
Liver-specific gene expressionFigure 2
Liver-specific gene expression. (a) Thumbnail overview of a hierarchical cluster of 115 normal tissue specimens and 353 variably expressed genes
identified using the SAM method (see Materials and methods) as selectively expressed in liver (false discovery rate = 0.12%). Genes are hierarchically
clustered, while samples are grouped by tissue type and ordered according to anatomical location/function. Mean-centered gene-expression ratios are
depicted by a log2 pseudocolor scale (indicated); samples are color-coded by tissue type. (b-d) Selected gene-expression clusters (locations indicated by
vertical colored bars). Because of space limitations, only named genes (and not expressed sequence tags (ESTs)) are indicated. Tissue-specific genes
identified for other tissues are available as Additional data files 3 and 6.
Brain, frontal cortex 2271
Brain, frontal cortex 2273
Brain, frontal cortex 2272
Brain, temporal cortex 2273
Brain, temporal cortex 2272
Brain, occipital cortex 2271
Brain, occipital cortex 2273
Brain, occipital cortex 2272
Salivary gland, parotid 0493
Salivary gland, parotid 1762
Salivary gland, parotid 0396
Salivary gland, parotid 0506
Esophagus 0331
Esophagus 0022
Esophagus 0406
Stomach, body 0328
Stomach, body 0468
Stomach, fundus 0878
Stomach, pylorus 2173
Small bowel, duodenum 0825
Small bowel, duodenum 2174
Small bowel, ileum 0359
Colon, ascending 0222
Colon 2075
Colon, sigmoid 0361
Pancreas 0432
Pancreas 2650
Liver 0560
Liver 0586
Liver 0032
Liver 1267
Liver 1274
Gallbladder 2131
Breast, lactating 0162
Pericardium 0465
Heart 0024
Heart 0559
Heart 0477
Heart 0841
Heart 0980
Heart 2869
Muscle, abdominal 0031
Muscle, right calf 0315
Diaphragm 0366
Lung 1356
Lung 1351
Lung 0221
Lung 0330
Kidney 0265
Kidney 0088
Kidney 1651
Kidney 0226
Kidney 1594
Bladder 1004
Bladder 1678
Prostate 0782
Prostate 0805
Prostate 0845
Prostate 1277
Prostate 1045
Seminal vesicle 0235
Seminal vesicle 0233
Seminal vesicle 0234
Epididymus 2125
Testes 0553
Testes 1068
Testes 1853
Ovary 0408
Ovary 0466
Ovary 1080
Ovary 0538
Ovary 0314
Fallopian tube 065A
Fallopian tube 065B
Fallopian tube 2386
Fallopian tube 2184
Uterus, endomyometrium 0126
Uterus, endomyometrium 002B
Uterus, endomyometrium 0002
Uterus, endomyometrium 0158
Uterine corpus, myometriun 1205
Cervix, endo cervical canal 1200
Cervix 2385
Cervix 2209
Vagina 0304
Placenta 2876
Thyroid 0029
Thyroid 0555
Thyroid 3077
Thyroid 0182
Thyroid 0838
Thyroid 1193
Parathyroid 2995
Parathyroid 0499
Parathyroid 1748
Adrenal 0558
Adrenal 0433
Adrenal 1354
Adrenal 1111
Lymph node 2096
Lymph node, axillary 1187
Lymph node, axillary 0936
Lymph node 0599
Lymph node 1337
Tonsil 2852
Tonsil 3011
Tonsil 1428
Tonsil 1398
Thymus 0035
Thymus 0512
Spleen 0125
Spleen 0405
Spleen 0089
Buffycoat 3642
Buffycoat 3643
(b)
(c)
(d)
(a)
2
4
>8
0.5
0.25
<0.125
1
CYP3A7
CYP3A5P2
CYP2C9
TM4SF4
MTP
HSD17B2
GC
FMO3
BAAT
PROZ
APOC4
SDS
FGB
LEAP-2
CPB2
ALDH8A1
CYP4F3
FRCP1
SF3B1
WAC
KAISO-L1
ANGPTL3
NPC1L1
SERPINA1
HPD
OTC
GCKR
NR0B2
APOM
HPD
TFR2
POLR2J2
CPS1
PRODH2
APOA1
LEAP-2
APOA2
APOB
TM4SF5
SLC38A4
LBP
ALDOB
FABP1
TRRAP
APCS
APOC2
SCAND1
ATF5
F2
FGB
CP
ASGR1
HAL
C8A
RBP4
SLC4A3
LEAP-2
ARG1
HPX
FOXA2
SERPINF2
SERPINA6
CYP2D6
THPO
ITIH4
CYP8B1
SLC22A1
HAAO
PAH
http://genomebiology.com/2005/6/3/R22 Genome Biology 2005, Volume 6, Issue 3, Article R22 Shyamsundar et al. R22.5
comment reviews reports refereed researchdeposited research interactions information
Genome Biology 2005, 6:R22
normal genomic DNA, would then approximate transcript
abundance. To test our approach, we compared our estimates
of transcript levels for a single prostate specimen, calculated
either indirectly using the common reference mRNA versus
genomic DNA ratios, or calculated through a direct hybridiza-
tion comparison of prostate sample mRNA versus normal
female genomic DNA. Our results show high concordance for
the prostate sample (Figure 4a); comparable results were
obtained in a similar analysis using liver, breast, heart and
kidney specimens (data not shown).
The utility of this approach is illustrated for the cluster of
prostate-specific genes (derived from the hierarchical cluster
in Figure 1), and is evident on comparing results depicting the
relative level of each gene's expression in different samples
(Figure 4b), and the relative levels of transcripts for different
genes (Figure 4c). While all genes within the prostate-specific
cluster were expressed at relatively increased levels in pros-
tate compared with other tissues, estimates of transcript
abundance indicated that only a subset of these genes was
highly expressed in the prostate (Figure 4c). For example,
RDH11 was highly expressed in prostate and was expressed at
lower levels in other tissues, while STEAP2 was expressed at
low levels in prostate and displayed very little or no expres-
sion in other tissues. For each of the tissue types, transcripts
identified as both highly abundant and tissue specific are
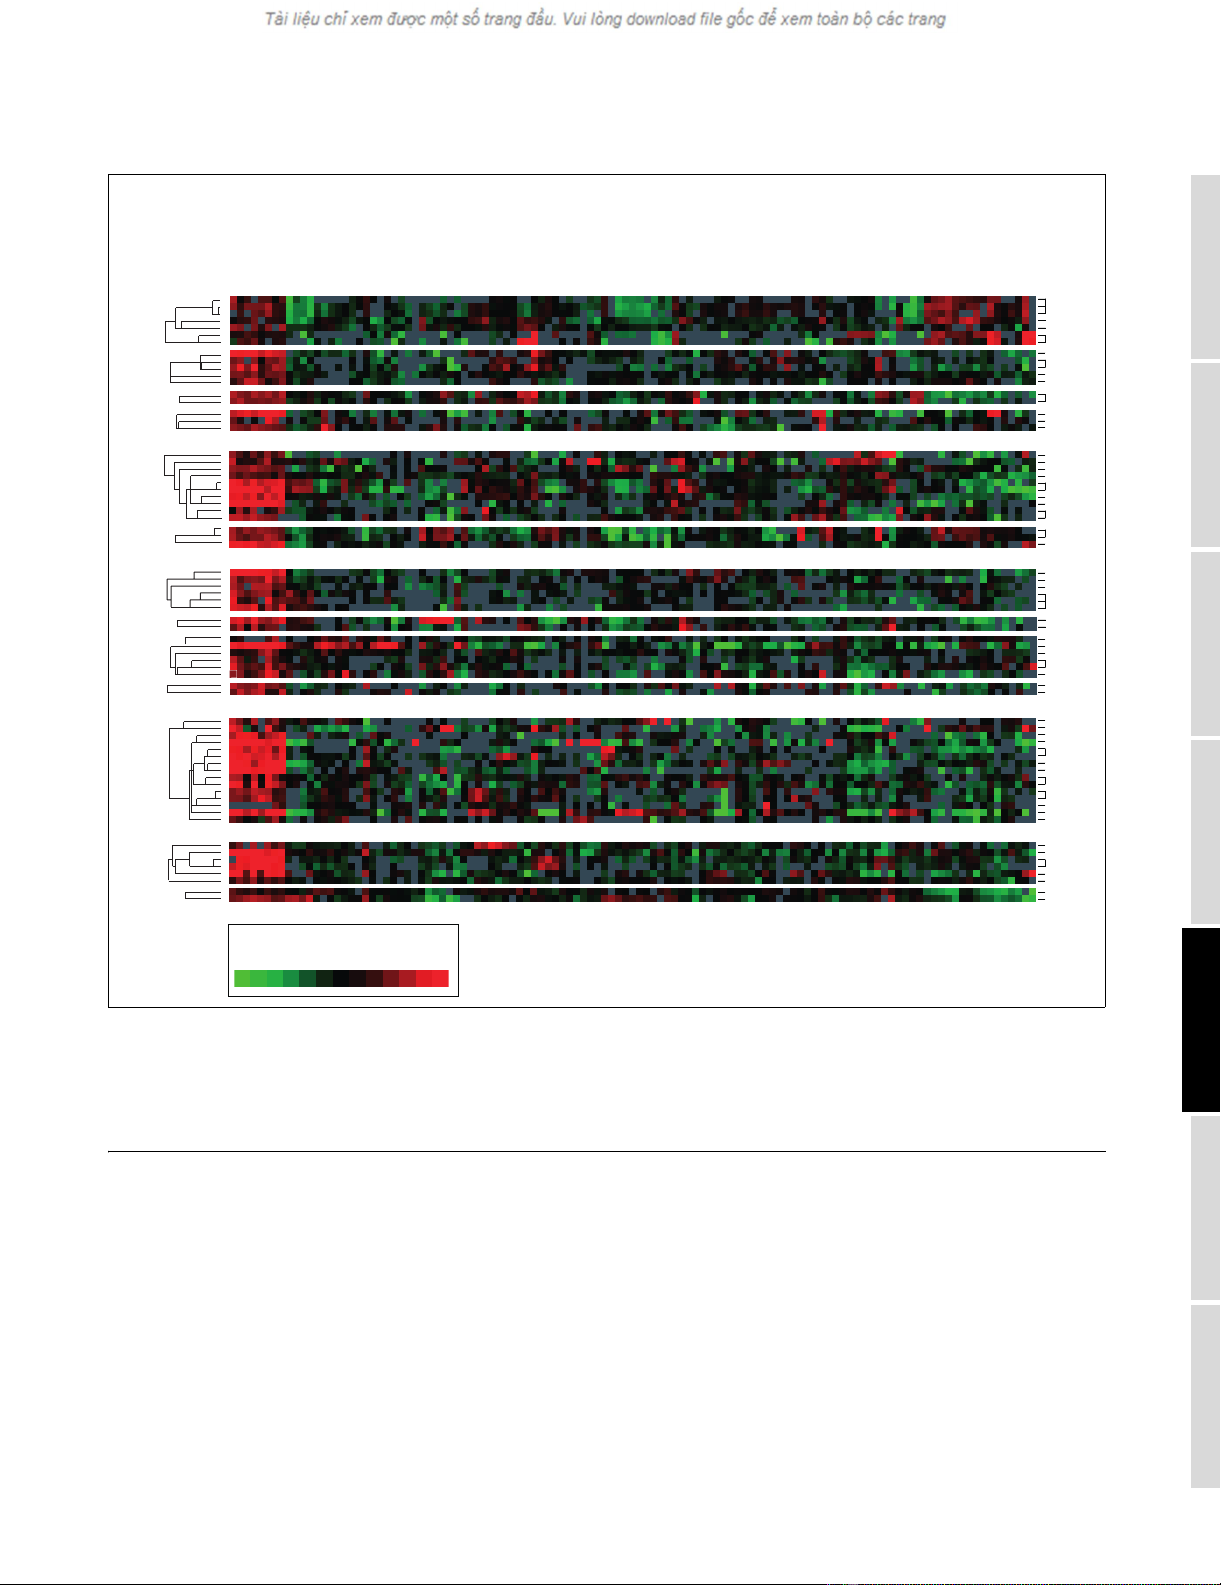
Brain-selective expression of functionally annotated gene setsFigure 3
Brain-selective expression of functionally annotated gene sets. Hierarchical cluster of 115 normal tissue specimens and annotated gene sets representing
the following examples of (a-c) specific molecular functions (a) tyrosine kinase, (b) G-protein-coupled receptor, (c) transcription factor, (d) cellular
components (extracellular matrix) or (e) biological processes (programmed cell death). Samples are ordered as in Figure 2. Genes are ordered by
hierarchical clustering. For gene selection, we considered genes that were well measured in at least 50% of samples; no ratio-fold cutoff was applied. Only
features representing brain-specific expression are shown here; the complete clusters are available as Additional data files 4 and 7.
COL9A2
CHI3L1
PCLO
SPP1
DTNA
SYT11
SYP
VAMP2
COL5A3
MMP10
SPOCKan
MMP24
Brain, frontal cortex 2271
Brain, frontal cortex 2273
Brain, frontal cortex 2272
Brain, temporal cortex 2273
Brain, temporal cortex 2272
Brain, occipital cortex 2271
Brain, occipital cortex 2273
Brain, occipital cortex 2272
Salivary gland, parotid 0493
Salivary gland, parotid 1762
Salivary gland, parotid 0396
Salivary gland, parotid 0506
Esophagus 0331
Esophagus 0022
Esophagus 0406
Stomach, body 0328
Stomach, body 0468
Stomach, fundus 0878
Stomach, pylorus 2173
Small bowel, duodenum 0825
Small bowel, duodenum 2174
Small bowel, ileum 0359
Colon, ascending 0222
Colon 2075
Colon, sigmoid 0361
Pancreas 0432
Pancreas 2650
Liver 0560
Liver 0586
Liver 0032
Liver 1267
Liver 1274
Gallbladder 2131
Breast, lactating 0162
Pericardium 0465
Heart 0024
Heart 0559
Heart 0477
Heart 0841
Heart 0980
Heart 2869
Muscle, abdominal 0031
Muscle, right calf 0315
Diaphragm 0366
Lung 1356
Lung 1351
Lung 0221
Lung 0330
Kidney 0265
Kidney 0088
Kidney 1651
Kidney 0226
Kidney 1594
Bladder 1004
Bladder 1678
Prostate 0782
Prostate 0805
Prostate 0845
Prostate 1277
Prostate 1045
Seminal vesicle 0235
Seminal vesicle 0233
Seminal vesicle 0234
Epididymus 2125
Testes 0553
Testes 1068
Testes 1853
Ovary 0408
Ovary 0466
Ovary 1080
Ovary 0538
Ovary 0314
Fallopian tube 065A
Fallopian tube 065B
Fallopian tube 2386
Fallopian tube 2184
Uterus, endomyometrium 0126
Uterus, endomyometrium 002B
Uterus, endomyometrium 0002
Uterus, endomyometrium 0158
Uterine corpus, myometriun 1205
Cervix, endo cervical canal 1200
Cervix 2385
Cervix 2209
Vagina 0304
Placenta 2876
Thyroid 0029
Thyroid 0555
Thyroid 3077
Thyroid 0182
Thyroid 0838
Thyroid 1193
Parathyroid 2995
Parathyroid 0499
Parathyroid 1748
Adrenal 0558
Adrenal 0433
Adrenal 1354
Adrenal 1111
Lymph node 2096
Lymph node, axillary 1187
Lymph node, axillary 0936
Lymph node 0599
Lymph node 1337
Tonsil 2852
Tonsil 3011
Tonsil 1428
Tonsil 1398
Thymus 0035
Thymus 0512
Spleen 0125
Spleen 0405
Spleen 0089
Buffycoat 3642
Buffycoat 3643
GPR27
GPR56
GPR
GPR44
GPRC5B
SORT1
CELSR2
EDG2
OPN3
GRM3
CASP7
S100B
PRKCE
SNCA
NCKAP1
ARNT2
TCEA2
TULP4
LMO4
HMX1
HR
NFIA
PURA
THG-1
NR1D1
SALL2
FYN
MAP4K4
MAP2K1
PRKCQ
ARK54
ARK5
MAP2K4
PINK1
EPHB6
DKFZP434C131
BAG4
BCL2l2
NKX2-5
PAX6
CRKL
FGFR3
2
4
>8
0.5
0.25
<0.125
1
(b)
(a)
(c)
(d)
(e)


![PET/CT trong ung thư phổi: Báo cáo [Năm]](https://cdn.tailieu.vn/images/document/thumbnail/2024/20240705/sanhobien01/135x160/8121720150427.jpg)