
BioMed Central
Page 1 of 12
(page number not for citation purposes)
Comparative Hepatology
Open Access
Research
Overview of the diagnostic value of biochemical markers of liver
fibrosis (FibroTest, HCV FibroSure) and necrosis (ActiTest) in
patients with chronic hepatitis C
Thierry Poynard*, Françoise Imbert-Bismut, Mona Munteanu,
Djamila Messous, Robert P Myers, Dominique Thabut, Vlad Ratziu,
Anne Mercadier, Yves Benhamou and Bernard Hainque
Address: Groupe Hospitalier Pitié-Salpêtrière, 47-83 Boulevard de l'Hôpital, 75651 Paris Cedex 13, France
Email: Thierry Poynard* - tpoynard@teaser.fr; Françoise Imbert-Bismut - Fimbis@aol.com;
Mona Munteanu - mona.munteanu@biopredictive.com; Djamila Messous - Djmessous@hotmail.com; Robert P Myers - rpmyers@ucalgary.ca;
Dominique Thabut - dthabut@libertysurf.fr; Vlad Ratziu - vratziu@teaser.fr; Anne Mercadier - anne.mercadier@psl.ap-hop-paris.fr;
Yves Benhamou - ybenhamou@teaser.fr; Bernard Hainque - bernard.hainque@psl.ap-hop-paris.fr
* Corresponding author
Summary
Background: Recent studies strongly suggest that due to the limitations and risks of biopsy, as well as the improvement of the
diagnostic accuracy of biochemical markers, liver biopsy should no longer be considered mandatory in patients with chronic
hepatitis C. In 2001, FibroTest ActiTest (FT-AT), a panel of biochemical markers, was found to have high diagnostic value for
fibrosis (FT range 0.00–1.00) and necroinflammatory histological activity (AT range 0.00–1.00). The aim was to summarize the
diagnostic value of these tests from the scientific literature; to respond to frequently asked questions by performing original new
analyses (including the range of diagnostic values, a comparison with other markers, the impact of genotype and viral load, and
the diagnostic value in intermediate levels of injury); and to develop a system of conversion between the biochemical and biopsy
estimates of liver injury.
Results: A total of 16 publications were identified. An integrated database was constructed using 1,570 individual data, to which
applied analytical recommendations. The control group consisted of 300 prospectively studied blood donors. For the diagnosis
of significant fibrosis by the METAVIR scoring system, the areas under the receiver operating characteristics curves (AUROC)
ranged from 0.73 to 0.87. For the diagnosis of significant histological activity, the AUROCs ranged from 0.75 to 0.86. At a cut
off of 0.31, the FT negative predictive value for excluding significant fibrosis (prevalence 0.31) was 91%. At a cut off of 0.36, the
ActiTest negative predictive value for excluding significant necrosis (prevalence 0.41) was 85%. In three studies there was a
direct comparison in the same patients of FT versus other biochemical markers, including hyaluronic acid, the Forns index, and
the APRI index. All the comparisons favored FT (P < 0.05). There were no differences between the AUROCs of FT-AT
according to genotype or viral load. The AUROCs of FT-AT for consecutive stages of fibrosis and grades of necrosis were the
same for both moderate and extreme stages and grades. A conversion table was constructed between the continuous FT-AT
values (0.00 to 1.00) and the expected semi-quantitative fibrosis stages (F0 to F4) and necrosis grades (A0 to A3).
Conclusions: Based on these results, the use of the biochemical markers of liver fibrosis (FibroTest) and necrosis (ActiTest)
can be recommended as an alternative to liver biopsy for the assessment of liver injury in patients with chronic hepatitis C. In
clinical practice, liver biopsy should be recommended only as a second line test, i.e., in case of high risk of error of biochemical
tests.
Published: 23 September 2004
Comparative Hepatology 2004, 3:8 doi:10.1186/1476-5926-3-8
Received: 26 March 2004
Accepted: 23 September 2004
This article is available from: http://www.comparative-hepatology.com/content/3/1/8
© 2004 Poynard et al; licensee BioMed Central Ltd.
This is an open-access article distributed under the terms of the Creative Commons Attribution License (http://creativecommons.org/licenses/by/2.0),
which permits unrestricted use, distribution, and reproduction in any medium, provided the original work is properly cited.

Comparative Hepatology 2004, 3:8 http://www.comparative-hepatology.com/content/3/1/8
Page 2 of 12
(page number not for citation purposes)
Background
One of the major clinical problems is how to best evaluate
and manage the increasing numbers of patients infected
with the hepatitis C virus (HCV) [1]. Liver biopsy is still
recommended in most patients [2,3]. However, numer-
ous studies strongly suggest that due to the limitations [4-
6] and risks of biopsy [7], as well as the improvement of
the diagnostic accuracy of biochemical markers [8,9], liver
biopsy should no longer be considered mandatory.
Among the non-invasive alternatives to liver biopsy [10],
several studies have demonstrated the predictive value of
two combinations of simple serum biochemical markers
in patients infected with HCV: FibroTest (FT; Biopredic-
tive, Paris, France; HCV-Fibrosure, Labcorp, Burlington,
USA) for the assessment of fibrosis; and ActiTest (AT; Bio-
predictive, Paris, France) for the assessment of necroin-
flammatory activity (necrosis) [8,9,11-21]. Similar results
have not been obtained with other diagnostic tests [10-
17]. Since September 2002 these tests (FT-AT) have been
used in several countries as an alternative to liver biopsy.
In a recent systematic review, it was concluded that these
panels of tests might have the greatest value in predicting
fibrosis or cirrhosis [10]. It was also stated that biochemi-
cal and serologic tests were best at predicting no or mini-
mal fibrosis and at predicting advanced fibrosis/cirrhosis,
and were poor at predicting intermediate levels of fibrosis
[10].
The aim of this study was to summarize the diagnostic
value of these tests by an overview of the scientific litera-
ture and to respond to the following frequently asked
questions by performing original new analyses: 1) what is
the range of the FT-AT diagnostic values across the differ-
ent studies? 2) What are the base evidence comparisons
between FT-AT and other published biochemical markers?
3) Are there differences in diagnostic values according to
HCV genotype or viral load? 4) Are there differences
between the FT-AT diagnostic values according to stages
and grades? – In other words, is FT better at predicting no
or minimal fibrosis (F0 vs F1) or advanced fibrosis/cirrho-
sis (F3 vs F4) than at predicting intermediate levels of
fibrosis (F1 vs F2)? And 5) what is the conversion between
FT-AT results and the corresponding fibrosis stages and
necrosis grades?
Results
Analysis of the literature
Between February 2001 and March 2004, a total of 16
publications [8,9,11-21,24-26] and 4 abstracts [27-30]
without corresponding publications were identified.
Diagnostic value of FT-AT among published studies
For 12 groups of patients detailed in 6 publications
[8,11,12,14,19,26], it was possible to assess the preva-
lence of significant fibrosis and the FT area under receiver
operating characteristics curve (AUROC) values, as well as
the sensitivity and specificity for the 4 different FT cut offs
(Table 1). For the diagnosis of significant fibrosis by the
METAVIR scoring system, the AUROC ranged from 0.73
to 0.87, significantly different from random diagnosis in
each study (Table 1), in meta-analysis (mean difference in
AUROC = 0.39, random effect model Chi-square = 529, P
< 0.001) (Figure 1, upper panel), or after pooling data in
the integrated database (Table 2). For the cut off of 0.31,
the FibroTest negative predictive value for excluding sig-
nificant fibrosis (prevalence 0.31) was 91% (Table 2).
For four groups of patients detailed in two publications
[8,11], it was possible to assess the prevalence of signifi-
cant necrosis and the AT AUROC values, as well as the sen-
sitivity and specificity for 4 different AT cut offs (Table 3).
For the diagnosis of significant necrosis by the METAVIR
scoring system, the AUROC ranged from 0.75 to 0.86, sig-
nificantly different from random diagnosis in each study
(Table 3), in meta-analysis (mean difference in AUROC =
0.29, random effect model Chi-square = 556, P < 0.001),
or after pooling data in the integrated database (Table 4).
For the cut off of 0.36, the ActiTest negative predictive
value for excluding significant necrosis (prevalence 0.41)
was 85% (Table 2).
Comparison of FT-AT diagnostic values with other
biochemical markers
In four studies there was a direct comparison in the same
patients of FT versus other biochemical markers, including
hyaluronic acid [12], the Forns index [16], the APRI index
[17] and the GlycoCirrhoTest [26]. All the comparisons
were in favor of FT (Table 1) (Figure 1, lower panel),
except for the GlycoCirrhoTest, which has a similar
AUROC (0.87 vs 0.89 for FT) [26].
Integrated database
A total of 1,570 subjects were included in the integrated
database. Of these, 1,270 were patients with chronic hep-
atitis C who tested PCR positive before treatment and who
had had a liver biopsy and METAVIR staging and grading
performed. Of these patients, 453 were from our center
[11,14], including 130 patients coinfected with HCV and
HIV [14]. Eight hundred and seventy (870) patients were
from a multicentre study with a total of 398 patients
assessed at inclusion and 419 at the end of follow-up six
months after treatment; 352 being investigated twice.
Three hundred (300) healthy blood donors were also
included [20].
Diagnostic value of FT-AT according to HCV genotype and
viral load
There was no difference between the AUROC of FT-AT for
the diagnosis of significant fibrosis (F2F3F4) (Figure 2A)

Comparative Hepatology 2004, 3:8 http://www.comparative-hepatology.com/content/3/1/8
Page 3 of 12
(page number not for citation purposes)
Table 1: Summary of the diagnostic value of FibroTest for the staging of hepatic fibrosis and comparisons with hyaluronic acid, the Forns
Index and the APRI Index in patients with chronic hepatitis C, from the published studies.
First author N* Methodology Marker Stage/
Prevalence
AUROC SE Cut off Sensitivity Specificity
Imbert-Bismut,
2001
189 Prospective
Single center
First year cohort
FibroTest F2F3F4 / 0.38 0.84 (0.03) 0.10
0.30
0.60
0.80
0.97
0.79
0.51
0.29
0.24
0.65
0.94
0.95
Imbert-Bismut,
2001
134 Prospective
Single center
Validation cohort
FibroTest F2F3F4 / 0.45 0.87 (0.03) 0.10
0.30
0.60
0.80
1.00
0.87
0.70
0.38
0.22
0.59
0.95
0.97
Poynard, 2001 165 Retrospective
Randomized trial
Multicenter
FibroTest F3F4 Knodell / 0.32 0.74 (0.03) 0.10
0.30
0.60
0.80
0.96
0.81
0.50
0.13
0.24
0.65
0.92
0.98
Poynard, 2001 165 Retrospective
Randomized trial
Multicenter
Hyaluronic F3F4 Knodell / 0.32 0.65 (0.03) 20
40
100
0.81
0.47
0.23
0.39
0.65
0.91
Poynard, 2003 352 Retrospective
Randomized trial
Multicenter
Before treatment
FibroTest F2F3F4 / 0.39 0.73 (0.03) 0.10
0.30
0.60
0.80
0.97
0.86
0.50
0.20
0.08
0.45
0.79
0.95
Poynard, 2003 352 Retrospective
Randomized trial
Multicenter
After treatment
FibroTest F2F3F4 / 0.32 0.77 (0.03) 0.10
0.30
0.60
0.80
0.98
0.85
0.46
0.16
0.15
0.39
0.81
0.97
Rossi, 2003 125 Prospective
Multicenter
Non-validated analyzers
FibroTest F2F3F4 / 0.38 0.74 (0.05) 0.10
0.30
0.60
0.80
0.92
0.75
0.42
0.22
0.29
0.61
0.94
0.96
Myers, 2003 130 Retrospective
Single center
HCV-HIV Co-infection
FibroTest F2F3F4 / 0.45 0.86 (0.04) 0.10
0.30
0.60
0.80
0.98
0.90
0.66
0.34
0.17
0.60
0.92
0.96
Thabut, 2003 249 Retrospective
Single center
From Imbert-Bismut, 2001
FibroTest F2F3F4 / 0.38 0.84 (0.02) 0.10
0.30
0.60
0.80
0.98
0.84
0.58
0.29
0.22
0.65
0.93
0.95
Thabut, 2003 249 Retrospective
Single center
From Imbert-Bismut, 2001
Forns Index F2F3F4 / 0.38 0.78 (0.03) 1
3
6
8
1.00
1.00
0.55
0.19
0.04
0.26
0.86
0.97
Le Calvez, 2004 323 Retrospective
Single center
From Imbert-Bismut, 2001
FibroTest F2F3F4 / 0.41 0.83 (0.02) 0.10
0.30
0.60
0.80
0.97
0.81
0.58
0.33
0.30
0.66
0.93
0.95
Le Calvez, 2004 323 Retrospective
Single center
From Imbert-Bismut, 2001
APRI Index F2F3F4 / 0.41 0.74 (0.03) 0.50
1.00
1.50
2.00
0.81
0.54
0.36
0.24
0.56
0.84
0.91
0.95
Callewaert, 2004 82 Prospective FibroTest F4 / 0.29 0.89 (0.04) 0.10
0.30
0.60
0.80
1.00
0.92
0.79
0.67
0.33
0.62
0.81
0.92
Callewaert, 2004 82 Prospective Glyco Cirrho
Test
F4 ** / 0.29 0.87 (0.04) -0.2
0.1
0.4
0.6
1.00
0.79
0.21
0.17
0.12
0.88
0.95
1.00
* Number of patients. ** Compensated
Comparative Hepatology 2004, 3:8 http://www.comparative-hepatology.com/content/3/1/8
Page 4 of 12
(page number not for citation purposes)
and significant necrosis (A2A3) (Figure 2B) between 4
classes of genotype (1, 2, 3 and the rarer genotypes 4, 5, 6
grouped together). There was also no difference between
the AUROC of FT-AT of patients with high or low viral
loads for the diagnosis of significant fibrosis (Figure 2C)
or significant necrosis (Figure 2D).
Diagnostic value of FT according to the independency of
authors
Among the 13 published studies of FT (detailed in Table
1), 9 studies estimated FT and 4 studies compared FT to
other non-invasive tests. Among the 9 studies estimating
FT, 5 were performed by the same single center (non-inde-
pendent center), two were performed in totally independ-
ent centers, and two were performed in multiple centers,
including the non-independent center. The AUROCs for
the diagnosis of F2F3F4 versus random AUROCs at 0.50,
were all significant and similar between these 3 groups in
a meta-analysis: mean difference in AUROC = 0.29 (ran-
dom effect model Chi-square = 549, P < 0.001), including
0.24 for independent, 0.25 for mixed and 0.36 for
dependent studies. In the Callewaert et al. [26] study the
AUROC of FT for the diagnosis of F4 was 0.89.
Diagnostic value of FT-AT according to stage and grade
The AUROCs between different stage combinations are
given in Table 5. Between two contiguous stages (one
stage difference), the AUROCs were not significantly
different and ranged from 0.63 to 0.71. Between patients
with a two-stage difference, the AUROCs were not signifi-
cantly different and ranged from 0.75 to 0.86. Between
patients with a three-stage difference, the AUROCs were
not significantly different and ranged from 0.87 to 0.95.
Between patients with a four- or five-stage difference
(blood donors versus F3 or F4, and F0 versus F4), the
AUROCs were not significantly different and ranged from
0.95 to 0.99.
The AUROCs between different grade combinations are
given in Table 6. Between two contiguous grades (one
grade difference), the AUROCs were not significantly dif-
ferent and ranged from 0.60 to 0.70. Between patients
with a two-grade difference, the AUROCs were not signif-
icantly different and ranged from 0.75 to 0.86. Between
patients with a three-grade difference, the AUROCs were
not significantly different and ranged from 0.87 to 0.95.
Between patients with a four-grade difference (blood
donors versus F3 and F0 versus F4), the AUROCs were not
significantly different and ranged from 0.95 to 0.99.
Conversion between FT-AT results and the corresponding
fibrosis stage and grade
FT-AT is a continuous linear biochemical assessment of
fibrosis stage and necroinflammatory activity grade. It
provides a numerical quantitative estimate of liver fibrosis
ranging from 0.00 to 1.00, corresponding to the well-
established METAVIR scoring system of stages F0 to F4
and of grades A0 to A3. Among the 300 controls, the
median FT value (± SE) was 0.08 ± 0.004 (95th percentile,
0.23) and the median AT value was 0.07 ± 0.004 (95th per-
centile, 0.26). Among the 1,270 HCV-infected patients,
the FT conversion was 0.000 – 0.2100 for F0; 0.2101 –
0.2700 for F0–F1; 0.2701 – 0.3100 for F1; 0.3101 –
0.4800 for F1–F2; 0.4801 – 0.5800 for F2; 0.5801 –
0.7200 for F3; 0.7201 – 0.7400 for F3–F4; and 0.7401 –
1.00 for F4. (Figure 3A). The AT conversion was 0.00 –
0.1700 for A0; 0.1701 – 0.2900 for A0–A1; 0.2901 –
0.3600 for A1; 0.3601 – 0.5200 for A1–A2; 0.5201 –
0.6000 for A2; 0.6001 – 0.6200 for A2–A3; and 0.6201 –
1.00 for A3 (Figure 3B). The conversions are summarized
in Figure 4.
Discussion
Based on the limitations of liver biopsy and the present
overview of the diagnostic value of FT-AT, it seems that
these non-invasive markers should be used as a first line
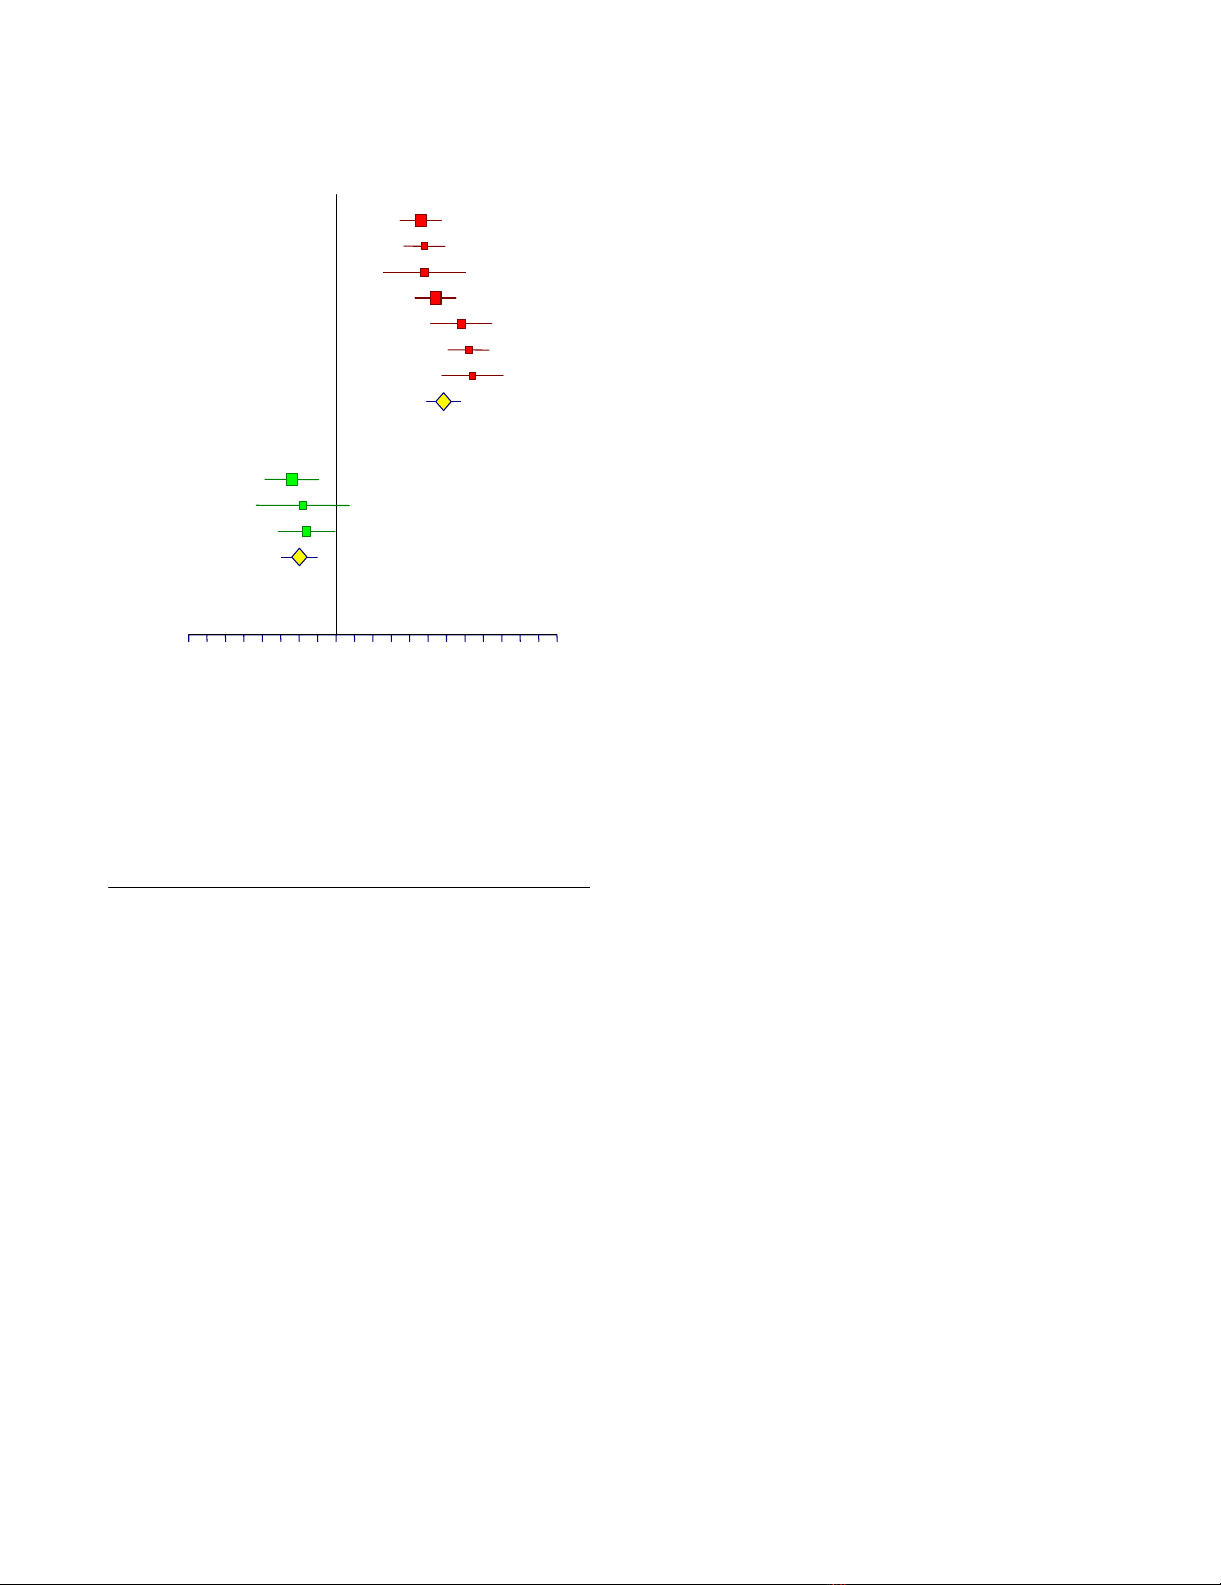
Meta-analysis of the AUROC observed in published studies of FibroTest diagnostic valueFigure 1
Meta-analysis of the AUROC observed in published
studies of FibroTest diagnostic value. AUROCs were
all significantly higher for FibroTest than the random 0.50
value (upper panel) (P < 0.001). AUROCs of FibroTest were
significantly higher then AUROCs of other fibrosis markers
(lower panel) (P < 0.05).
-0.4 -0.2 0.1 0.4 0.6
Mean difference between AUROC
A
U
T
H
O
R
FibroTest vs random
Po
y
nard, 2003
Rossi, 2003
Poynard, 2001
Poynard, 2003
Imbert, 2001
Myers, 2003
Imbert-Bismut, 2001
Avera
g
e
Other vs FibroTest
Apri Index
Hyaluronic Acid
Forns Index
Average

Comparative Hepatology 2004, 3:8 http://www.comparative-hepatology.com/content/3/1/8
Page 5 of 12
(page number not for citation purposes)
assessment of liver injury in patients with chronic hepati-
tis C.
Liver biopsy has three major limitations, which are the
risk of adverse events [2,3,7], sampling error [4-6], and
Table 2: Integrated database, with predictive values for significant hepatic fibrosis according to METAVIR conversion cut offs. Derived
from published studies.
Integrated
database
Patient
number
Marker Stage/
Prevalence
AUROC
(SE)
Cut off
used for
METAVIR
stages
conversion
Sensitivity Specificity Negative
predictive
value
Positive
predictive
value
With Blood
Donors
1,570 FibroTest F2F3F4/0.31 0.83 (0.01) 0.21 0.92 0.55 0.94 0.48
0.27 0.87 0.62 0.92 0.51
0.31 0.84 0.68 0.91 0.54
0.48 0.68 0.81 0.85 0.61
0.58 0.56 0.87 0.82 0.67
0.72 0.38 0.95 0.77 0.76
0.74 0.35 0.95 0.76 0.76
0.75 0.33 0.96 0.76 0.78
Without
blood
donors
1,270 FibroTest F2F3F4/0.38 0.78 (0.01) 0.21 0.92 0.41 0.89 0.49
0.27 0.87 0.48 0.86 0.51
0.31 0.84 0.55 0.85 0.54
0.48 0.68 0.73 0.79 0.61
0.58 0.56 0.83 0.75 0.67
0.72 0.38 0.95 0.70 0.76
0.74 0.35 0.93 0.70 0.76
0.75 0.33 0.94 0.69 0.78
Table 3: Summary of the diagnostic value of ActiTest for the diagnosis of necroinflammatory hepatic activity (AUROC) in patients with
chronic hepatitis C, from the published studies.
First
author,
Year
Patient
number
Methodology Marker Grade/
Prevalence
AUROC
(SE)
Cut off Sensitivity Specificity
Imbert-
Bismut, 2001
189 Prospective
Single center
ActiTest A2A3 / 0.33 0.79 (0.03) 0.10
0.30
0.60
0.80
0.99
0.91
0.70
0.49
0.07
0.42
0.75
0.88
Imbert-
Bismut, 2001
134 Prospective
Single center
Validation
cohort
ActiTest A2A3 / 0.28 0.75 (0.03) 0.10
0.30
0.60
0.80
1.00
0.94
0.67
0.42
0.07
0.33
0.65
0.87
Poynard,
2003
352 Retrospective
Randomized
trial
Multicenter
Before
treatment
ActiTest A2A3 / 0.83 0.75 (0.03) 0.10
0.30
0.60
0.80
1.00
0.90
0.49
0.20
0.00
0.38
0.87
0.99
Poynard,
2003
352 Retrospective
Randomized
trial
Multicenter
After treatment
ActiTest A2A3 / 0.39 0.86 (0.02) 0.10
0.30
0.60
0.80
0.91
0.75
0.38
0.14
0.59
0.83
0.98
0.996


