
RESEARCH Open Access
Relationship between daylength and suicide in
Finland
Laura Hiltunen
1*†
, Kirsi Suominen
1,2
, Jouko Lönnqvist
1,3
and Timo Partonen
1†
Abstract
Background: Many previous studies have documented seasonal variation in suicides globally. We re-assessed the
seasonal variation of suicides in Finland and tried to relate it to the seasonal variation in daylength and ambient
temperature and in the discrepancy between local time and solar time.
Methods: The daily data of all suicides from 1969 to 2003 in Finland (N = 43,393) were available. The calendar year
was divided into twelve periods according to the length of daylight and the routinely changing time difference
between sun time and official time. The daily mean of suicide mortality was calculated for each of these periods
and the 95% confidence intervals of the daily means were used to evaluate the statistical significance of the
means. In addition, daily changes in sunshine hours and mean temperature were compared to the daily means of
suicide mortality in two locations during these afore mentioned periods.
Results: A significant peak of the daily mean value of suicide mortality occurred in Finland between May 15th and
July 25th, a period that lies symmetrically around the solstice. Concerning the suicide mortality among men in the
northern location (Oulu), the peak was postponed as compared with the southern location (Helsinki). The daily
variation in temperature or in sunshine did not have significant association with suicide mortality in these two
locations.
Conclusions: The period with the longest length of the day associated with the increased suicide mortality.
Furthermore, since the peak of suicide mortality seems to manifest later during the year in the north, some other
physical or biological signals, besides the variation in daylight, may be involved. In order to have novel means for
suicide prevention, the assessment of susceptibility to the circadian misalignment might help.
Keywords: circadian clock, suicide, light-dark transition, sunshine, temperature
Background
Current data on the routinely occurring peaks of deaths
from suicide are conflicting [1,2]. However, for the past
four decades in Finland, the seasonal pattern has been
strongerthelowerthesuicide mortality has been [3].
There is a clear peak of suicide occurrence around May
or June [4-7] and a preceding peak in suicide attempts
around April [8]. Furthermore, another smaller peak of
suicide occurrence exists around October [7,9]. These
two mortality peaks, being similar and more robust the
further away the country locates from the equator, have
been explained by socio-demographic and socio-eco-
nomic factors [10], but since this seasonal pattern has
existed for decades [11], if not centuries [12], biological
factors are likely.
Major depressive episodes are known to contribute to
suicide substantially [13,14], and a history of mood dis-
orders and psychiatric hospitalization associates clearly
with the seasonal occurrence of suicides [15,16]. Desyn-
chronization of physiological rhythms, e.g. desynchroni-
zation of the circadian rhythm of core body temperature
with the sleep-wake cycle [17-19] and some clock gene
variants [20,21], can be associated with mood disorders.
Based on our earlier psychological autopsy studies of
death from suicide [22] and the data from the nation-
wide suicide program in Finland [23], we hypothesized
that the circadian misalignment among the depressed
* Correspondence: laura.hiltunen@thl.fi
†Contributed equally
1
National Institute for Health and Welfare, Department of Mental Health and
Substance Abuse Services, P.O. Box 30 (Mannerheimintie 166), FI-00271
Helsinki, Finland
Full list of author information is available at the end of the article
Hiltunen et al.Journal of Circadian Rhythms 2011, 9:10
http://www.jcircadianrhythms.com/content/9/1/10
© 2011 Hiltunen et al; licensee BioMed Central Ltd. This is an Open Access article distributed under the terms of the Creative
Commons Attribution License (http://creativecommons.org/licenses/by/2.0), which permits unrestricted use, distribution, and
reproduction in any medium, provided the original work is properly cited.

may increase during spring, and thereby predispose to
suicidal behaviors [24].
Rest-activity cycles during the day [25] and sleep
stages at night [26] are controlled by circadian clocks,
but they are frequently disturbed among the depressed.
Furthermore, the principal circadian clock entrains to
the sun light [27-29], by tracking the daily changes in
rise and set times of the sun and the variation in the
length of the day [30-32]. Thus, the timing of light
exposure is relevant to entrainment and influences the
course of mood disorders [33,34]. Therefore, we
hypothesized that it is the key to the suicide mortality
peaks whether the light-dark transitions give the princi-
pal circadian pacemaker a signal to accelerate or decele-
rate, especially among the depressed. In addition, since
sunshine and ambient temperature are potential time-
givers, modulate the function of biological clocks [35],
and associate with deaths from suicide [3,36], we aimed
to test their effect, as well.
Methods
Statistics Finland http://www.stat.fi provided us with the
daily data of 43,393 suicides, 33,993 of men and 9400
(22%) of women, committed in Finland during the 35-year
period of 1969 to 2003 (Tables 1 and 2). Two phenomena,
which affect the timing and the speed of the light-dark
transitions regularly each year, were selected a priori as
the potential factors that might challenge the biological
clocks and produce circadian misalignment. First, we
focused on the length of the photoperiod, because at high
to temperate latitudes around spring and fall equinoxes
the transitions between day and night are most rapid and
the durations of twilight short, as a consequence of the
rotation of the earth. Second, we focused on the constant
mismatch between the sun time (hereafter ST) and the
coordinated universal time (hereafter UCT), arising from
the earth’s tilt and elliptical orbit around the sun.
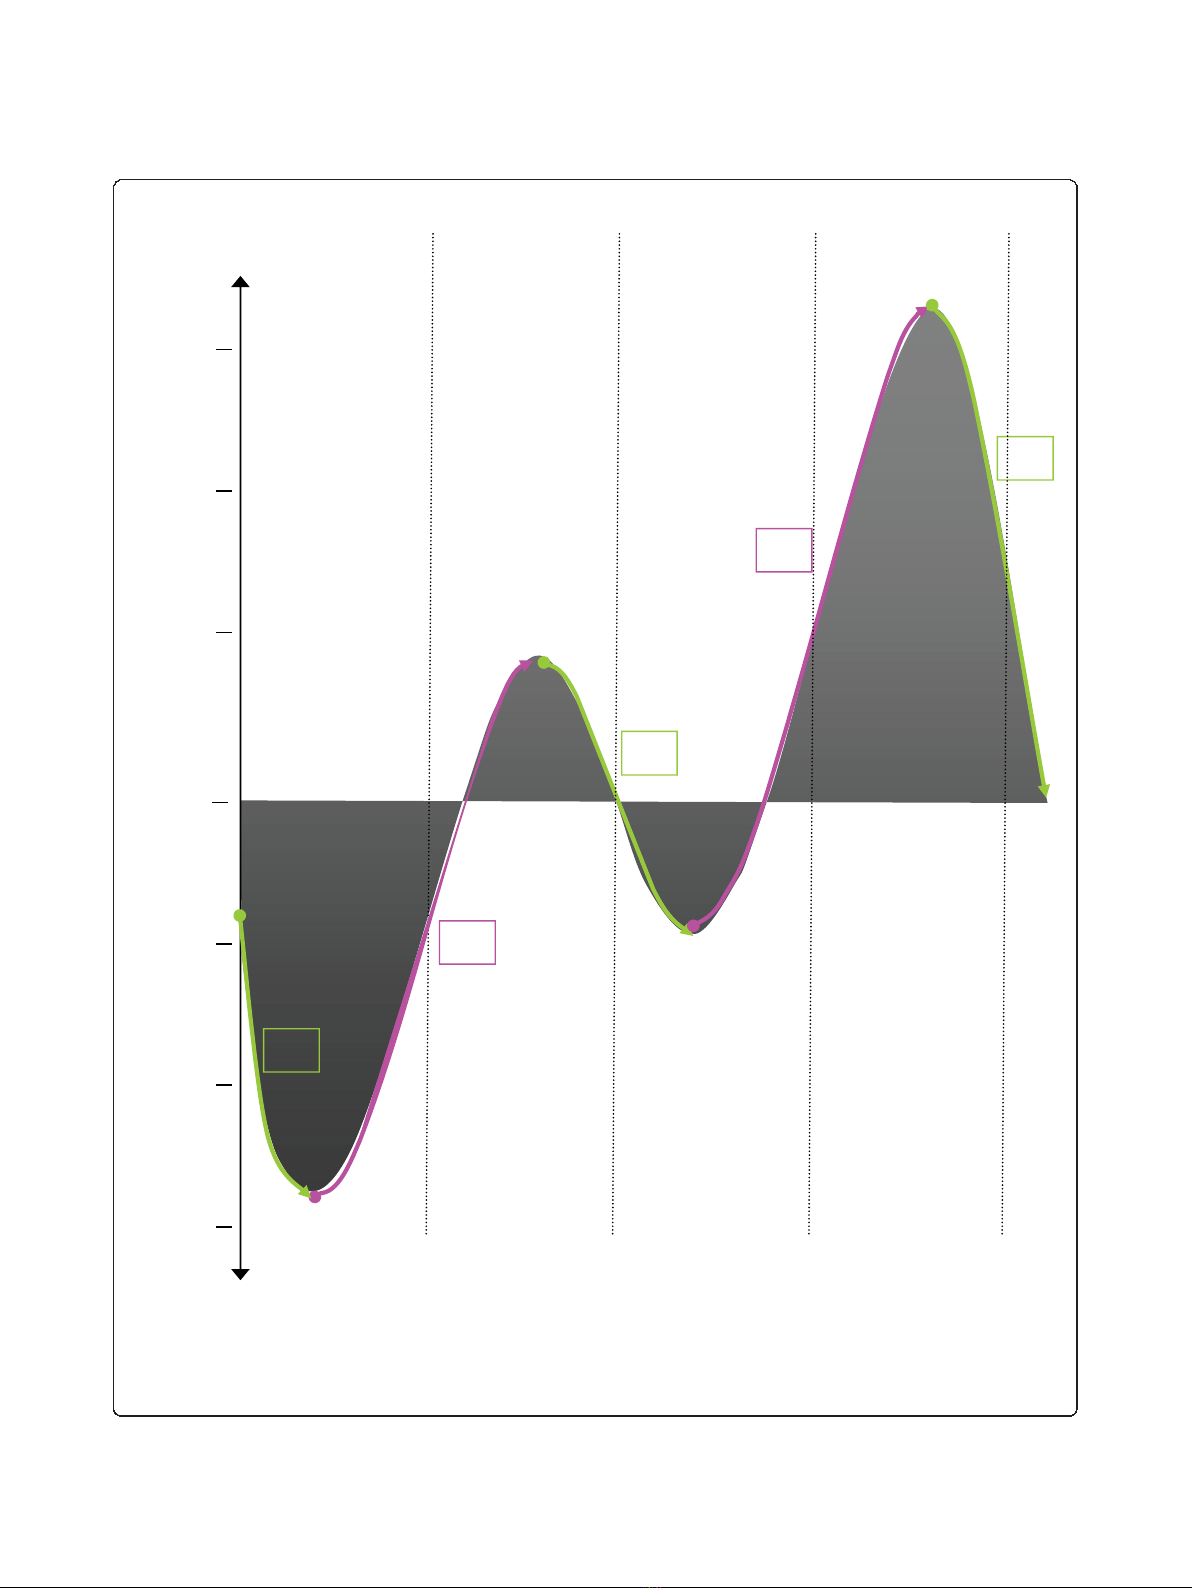
The nominal calendar year was split into twelve peri-
ods according to these two phenomena; first into four
astronomical seasons, which are determined by spring
and fall equinoxes and summer and winter solstices (for
the definition, see http://asa.nao.rl.ac.uk/), and second
into eight periods, by the equation of time (for the defi-
nition, see http://www.nmm.ac.uk/explore/astronomy-
and-time/time-facts/the-equation-of-time), as follows
(see also Figure 1). From February 11
th
to May 14
th
(hereafter marked as X1) and from July 26
th
to Novem-
ber 3
rd
(X2) ST goes fast compared with UCT and in
between those periods, that is, from May 15
th
to July
25
th
(Y1)andfromNovember4
th
to February 10
th
(Y2)
it goes slow. Furthermore, another categorization was
made based on the equation of time separating periods
when ST is either ahead or behind the UCT. In other
words, ST is constantly ahead of the UCT, from April
15
th
to June 13
th
(A1) and from September 1
st
to
December 25
th
(A2), and constantly behind the UCT,
from June 14
th
to August 31
st
(D1), and from December
26
th
to April 14
th
(D2). Hence, ST deviates from UCT
constantly and is maximally behind at February 11
th
(approximately 14 minutes) and vice versa maximally
ahead at November 3
rd
(approximately 16 minutes). The
Almanac Office at the University of Helsinki http://
almanakka.helsinki.fi/ both provided the dates for the
astronomical seasons and calculated the dates for the
Table 1 Men’s suicides in numbers during the study
period
Oulu Helsinki Finland
Year Men S per
100
000
Men S per
100
000
Men S per
100
000
1969 42 447 11 25.92 272 321 110 40.39 2 230 217 850 38.11
1970 41 412 13 31.39 266 174 108 40.58 2 219 985 763 34.37
1971 42 798 11 25.70 271 393 117 43.11 2 234 037 781 34.96
1972 43 436 22 50.65 275 378 132 47.93 2 249 051 874 38.86
1973 44 127 27 61.19 277 205 109 39.32 2 262 142 849 37.53
1974 45 082 22 48.80 278 485 131 47.04 2 273 815 921 40.51
1975 45 815 22 48.02 278 628 128 45.40 2 282 115 924 40.49
1976 46 069 29 62.95 278 693 152 54.54 2 286 392 967 42.29
1977 46 444 22 47.37 277 978 154 55.40 2 295 668 962 41.91
1978 46 609 13 27.89 277 735 156 56.17 2 300 790 963 41.86
1979 46 533 18 38.68 278 569 133 47.74 2 306 784 935 40.53
1980 46 779 24 51.31 279 456 145 51.89 2 314 843 962 41.56
1981 47 343 21 44.36 280 580 151 53.82 2 327 473 904 38.84
1982 48 179 18 37.36 282 751 134 47.39 2 342 869 905 38.63
1983 48 331 25 51.73 284 565 130 45.68 2 357 172 938 39.79
1984 48 620 25 51.42 286 092 149 52.08 2 369 228 988 41.70
1985 49 065 23 46.88 287 858 113 39.26 2 377 780 964 40.54
1986 49 405 30 60.72 290 370 149 51.31 2 385 866 1023 42.88
1987 49 890 28 56.12 292 935 137 46.77 2 392 868 1068 44.63
1988 50 138 44 87.76 294 242 150 50.98 2 401 368 1112 46.31
1989 50 951 29 56.92 295 665 160 54.12 2 412 760 1121 46.46
1990 51 623 33 63.93 298 420 198 66.35 2 426 204 1199 49.42
1991 52 254 35 66.98 302 609 185 61.14 2 443 042 1193 48.83
1992 52 959 36 67.98 306 298 204 66.60 2 457 282 1160 47.21
1993 53 495 35 65.43 311 134 172 55.28 2 470 196 1112 45.02
1994 54 661 23 42.08 316 367 176 55.63 2 481 649 1080 43.52
1995 56 132 26 46.32 322 074 179 55.58 2 491 701 1081 43.38
1996 57 436 26 45.27 327 168 131 40.04 2 500 596 966 38.63
1997 58 482 36 61.56 332 113 158 47.57 2 509 098 1039 41.41
1998 59 606 26 43.62 337 297 121 35.87 2 516 075 965 38.35
1999 61 025 40 65.55 341 125 139 40.75 2 523 026 961 38.09
2000 62 800 28 44.59 344 520 143 41.51 2 529 341 879 34.75
2001 64 116 31 48.35 347 925 150 43.11 2 537 597 936 36.89
2002 64 995 22 33.85 349 121 139 39.81 2 544 916 825 32.42
2003 65 965 29 43.96 350 334 119 33.97 2 552 893 823 32.24
The yearly male population, number of suicides(S), and suicide mortality for
men in Oulu, Helsinki, and Finland from 1969 to 2003.
Hiltunen et al.Journal of Circadian Rhythms 2011, 9:10
http://www.jcircadianrhythms.com/content/9/1/10
Page 2 of 12

periods (X1, Y1, X2, Y2) of the equation of time, as well
as the dates for the periods (A1, D1, A2, D2) through
the whole study period.
To evaluate the effect of daily sunshine hours and
temperature on suicide mortality, we focused on two
cities on a similar longitude but with dissimilar photo-
period:first,Helsinki(60°9.7’N, 24°57.3’E), which is the
capital of Finland in the south, and second, Oulu (65°
1.0’N, 25°30.0’E), which is a central city of the northern
part of the country, 600 km north from Helsinki. In
Helsinki 5062 suicides were committed by men, and
2160 by women, whereas 903 by men and 278 by
women in Oulu. The Finnish Meteorological Institute
http://www.fmi.fi/ provided us with the daily data on
sunshine hours and temperature, measured within the
25-km radius from these cities throughout the study
period. For the day to day analysis, the daily sunshine,
measured in minutes per day, (hereafter S) and the daily
temperature, measured in degrees in Celsius and aver-
aged as the daily mean value, (hereafter T) were com-
pared with those on the previous day and changes were
marked as (+) indicating an increase, and (-) indicating
a decrease from the previous day. Thus, we ended with
four types of days according to weather changes, coded
as T+S+, T+S-, T-S+, and T-S-, concerning the data
from Helsinki and Oulu regions.
In order to take into account the differences in the
yearly population sizes within and between Helsinki and
Oulu, the daily means of suicides were calculated into
daily means of suicide mortality rates (suicides per
100,000), for men and women, per each year, and for
both cities (Tables 1 and 2). Furthermore, in order to
control for the different lengths of each period studied,
and to avoid the bias of having dominance of certain
type of weather changes within any period of the year,
the daily mean of suicide mortalities (number of suicides
per day, with 95% confidence intervals [CIs]) was calcu-
lated for each period in separate (Tables 3, 4, and 5).
Finally, to rule out a potential confounder, we ana-
lyzed whether daylight saving time (hereafter DST) had
any effect on the suicide mortality. DST was introduced
in Finland 1981. From 1981 to 1994 DST lasted from
the end of March until the end of September (hereafter
DST1), and since 1995 DST has been in use from the
end of March until the end of October, as in most parts
of Europe (hereafter DST2). We calculated suicide mor-
tality rates during one month period before, and after
the transitions into and out of DST, separately for the
years 1981 to 1994 (DST1) and years 1995 to 2003
(DST2), for which the suicide mortality rates of the cor-
responding periods during the years 1969 to 1980 were
used as controls (Tables 6, 7, 8, 9,10, and 11).
The 95% CIs of the daily mean values, controlled for
the length of a period of study and the male and female
population sizes in a region of study, were used to eval-
uate the statistical significance, so that if they did not
overlap with each other, it was judged to indicate a
marked statistical significance.
Results
In Finland, during the years 1969 to 2003, the daily
mean of suicide mortality was at the highest, with a sta-
tistical significance, for both men (mean = .124, CI =
.118-.129) and women (mean = .032, CI = .030-.033),
Table 2 Women’s suicides in numbers during the study
period
Oulu Helsinki Finland
Year Women S per
100
000
Women S per
100
000
Women S per
100
000
1969 46 245 5 10.81 333 502 43 12.89 2 384 060 246 10.32
1970 45 656 4 8.76 325 034 58 17.84 2 378 351 220 9.25
1971 46 474 5 10.76 330 205 58 17.57 2 391 875 222 9.28
1972 47 633 5 10.50 333 507 57 17.09 2 404 350 239 9.94
1973 48 302 6 12.42 335 687 60 17.87 2 416 619 249 10.30
1974 49 272 11 22.33 337 470 47 13.93 2 428 572 255 10.50
1975 50 132 5 9.97 337 570 72 21.33 2 438 377 254 10.42
1976 50 410 12 23.81 336 980 66 19.59 2 444 444 253 10.35
1977 50 691 8 15.78 335 057 54 16.12 2 451 299 258 10.53
1978 50 964 11 21.58 334 547 53 15.84 2 457 298 237 9.65
1979 51 188 6 11.72 334 981 60 17.91 2 464 508 242 9.82
1980 51 582 4 7.76 335 630 63 18.77 2 472 935 264 10.68
1981 52 237 1 1.91 336 511 56 16.64 2 484 677 239 9.62
1982 53 059 10 18.85 338 116 59 17.45 2 498 846 267 10.69
1983 53 225 6 11.27 339 108 56 16.51 2 512 686 249 9.91
1984 53 443 3 5.61 340 162 54 15.88 2 524 520 253 10.02
1985 53 976 4 7.41 341 781 58 16.97 2 532 884 249 9.83
1986 54 349 12 22.08 343 576 53 15.43 2 539 778 287 11.30
1987 54 760 10 18.26 346 162 65 18.78 2 545 734 301 11.82
1988 55 125 9 16.33 346 880 62 17.87 2 552 991 296 11.59
1989 55 810 8 14.33 347 226 58 16.70 2 561 623 297 12.59
1990 56 294 8 14.21 348 913 90 25.79 2 572 274 324 11.60
1991 56 735 8 14.10 352 207 74 21.01 2 585 960 306 11.83
1992 57 391 6 10.46 354 429 77 21.73 2 597 700 297 11.43
1993 57 765 6 10.39 358 557 72 20.08 2 607 716 293 11.24
1994 58 781 12 20.42 363 774 77 21.17 2 617 105 307 11.73
1995 60 186 12 19.94 369 437 65 17.59 2 625 125 309 11.77
1996 61 447 8 13.02 373 663 69 18.47 2 631 724 282 10.72
1997 62 439 11 17.62 378 547 68 17.96 2 638 251 284 10.77
1998 63 454 11 17.34 382 880 57 14.89 2 643 571 268 10.14
1999 64 516 13 20.15 386 384 68 17.60 2 648 276 254 9.59
2000 66 149 11 16.63 389 425 66 16.95 2 651 774 292 11.01
2001 67 584 9 13.32 391 649 62 15.83 2 657 304 271 10.20
2002 68 297 11 16.11 392 485 48 12.23 2 661 379 275 10.33
2003 68 878 7 10.16 393 035 55 13.99 2 666 839 261 9.79
The yearly female population, number of suicides(S), and suicide mortality for
women in Oulu, Helsinki, and Finland from 1969 to 2003.
Hiltunen et al.Journal of Circadian Rhythms 2011, 9:10
http://www.jcircadianrhythms.com/content/9/1/10
Page 3 of 12
I II III IV V VI VII VIII IX X XI XII
S
un time
vs.
UCT
(Min)
+15
-5
+5
-10
+10
-15
WINTER SPRING SUMMER FALL
X1
Y2
Y1
X2
D2
A1
D1
A2
Y2
0
Figure 1 Periods according to time of equation and astronomical seasons. During X1(February 11-May 04) and X2 (July 26-November 03)
(marked with pink lines) sun time is accelerating, and during Y1 (May 15-July25) and Y2 (November 04-February 10) (marked with green lines) it
is decelerating compared with the coordinated universal time (UCT). During A1 (April 15-June13) and A2 (September 01-December 25) sun time
stays ahead and during D1 (June 14-August 31) and D2 (December 26-April 14) it stays behind the UCT. Astronomical seasons are separated
with dotted vertical lines. During astronomical spring and summer daylight exceeds darkness, and vice versa during astronomical fall and winter
darkness exceeds daylight in Finland. Y-axis on the left side presents the time difference (in minutes) that sun time deviates from the UCT.
Hiltunen et al.Journal of Circadian Rhythms 2011, 9:10
http://www.jcircadianrhythms.com/content/9/1/10
Page 4 of 12
Table 3 Astronomical seasons and men’s (M) and
women’s (W) suicide mortality
Area Selected Days Astronomical season
Winter Spring Summer Fall
MFinland All .099
.094-.103
.120
.115-.125
.117
.112-.122
.106
.101-.111
Helsinki All .128
.120-.136
.138
.128-.148
.135
.123-.147
.131
.122-.140
T+ S+ .123
.099-.146
.135
.122-.147
.139
.122-.156
.137
.120-.155
S- .113
.092-.134
.144
.125-.163
.142
.120-.164
.115
.099-.132
T- S+ .122
.108-.136
.146
.128-.163
.130
.117-.143
.133
.118-.147
S- .122
.097-.146
.140
.120-.161
.129
.112-.146
.144
.116-.172
Oulu All .119
.098-.140
.141
.123-.160
.159
.138-.180
.131
.113-.150
T+ S+ .107
.050-.163
.134
.103-.165
.162
.112-.212
.152
.077-.227
S- .097
.059-.135
.126
.082-.170
.175
.132-.217
.147
.101-.193
T- S+ .124
.094-.154
.167
.132-.203
.156
.115-.197
.117
.073-.161
S- .097
.045-.148
.138
.110-.166
.132
.086-.178
.144
.083-.205
WFinland All .025
.023-.027
.031
.030-.032
.029
.028-.031
.028
.027-030
Helsinki All .046
.042-.050
.050
.045-.054
.049
.045-.054
.048
.043-.053
T+ S+ .038
.028-.048
.056
.046-.065
.049
.039-.058
.056
.043-.069
S- .051
.033-.069
.049
.041-.056
.046
.034-.058
.052
.042-.062
T- S+ .042
.036-.049
.046
.034-.057
.049
.040-.057
.049
.039-.059
S- .052
.039-.065
.052
.042-.062
.051
.041-.061
.045
.031-.059
Oulu All .036
.029-.044
.040
.030-.049
.042
.032-.051
.039
.029-.048
T+ S+ .032
.006-.058
.031
.016-.046
.042
.023-.061
.049
.013-.086
S- .037
.015-.058
.030
.015-.043
.047
.020-.074
.020
.005-.036
T- S+ .041
.019-.063
.051
.028-.074
.037
.019-.055
.043
.019-.067
S- .028
.000-.055
.045
.020-.069
.042
.020-.063
.047
.018-.076
Daily mean of suicide mortality and confidence interval of the mean in
aggregate over the years from 1969 to 2003 for men and women, during
astronomical seasons in Finland, Helsinki and Oulu, and according to daily
changes (+/-) in temperature (T) and sunshine hours(S) in Helsinki and Oulu.
Winter: 21.12-20.03
Spring: 21.03-20.06
Summer: 21.06-22.09
Fall: 23.09-20.12
Table 4 Accelerating and decelerating periods of the
equation of time and men’s (M) and women’s (W) suicide
mortality
Area Selected Days Periods of time of equation
X1 Y1 X2 Y2
MFinland All .109
.105-.114
.124
.118-.129
.112
.107-.116
.101
.096-.106
Helsinki All .131
.121-.141
.142
.130-.154
.130
.122-.139
.130
.120-.140
T+ S+ .139
.116-.161
.149
.131-.167
.122
.097-.147
.124
.097-.151
S- .151
.123-.179
.145
.119-.170
.124
.103-.145
.110
.088-.131
T- S+ .152
.122-.182
.126
.100-.153
.135
.121-.150
.120
.099-.141
S- .133
.104-.161
.124
.106-.142
.138
.116-.160
.114
.086-.142
Oulu All .133
.115-.150
.146
.124-.167
.150
.131-.169
.122
104-.140
T+ S+ .156
.094-.218
.149
.101-.198
.206
.122-.290
.131
.052-.210
S- .096
.042-.150
.207
.142-.272
.165
.112-.217
.097
.046-.148
T- S+ .199
.138-.259
.140
.090-.190
.138
.092-.184
.115
.068-.162
S- .123
.065-.181
.158
.114-.201
.175
.107-.242
.056
.008-.103
W Finland All .028
.027-.029
.032
.030-.033
.030
.029-.031
.025
.024-.027
Helsinki All .047
.043-.051
.053
.048-.058
.050
.045-.054
.043
.039-.048
T+ S+ .052
.040-.064
.055
.046-.065
.056
.044-.068
.033
.018-.048
S- .044
.030-.057
.059
.047-.072
.055
.041-.069
.055
.044-.067
T- S+ .051
.032-.070
.049
.036-.061
.049
.040-.058
.036
.028-.045
S- .051
.034-.067
.046
.034-.058
.048
.037-.058
.045
.025-.065
Oulu All .038
.029-.047
.045
.034-.057
.035
.027-.042
.038
.029-.047
T+ S+
S-
.023
.005-.042
.039
.017-.060
.044
.014-.074
-
.035
.012-.058
.053
.018-.087
.015
.001-.029
.026
.002-.050
T- S+
S-
.062
.028-.096
.030
.006-.054
.042
.024-.061
.036
.013-.059
.030
.003-.058
.060
028-.091
.032
.010-.054
-
Daily mean of suicide mortality and confidence interval of the mean in
aggregate over the years from 1969 to 2003 for men and women, during
accelerating (X1, X2) and decelerating (Y1, Y2) periods of the equation of time
in Finland, Helsinki and Oulu, and according to daily changes (+/-) in
temperature (T) and sunshine hours(S) in Helsinki and Oulu.
X1: 11.02-14.05
Y1: 15.05-25.07
X2: 26.07-03.11
Y2: 04.11-10.2
Hiltunen et al.Journal of Circadian Rhythms 2011, 9:10
http://www.jcircadianrhythms.com/content/9/1/10
Page 5 of 12


![PET/CT trong ung thư phổi: Báo cáo [Năm]](https://cdn.tailieu.vn/images/document/thumbnail/2024/20240705/sanhobien01/135x160/8121720150427.jpg)


