
RESEARC H Open Access
Validation of extravascular lung water
measurement by single transpulmonary
thermodilution: human autopsy study
Takashi Tagami
1*
, Shigeki Kushimoto
2
, Yasuhiro Yamamoto
3
, Takahiro Atsumi
2
, Ryoichi Tosa
1
, Kiyoshi Matsuda
4
,
Renpei Oyama
5
, Takanori Kawaguchi
6
, Tomohiko Masuno
2
, Hisao Hirama
1
, Hiroyuki Yokota
2
Abstract
Introduction: Gravimetric validation of single-indicator extravascular lung water (EVLW) and normal EVLW values
has not been well studied in humans thus far. The aims of this study were (1) to validate the accuracy of EVLW
measurement by single transpulmonary thermodilution with postmortem lung weight measurement in humans
and (2) to define the statistically normal EVLW values.
Methods: We evaluated the correlation between pre-mortem EVLW value by single transpulmonary thermodilution
and post-mortem lung weight from 30 consecutive autopsies completed within 48 hours following the final
thermodilution measurement. A linear regression equation for the correlation was calculated. In order to clarify the
normal lung weight value by statistical analysis, we conducted a literature search and obtained the normal
reference ranges for post-mortem lung weight. These values were substituted into the equation for the correlation
between EVLW and lung weight to estimate the normal EVLW values.
Results: EVLW determined using transpulmonary single thermodilution correlated closely with post-mortem lung
weight (r= 0.904, P< 0.001). A linear regression equation was calculated: EVLW (mL) = 0.56 × lung weight (g) -
58.0. The normal EVLW values indexed by predicted body weight were approximately 7.4 ± 3.3 mL/kg (7.5 ± 3.3
mL/kg for males and 7.3 ± 3.3 mL/kg for females).
Conclusions: A definite correlation exists between EVLW measured by the single-indicator transpulmonary
thermodilution technique and post-mortem lung weight in humans. The normal EVLW value is approximately 7.4 ±
3.3 mL/kg.
Trial registration: UMIN000002780.
Introduction
Pulmonary edema is one of the most common problems
in critically ill patients and has a profound effect on
patient outcome [1,2]. In general, pulmonary edema is
diagnosed on the basis of patient history, physical exam-
ination, routine laboratory examination, and chest radio-
graphic findings [2,3]. However, interpretation of these
parameters is often limited by a certain degree of sub-
jectivity that may cause interobserver error even among
experts [4,5]. In addition, clinical symptoms may be
undetectable in the incipient stages of edema. The diffi-
culties faced during quantification of pulmonary edema
were addressed many years ago [6-8]. However, attempts
to develop direct or indirect methods of measuring
edema turned out to be lacking in either sensitivity or
specificity.
The introduction of the double-indicator thermodilu-
tion technique made it possible to measure extravascular
lung water (EVLW) and demonstrated excellent correla-
tion between in vivo and postmortem gravimetric
EVLW values in both animal and human lungs [9,10].
However, this method was cumbersome and too techni-
cally challenging for application in routine clinical prac-
tice. Therefore, it remained largely a research tool.
* Correspondence: t-tagami@nms.ac.jp
1
Department of Emergency and Critical Care Medicine, Aidu Chuo Hospital,
1-1 Tsuruga, Aiduwakamatsu, Fukushima, 965-8611, Japan
Full list of author information is available at the end of the article
Tagami et al.Critical Care 2010, 14:R162
http://ccforum.com/content/14/5/R162
© 2010 Tagami et al.; licensee BioMed Central Ltd. This is an open access article distributed under the terms of the Creative Commons
Attribution License (http://creativecommons.org/licenses/by/2.0), which permits unrestricted use, distribution, and reproduction in
any medium, provided the original work is properly cited.

For EVLW evaluation in the clinical setting, the dou-
ble-indicator technique has been replaced by the single-
indicator technique, which is implemented in the
PiCCO monitoring system (Pulsion Medical Systems,
Munich, Germany). EVLW measured by this method
has been shown to correlate closely with both the
double-indicator technique [11,12] and the gravimetric
measurement of lung weight in experimental animal
models [13-15]. However, the correlation between
single-indicator EVLW and postmortem lung weight in
humans has not yet been studied.
Furthermore, validated normal EVLW values by both
the double- and single-indicator methods remain unre-
ported. In general, the standard method for determining
a normal value is to define and obtain a healthy popula-
tion of at least 120 individuals [16]. In 1983, Sibbald
and colleagues [17] defined the normal mean EVLW as
5.6 mL/kg (3.0 to 8.8 mL/kg) by using the double-
indicator technique. However, they included only
16 patients and all of the ‘normal’patients were criti-
cally ill and mechanically ventilated without pulmonary
edema diagnosed on the basis of portable chest roent-
genogram findings. A similar definition was reported in
1986 by Baudendistel and colleagues [18], who used the
single-indicator method and reported that a mean
EVLW of 5.1 mL/kg (2.4 to 10.1 mL/kg) obtained from
6‘normal’critically ill patients constituted the ‘normal’
EVLW content in the human lung. These ‘normal’criti-
cally ill patients remained free of both radiographic
abnormalities typical of pulmonary edema and physiolo-
gical evidence of pulmonary dysfunction. However, sev-
eral studies have indicated that in critically ill patients,
chest roentgenograms are not accurate for monitoring
modest changes in lung water and that gas exchange
abnormalities or dyspnea appears only when EVLW
reaches twice its baseline level [6,19].
So far, no study has defined normal EVLW values
using the PiCCO system. Most clinical studies have
been conducted on critically ill patients as subjects who
would not present with normal EVLW [11,20]. In sev-
eral clinical studies, researchers have considered EVLW
values of below 7 mL/kg to be normal [21-26]. However,
others have reported EVLW values of below 10 mL/kg
to be normal [27-29]. Recently, Craig and colleagues
[21] argued that there is a lack of consensus as to what
constituted a normal value. Therefore, our study aimed
(a) to validate EVLW accuracy using the PiCCO system
by postmortem lung weight measurement of the human
lung and (b) to define normal EVLW values.
Materials and methods
This study was approved by our institutional review
board and was registered with the University Hospital
Medical Information Network Clinical Trials Registry
(UMIN-CTR ID UMIN000002780). The study involved
the following three processes.
1. Examination of the correlation between single-
indicator EVLW and postmortem lung weight
We studied 30 consecutive autopsy cases (24 males and
6 females) in which EVLW was measured using the
PiCCO system just prior to death from July 2004 to
September 2009 in four teaching hospitals. Clinical data
were obtained from medical records.
A 4 F or 5 F femoral arterial thermistor-tipped cathe-
ter (PV2014L16 or PV2015L20; Pulsion Medical Sys-
tems) was inserted in all patients and connected to the
PiCCO monitor. The PiCCO monitor uses a single-ther-
mal indicator technique to calculate the cardiac output
(CO), global end-diastolic volume (GEDV), EVLW, and
other volumetric parameters. A 15-mL bolus of 5% glu-
cose at 5°C was injected through a central venous cathe-
ter, and CO was calculated using the Stewart-Hamilton
method. Concurrently, the mean transit time and the
exponential downslope time of the transpulmonary ther-
modilution curve were calculated. The product of CO
and mean transit time represents the intrathoracic ther-
mal volume (ITTV) [11]. The product of CO and expo-
nential downslope time is the pulmonary thermal
volume (PTV) [30]. GEDV is calculated as the difference
between the ITTV and PTV, which represents the com-
bined end-diastolic volumes of four cardiac chambers.
This allows the calculation of intrathoracic blood
volume (ITBV) from the linear relationship with GEDV:
ITBV = [1.25 × GEDV] - 28.4 [11]. EVLW is the differ-
ence between the ITTV and the ITBV [11,12]. The
detailed principles and calculations involved in deriving
EVLW using thermodilution techniques are discussed
elsewhere [20,31].
The median EVLW value after three bolus injections
of 15 mL each was analyzed for each measurement. The
absolute EVLW value was indexed to actual body weight
(EVLW
a
) and predicted body weight (EVLW
p
), which
was calculated as 50 + 0.91 (height in centimeters -
152.4) for males and 45.5 + 0.91 (height in centimeters -
152.5) for females [21,32,33].
To calculate arterial partial pressure of oxygen/frac-
tion of inspired oxygen (PaO
2
/FiO
2
or P/F) ratio, blood
samples were taken via the arterial catheter within 60
minutes before or after the EVLW measurement. Chest
roentgenograms were obtained at the bedside on the
same day. The correlation between lung injury score
(LIS) and EVLW was evaluated to investigate the corre-
lation between EVLW and lung damage. The timing of
the EVLW measurement and measurement of other
parameters was left to the doctors in charge.
Following death, written informed consent was
obtained from the family of each patient prior to
Tagami et al.Critical Care 2010, 14:R162
http://ccforum.com/content/14/5/R162
Page 2 of 8

autopsy. Experienced pathologists blinded to the study
objectives completed all autopsies within 48 hours after
the final thermodilution EVLW measurement had been
performed by the attending physicians. We chose 48
hours as a cutoff point for inclusion in the study
because postmortem lung weight shows little change in
the early postmortem period (4.5 to 72 hours) [34].
Prior to autopsy, cadavers were kept in accordance with
the policy of each institution. As a result, 23 out of 30
cadavers had been kept in a refrigeration chamber. The
remaining 7 cadavers, which had not been refrigerated,
underwent autopsy within the 6 hours subsequent to
the final EVLW recording.
Body weights and heights of all patients, with the
exception of 9 patients whose measurements were per-
formed at the bedside, were measured at autopsy. Dur-
ing autopsy, the weight of both lungs was measured
after determining the amount of pleural effusion before
formalin fixation.
We derived a linear regression equation after evaluat-
ing the correlation between the final EVLW measured
by the PiCCO system and postmortem lung weight.
We also evaluated the influence of sex, high LIS (>2.5),
large volumes of pleural effusion (>500 mL), low car-
diac index (CI) (<2.5 L/min per m
2
), high central
venous pressure (CVP) (>12 mm Hg), high positive
end-expiratory pressure (PEEP) (>10 cm H
2
O), time
delay before the autopsy (>24 hours), cause of death as
diagnosed by the pathologist (respiratory cause of
death or non-respiratory cause of death), and perfor-
mance of cardiopulmonary resuscitation (CPR) on ther-
modilution measurements.
2. Identification of reference ranges for normal lung
weight
The normal value of a clinical measurement is usually
defined by Gaussian distribution, which constitutes
from the central 95% (or 2 standard deviations [SDs])
value of the healthy population [16,35]. We referred to
data from several publications to estimate the normal
reference range of human lung weight [36-39]. Sawabe
and colleagues [38] reported standard organ weights
using data from 1,615 older Japanese patients who died
in hospitals in Japan. The age distribution of our study
population matched that of the population in their
study. Sawabe and colleagues strictly excluded patients
with abnormal lungs such as those with pneumonia or
diffuse alveolar damage and patients with malignant
tumors identified at autopsy. Along with primary exclu-
sions, they excluded organs with off-limit values beyond
99% of bilateral limits. We believe that these criteria
make their study protocol particularly robust. Therefore,
we considered their data to be representative of normal
lung weights.
3. Calculation of normal EVLW and EVLW
p
values
Using the linear regression equation for the correlation
between transpulmonary EVLW measurement and post-
mortem lung weight in equation 1 (see Results), we cal-
culated thermodilution EVLW values for normal lungs
using the lung weight values reported in the literature.
Traditionally, EVLW has been indexed to actual body
weight, with the value being expressed as EVLW in
milliliters per kilogram. However, several recent clinical
studies have found that indexing EVLW to predicted
body weight (EVLW
p
), instead of actual body weight
(EVLW
a
), improves the predictive value of EVLW for
patient survival and correlation with markers of disease
severity [21,29,33]. Therefore, we expressed normal
EVLW values as EVLW
p
.
Statistical analysis
Data were presented as mean values ± SD or as the med-
ian (interquartile range, IQR), depending on the distribu-
tion normality of the variable. In keeping with the
literature, reference ranges for lung weights were
expressed as mean ± SD. Cadavers were categorized into
several groups and were compared using two-sample t
tests or the Mann-Whitney Utest for normally and non-
normally distributed data, respectively. Postmortem lung
weight was compared with EVLW, which was calculated
using the single-indicator transpulmonary thermodilu-
tion method by Spearman’s correlation coefficient (r).
Because our present study compared the indicator dilu-
tion of EVLW (in milliliters) and postmortem lung
weight (in grams), we did not use the Bland-Altman plot
analysis. It is not possible to analyze different parameters
by a Bland-Altman plot analysis. Therefore, we expressed
the data in terms of correlation coefficients. The regres-
sion line was calculated using Passing and Bablok regres-
sion. The difference between any two correlation
coefficients was tested by the z test after Gaussian trans-
formation of the coefficients. Reproducibility of EVLW
measurements was assessed by the coefficient of variation
(CV) and intraclass correlation coefficient (ICC). ICC
uses components of variance from a variance analysis
and assesses the agreement of quantitative measurements
in terms of consistency and conformity [40,41]. The ICC
ranges from 0 to 1, where 1 demonstrates perfect reliabil-
ity. To assess the intraobserver reliability, ICC (1, 1) was
used for single-measure reliability and ICC (1, 3) was
used for reliability over an average of three measure-
ments. A Pvalue of less than 0.05 was considered signifi-
cant. Statistical analyses were performed using SPSS 17.0
for Windows (SPSS, Inc., Chicago, IL, USA) for all tests
except Passing and Bablok regression analysis and com-
parison of correlation coefficients, which were performed
using the software StatFlex 6.0 for Windows (Artech Co.
Ltd, Osaka, Japan).
Tagami et al.Critical Care 2010, 14:R162
http://ccforum.com/content/14/5/R162
Page 3 of 8
Results
All autopsies were completed within 48 hours (range of
1 to 47 hours) following the final thermodilution EVLW
measurement. Median time from the final measurement
to death was 5 hours and 7 minutes. Median time from
death to the beginning of the autopsy was 9 hours and
16 minutes, and the median time from the final mea-
surement to the beginning of the autopsy was 17 hours
and 39 minutes.
Table 1 summarizes the clinical and autopsy findings.
The amount of pleural effusion measured ranged from
10 to 1,600 mL. Twenty-eight patients (93%) were
mechanically ventilated and the median PEEP in these
patients was 8 cm H
2
O (IQR = 5.0 to 10.0 cm H
2
O).
Causes of death diagnosed by a pathologist included the
following: multiple organ failure (n= 12 patients), pneu-
monia (n= 6), heart failure (n= 6), acute respiratory
distress syndrome (ARDS) due to sepsis (n=4),and
multiple trauma (n= 2). Overall, there were 10 patients
with respiratory causes of death (RF): 6 patients with
pneumonia and 4 patients with ARDS. There were 20
patients without respiratory causes of death (non-RF).
The EVLW
p
was significantly higher in the RF group
than in the non-RF group (17.1 mL/kg [IQR = 12.9 to
22.0 mL/kg] versus 10.1 mL/kg [IQR = 8.9 to 12.2 mL/
kg]; P= 0.01). Comparisons of other parameters
between RF and non-RF were as follows: lung weight
(1,610 g [IQR = 1,500 to 2,120 g] versus 1,212 g [IQR =
960 to 1,360 g]; P=0.004),PaO
2
/FiO
2
(84.8 ± 49 mm
Hg versus 176.0 ± 116 mm Hg; P= 0.008), LIS (3 [IQR
= 2.3 to 3.6] versus 2 [IQR = 1 to 2.3]; P= 0.003), PEEP
(8 cm H
2
O[IQR=6to10cmH
2
O] versus 5 cm H
2
O
[IQR = 4 to 9 cm H
2
O]; P= 0.17), and pleural effusion
(550 mL [IQR = 370 to 850 mL] versus 500 mL [IQR =
300 to 865 mL]; P= 0.22).
No difference in lung weight was demonstrated
between patients whose autopsy was started within 24
hours (early group; n= 20, 1,315 g [IQR = 1,270 to
1,600 g]) and those whose autopsy was started later
than 24 hours (late group; n= 10, 1,320 g [IQR = 930
to 1,757 g]) (P= 0.79).
CPR was performed in 16 cases (53%). Median lung
weights were 1,285 g (IQR = 950 to 1,672 g) in the CPR
group and 1,430 g (IQR = 1,200 to 1,620 g) in the non-
CPR group. There was no statistical difference between
the groups (P=0.59).
Reproducibility of EVLW measurements
The CV of EVLW measurement in the present study
was 7.4%. ICC (1, 1) and ICC (1, 3) of EVLW measure-
mentinthepresentstudywere0.97and0.99,
respectively.
Correlation between single-indicator EVLW and
postmortem lung weight
We found a very close correlation between transpul-
monary measurement of EVLW and postmortem lung
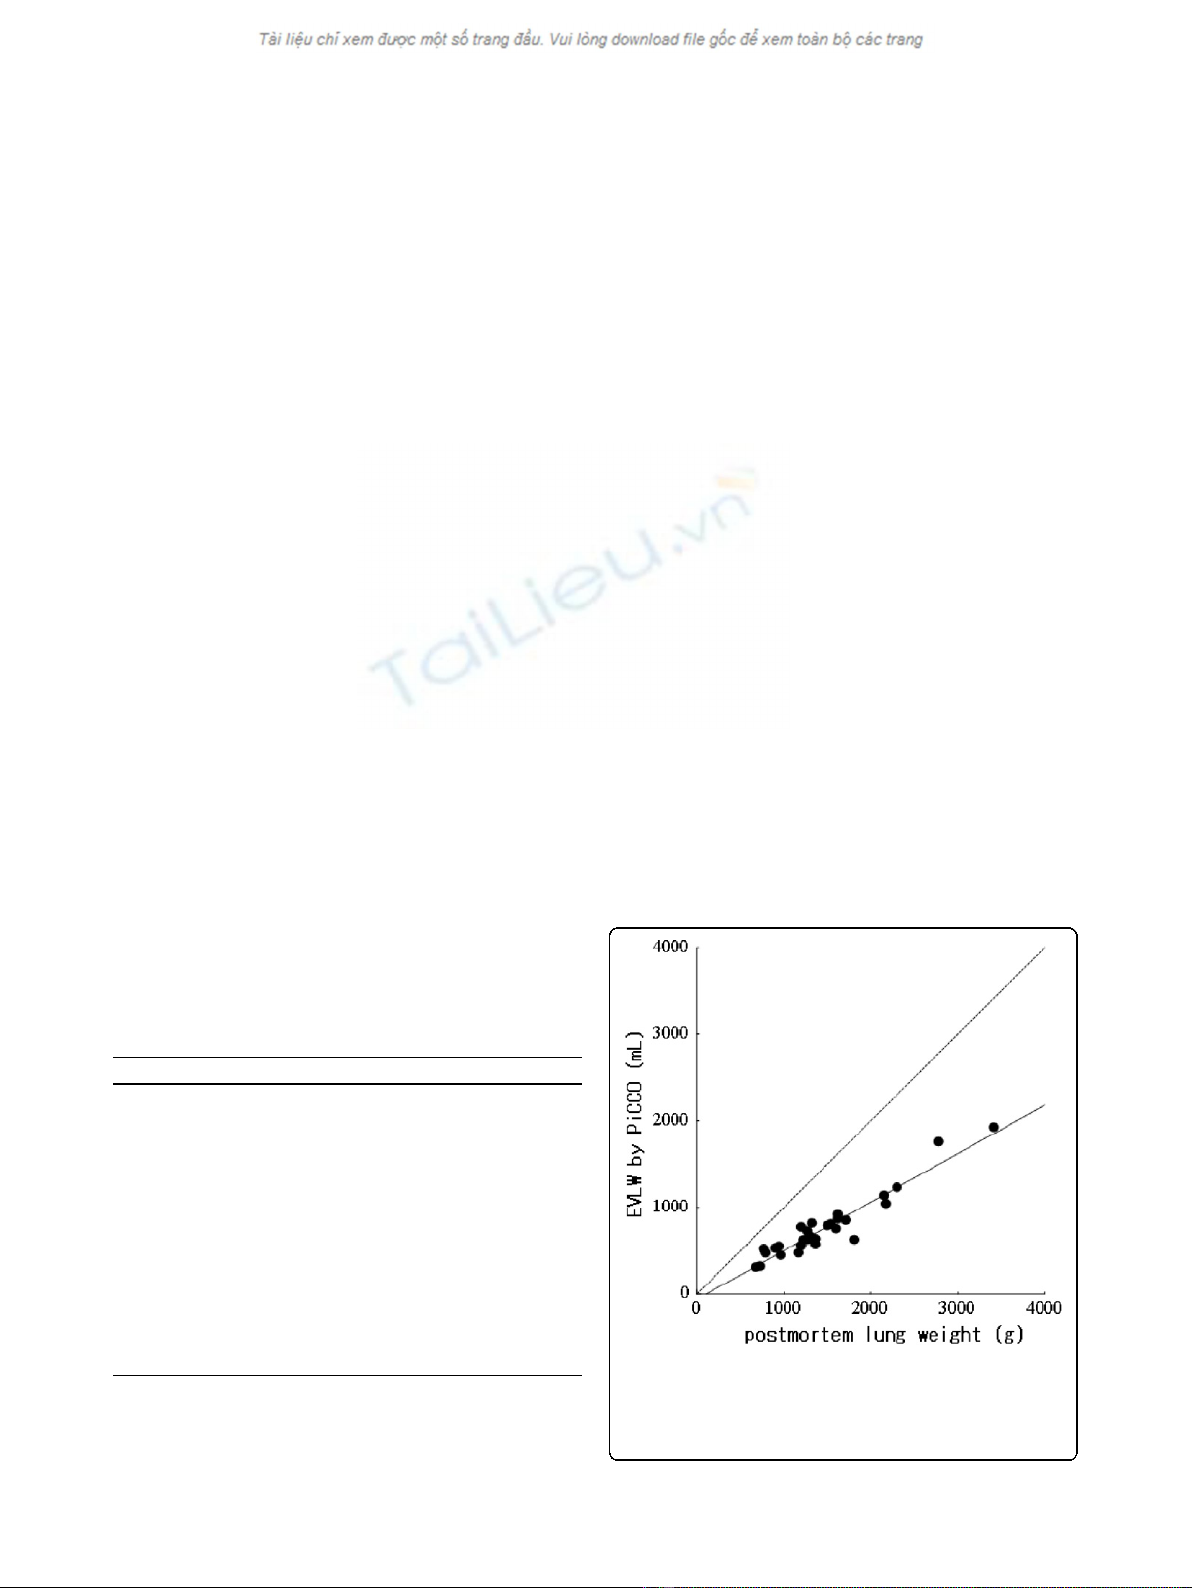
weight (r=0.904;P< 0.001) (Figure 1). The linear
regression equation for correlation was as follows:
EVLW in milliliters 56 lung weight in grams 58
()
=×
()
−[. ] ..00
(1)
Table 1 Patient characteristics
Characteristics Value
Age, years 68.0 (60.0-77.0)
Height, m 1.63 (1.56-1.72)
Actual weight, kg 65.0 (54.6-70.0)
Predicted body weight, kg 57.3 (52.4-61.5)
Postmortem lung weight, g 1,320 (1,170-1,620)
Pleural effusion, mL 500 (300-850)
EVLW, mL 655 (553-856)
EVLW
a
, mL/kg 12.0 (8.4-14.4)
EVLW
p
, mL/kg 11.6 (9.7-16.3)
Lung injury score 2.3 (1.3-3.0)
PaO
2
/FiO
2
, mm Hg 145 ± 107
Cardiac index, L/min per m
2
3.3 ± 1.3
All values are expressed as median (first to third quartile) or as mean ±
standard deviation. EVLW, extravascular lung water; EVLW
a
, extravascular lung
water indexed to actual body weight; EVLW
p
, extravascular lung water
indexed to predicted body weight; PaO
2
/FiO
2
, arterial partial pressure of
oxygen/fraction of inspired oxygen.
Figure 1 Correlation of extravascular lung water (EVLW)
measured by single transpulmonary thermodilution and by
postmortem lung weight. EVLW (in milliliters) = [0.56 × lung
weight (in grams)] - 58.0. n= 30, r= 0.90, P< 0.001. Line of identity
is dashed.
Tagami et al.Critical Care 2010, 14:R162
http://ccforum.com/content/14/5/R162
Page 4 of 8

For the correlation between transpulmonary measure-
ment of EVLW and postmortem lung weight, no signifi-
cant difference was observed between sexes (males: n=
24, r= 0.846, P< 0.001; females: n=6,r= 0.943, P=
0.005; difference of correlation coefficient: P= 0.72).
Furthermore, no significant difference was found
between patients whose pleural effusion amounts were
less than or more than 500 mL (≤500 mL: n= 13, r=
0.89, P< 0.001; >500 mL: n= 17, r=0.92,P<0.001;
difference of correlation coefficient: P= 0.13); between
low- and high-LIS patients (LIS ≤2.5: n=18,r=0.84,
P< 0.001; LIS >2.5: n= 12, r= 0.95, P< 0.001; differ-
ence of correlation coefficient: P= 0.27); or between
high- and low-CI patients (CI >2.5 L/min per m
2
:n=
20, r= 0.84, P< 0.01; CI ≤2.5 L/min per m
2
:n= 10, r=
0.96, P< 0.01; difference of coefficient of correlation:
P= 0.65). Very close correlations were demonstrated
with both the high-CVP group (>12 mm Hg; n= 13, r=
0.94, P<0.01)andthelow-CVPgroup(≤12 mm Hg;
n=17,r=0.89,P< 0.01), with no statistical difference
in coefficient of correlation (P= 0.12). Very close corre-
lation was also demonstrated between the high-PEEP
group(>10cmH
2
O; n=9,r=0.95,P<0.01)andthe
low-PEEP group (≤10 cm H
2
O; n=21,r= 0.87, P<
0.01), with no statistical difference in the coefficient of
correlation (P= 0.60). No significant difference was
observed between the RF and non-RF groups (RF: r=
0.84, P<0.01;non-RF:r=0.93,P< 0.01; difference of
coefficient of correlation: P= 0.39), between the early
and late autopsy groups (early versus late: r= 0.93, P<
0.01 versus r= 0.83, P< 0.01; difference of coefficient of
correlation: P= 0.39), or between the groups in which
CPR was or was not performed (CPR group: r=0.88,P
< 0.01; non-CPR group: r=0.90,P< 0.01; difference of
coefficient of correlation: P= 0.68).
Correlation between single-indicator EVLW and other
parameters
A moderate correlation was found between LIS and
lung weight/predicted body weight (PBW) (r=0.56,
P< 0.001). A similar result was found between LIS,
EVLW
p
(r= 0.61, P< 0.001), and EVLW
a
(r= 0.54,
P= 0.002). A moderate negative correlation was found
between P/F ratio and EVLW
p
(r= -0.41, P= 0.02).
Neither lung weight/PBW (r= -0.32, P= 0.07) nor
EVLW
a
(r=-0.32,P= 0.07) showed a significant cor-
relation with P/F ratio. No correlation was demon-
strated between the total pleural effusion amount and
EVLW (r= 0.006, P= 0.97).
Reference ranges for normal lung weights and calculating
normal EVLW
p
values
According to Sawabe and colleagues [38], the normal
lung weight values for males and females are 878 ± 339
g (15.1 ± 5.8 g/kg of PBW) and 636 ± 240 g (15.5 ± 5.8
g/kg of PBW), respectively. Table 2 shows calculations
of normal EVLW
p
values. In our study, the normal
EVLW
p
values were determined to be 7.5 ± 3.3 mL/kg
for males and 7.3 ± 3.3 mL/kg for females.
Discussion
The main findings of this study are that (a) measure-
ment of EVLW using the PiCCO single transpulmonary
measurement system is very closely correlated to post-
mortem lung weight measurement and (b) an EVLW
p
of
approximately 7.4 ± 3.3 mL/kg (males 7.5 ± 3.3; females
7.3 ± 3.3) is the reference value for normal lungs.
Validation and normal value of EVLW
Although a close agreement between EVLW values
from PiCCO and gravimetric lung water measurements
has been demonstrated in animal models with both
direct and indirect lung injury [13-15], there is no con-
clusive evidence for such agreement in humans. This is
the first published report to prove the close correlation
of those values in humans with a wide range of illnesses
and injured lungs. This correlation was also unaffected
by sex, degree of LIS, pleural fluid amount, degree of
CI,degreeofCVP,degreeofPEEP,lengthoftime
before the autopsy started, cause of death, or perfor-
mance of CPR.
Ourlinearregressionequationforthecorrelation
between transpulmonary EVLW measurement and post-
mortem lung weight (equation 1) is similar to that of
Patroniti and colleagues [27] (equation 2), whose EVLW
measurements by the thermal-indocyanine green dye
double-dilution method showed a good correlation with
quantitative computed tomography (CT) findings in 14
Table 2 Calculation of normal extravascular lung water for males and females
Male Female
EVLW = [0.56 × normal lung weight (in grams)] - 58 = [0.56 × 878] - 58
= 433.7
EVLW = [0.56 × normal lung weight (in grams)] - 58 = [0.56 × 636] - 58
= 298.2
Standard deviation: 189.8 Standard deviation: 134.4
Normal EVLW = 433.7 ± 189.8 mL Normal EVLW = 298.2 ± 134.4 mL
Normal EVLW
p
= 7.5 ± 3.3 mL/kg Normal EVLW
p
= 7.3 ± 3.3 mL/kg
EVLW, extravascular lung water; EVLW
p
, extravascular lung water indexed to predicted body weight.
Tagami et al.Critical Care 2010, 14:R162
http://ccforum.com/content/14/5/R162
Page 5 of 8


