HUE JOURNAL OF MEDICINE AND PHARMACY ISSN 3030-4318; eISSN: 3030-4326 41
Hue Journal of Medicine and Pharmacy, Volume 14, No.6/2024
Quantitative determination of carvedilol in human plasma by high-
performance liquid chromatography using fluorescence detection
Nguyen Dang Thuy Anh1, Nguyen Huu Tien1*
(1) Faculty of Pharmacy, Hue University of Medicine and Pharmacy, Hue University
Abstract
Background: Carvedilol is a pharmaceutical substance listed in the “Regulatory requirements of
bioequivalence study reports for generic drugs containing APIs upon applying for marketing authorization”.
Therefore, a simple method for quantifying carvedilol in human plasma is desirable. Objectives: This study
aims to develop an HPLC method for quantitation of carvedilol in human plasma. Materials and method:
The blank human plasma was spiked with carvedilol standard. After optimizing the process, the method
was validated according to the guidelines for the validation of bioanalytical methods of US-FDA and EMA.
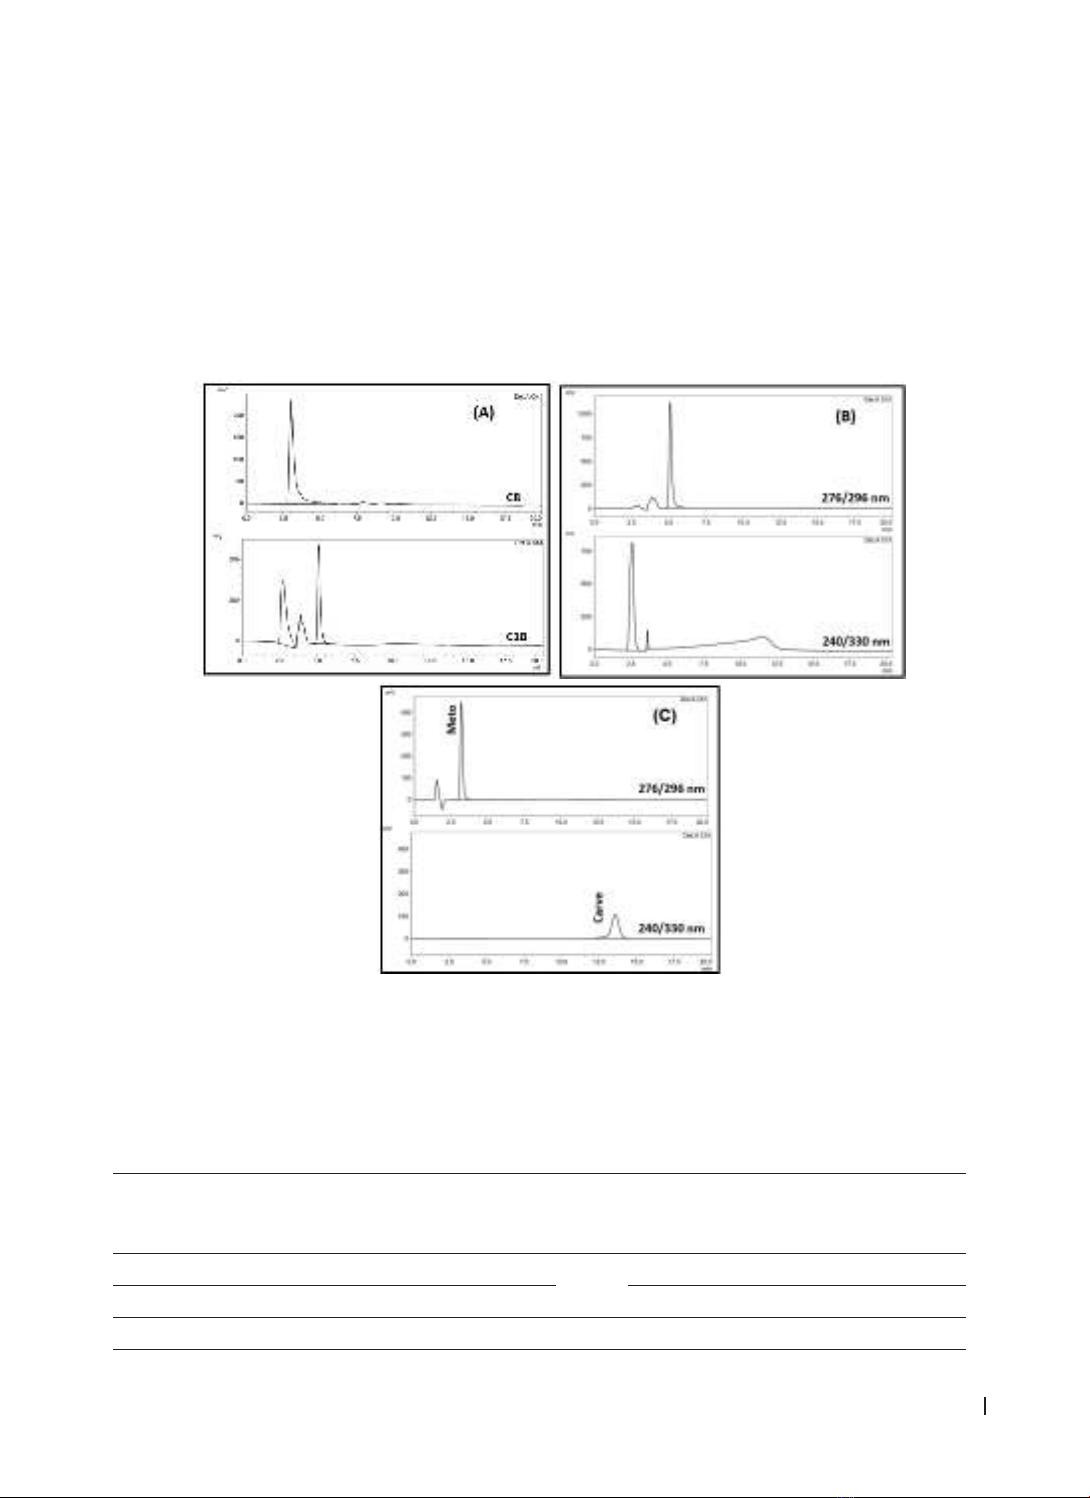
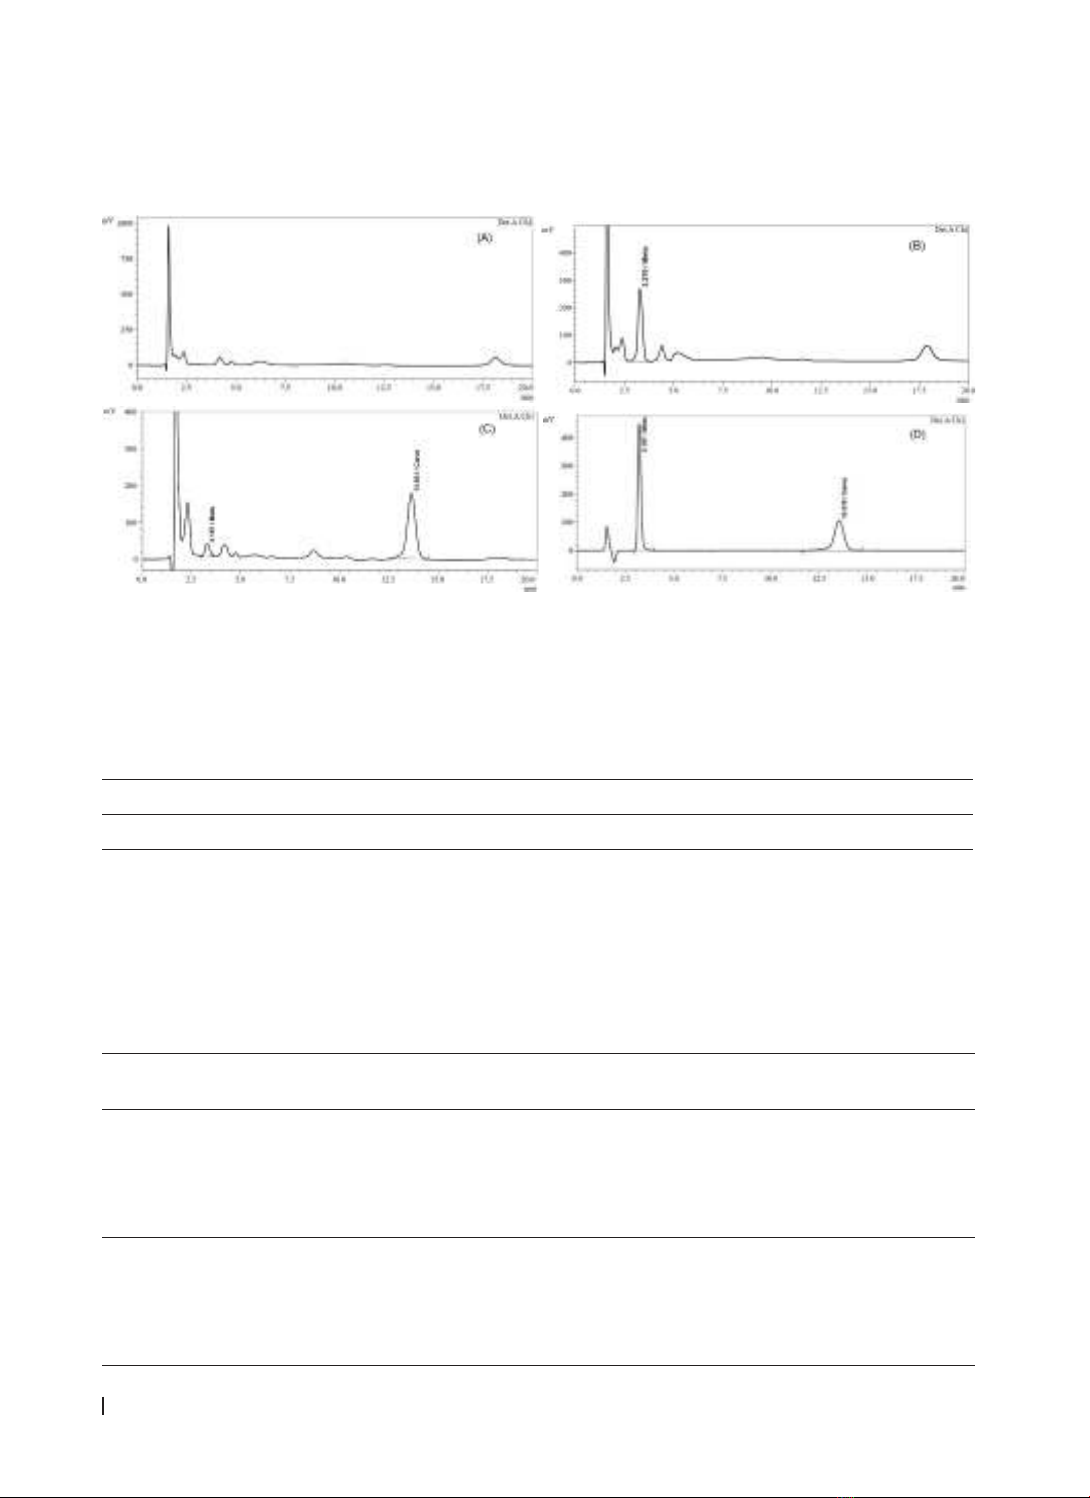
Results: Carvedilol and metoprolol as internal standard were extracted from plasma by protein precipitation
technique with acetonitrile. Plasma samples were eluted through a Zorbax Eclipse XDB-C8 (5 μm; 4.6 x
150 mm) column with an isocratic mobile phase consisting of 0.1% trifluoroacetic acid in water, acetonitrile,
and methanol (60:20:20; v/v/v). The analytical method met the criteria according to the US-FDA and EMA
guidelines for the bioanalytical method validation. Conclusion: The method can be applied to determine
carvedilol in biological fluid for pharmacokinetic research and bioequivalence assessment.
Keywords: carvedilol, human plasma, HPLC.
Corresponding Author: Nguyen Huu Tien
E-mail: nhtien@huemed-univ.edu.vn; nhtien@hueuni.edu.vn
Received: 5/1/2024; Accepted: 1/8/2024; Published: 25/12/2024
DOI: 10.34071/jmp.2024.6.5
1. INTRODUCTION
In recent years, cardiovascular diseases have
been increasingly recognized as one of the leading
causes of morbidity and mortality in developed
countries. In most cases, individuals with
cardiovascular diseases may experience symptoms
such as chest pain and fatigue, while in many
instances, individuals may remain asymptomatic
until they experience a heart attack [1]. Therefore,
early detection and treatment of these conditions
are of paramount importance. Carvedilol is a
nonselective β receptor blocker with vasodilatory
and antioxidant properties, which is clinically used
to treat cardiovascular disorders such as mild to
moderate hypertension or angina pectoris [2].
All over the world, several methods have been
published for the estimation of carvedilol in rat
plasma [3], human plasma [4-6], and human urine
[7] using high-performance liquid chromatography
(HPLC) coupled to a fluorescence detector [5], [6], [8],
ultraviolet detector [7], [9], liquid chromatography
coupled to tandem mass spectrometry[10],
gas chromatography coupled to tandem mass
spectrometry [11] and ultra performance liquid
chromatography (UPLC) coupled to tandem mass
spectrometry [3, 12]. However, these methods
have several limitations, including complex sample
preparation procedures, lengthy analysis times, and
the use of hazardous solvents that pose risks to both
human health and the environment. In methods
involving mass spectrometry (MS) coupling,
reports have shown high sensitivity and low limit of
quantitation (LLOQ). The best LLOQ of 0.05 ng/mL
was reached when using the UPLC-MS/MS method.
However, these methods are costly and require
specialized equipment, making them not suitable
for all laboratories. Thus, in this paper, we present
a simple, accurate, and cost-effective HPLC method
using a fluorescence detector with a simple sample
preparation for quantifying carvedilol in human
plasma.
2. MATERIALS AND METHODS
2.1. Materials
Carvedilol (98%) and metoprolol tartrate
(100.37%) were provided by Toronto Research
Chemicals, Canada, and National Institute of Drug
Quality Control, Vietnam, respectively. HPLC-grade
acetonitrile, methanol, and all other analytical grade
chemicals were purchased from Merck, Darmstadt,
Germany. Ultrapure water was obtained from an
ultrapure water system, AltoTOC UF, AVIDITY, UK.
Human plasma was supplied by National Institute of
Hematology and Blood Transfusion, Vietnam.
The HPLC system of Shimadzu, Japan consisted of
a pump LC-20AD, an online degassing unit DGU-20A,
HUE JOURNAL OF MEDICINE AND PHARMACY ISSN 3030-4318; eISSN: 3030-4326
42
Hue Journal of Medicine and Pharmacy, Volume 14, No.6/2024
an automatic sample injector SIL-20A, and a model
RF-20A fluorescence detector. The results were
analyzed by LC solution version 1.2 software. The
elution was performed on a Zorbax Eclipse XDB-C8
column (5 μm; 4.6x150 mm). The mobile phase
was a mixture containing 0.1% trifluoroacetic acid
(TFA) in water, acetonitrile, and methanol (60:20:20,
v/v), with a flow rate of 1 mL/min. The elution time
was set for 20 min with the excitation/emission
wavelength gradient program.
2.2. Methods
2.2.1. Preparation of standard solutions
Stock solutions of carvedilol and metoprolol
of 1 mg/mL were prepared in methanol. These
solutions were diluted with methanol to obtain
working standard solutions of 1000 ng/mL.
2.2.2. Preparation of the sample solution
The human plasma was thawed at room
temperature. Subsequently, 100 μL of metoprolol at
a concentration of 1000 ng/mL, used as the internal
standard (IS), and 1 mL of acetonitrile were added
to a centrifuge tube containing 900 μL of plasma
and vortexed for 2 min. After that, the mixture was
centrifuged at 10000 rpm (Hermle Z326K, Germany)
for 10 min. Then, the supernatant was filtered
through a 0.45 µm nylon membrane filter to obtain
the filtrate, and 20 μL of this solution was injected
into the HPLC system.
2.2.3. Preparation of quality control sample
solutions
Quality control samples (QCs) included the lower
and upper limits of quantitation (LLOQ and ULOQ),
as well as low, middle, and high-quality controls
(LQC, MQC, HQC). These samples are plasma
samples containing a carvedilol standard solution
at concentrations of 2.5, 100, 7.5, 30, and 75 ng/
mL, respectively, along with the internal standard
solution at a final concentration of 100 ng/mL.
2.2.4. Method validation
The validation of the analytical method was
performed according to the US-FDA 2018 [13] and
EMA 2012 [14] guidelines through the following
criteria: system suitability, calibration range,
selectivity and specificity, carryover, sensitivity,
accuracy and precision, recovery, stability, and
dilution effects.
2.2.4.1. Calibration curves
The calibration curve consisted of plasma
samples containing carvedilol standard solutions at
concentrations of 2.5, 7.5, 10, 30, 75, and 100 ng/mL,
along with the IS solution at concentration of 100
ng/mL. The correlation between the concentration
of carvedilol on the X-axis and the peak area ratio
of carvedilol and IS on the Y-axis was represented
by a linear regression equation y = ax + b, where the
correlation coefficient was greater than or equal to
0.98.
2.2.4.2. Selectivity and specificity
It was determined by comparing peaks in the
chromatograms of blank plasma samples and
plasma samples containing carvedilol and IS. The IS
and carvedilol response in the blank and the average
IS and carvedilol responses of the calibrators and
QCs were also considered.
2.2.4.3. Cross validation
It was assessed by the impact of carryover on the
accuracy of the study sample concentrations.
2.2.4.4. Dilution effects
The integrity of the dilution process should be
monitored during validation by diluting QCs above
the ULOQ with a similar matrix to bring them
within the quantitation range. Additionally, the
accuracy and precision of these diluted QCs must be
demonstrated.
2.2.4.5. Accuracy and precision
The intra-day and inter-day accuracy and precision
(A&P) were established with three independent A&P
runs on three consecutive days. Each run consisted of
four QC levels (LLOQ, LQC, MQC, HQC), and each QC
sample was replicated six times. The concentrations
were calculated from the calibration curve under the
same analytical conditions.
2.2.4.6. Lower limit of quantitation
The lower limit of quantitation was defined as the
lowest concentration at which the analyte response
must be at least five times the analyte response of
the blank. At this concentration, the accuracy must
be within ± 20%, and the relative standard deviation
must be less than 20%.
2.2.4.7. Recovery
Three QC samples (LQC, MQC, HQC) were
prepared following the previously mentioned
sample preparation procedure. To assess the
recovery of carvedilol and the internal standard
(IS), we compared their responses in the extracted
QC samples to those in the non-extracted QC
samples.
2.2.4.8. Stability
The stability of the analyte in the plasma samples
was evaluated in the short-term and long-term
periods when storing samples at room temperature
for 6 hours and storage at –35 ± 5 °C for 30 days,
respectively. The plasma samples were also frozen
at –35 ± 5 °C to analyze the stability of carvedilol
HUE JOURNAL OF MEDICINE AND PHARMACY ISSN 3030-4318; eISSN: 3030-4326 43
Hue Journal of Medicine and Pharmacy, Volume 14, No.6/2024
after three freeze-thaw cycles. The stability of stock
solutions was assessed at room temperature for 6
hours and at -20 °C for 30 days by comparing these
concentrations with freshly prepared solutions on
the first day of analysis.
3. RESULTS
3.1. Chromatographic condition
Following the investigation of C18 and C8 column
systems, the Zorbax Eclipse XDB-C8 column (5 μm;
4.6 x 150 mm) was chosen for this study. After
conducting experiments with various mobile phase
systems at different ratios, the optimal mobile phase
consisted of 0.1% TFA in water, acetonitrile, and
methanol in volumetric proportions of 60:20:20.
The gradient wavelength pairs were adjusted
over time as follows: from 0.01 to 10 min using a
wavelength of 276/296 nm; from 10.01 to 17 min
using a wavelength of 240/330 nm; from 17.01 to 20
min using a wavelength of 276/296 nm for the peak
detection of aesthetically pleasing derivatives of the
active compound, achieving balance.
Figure 1. Spectra of the chromatographic condition of (A) the investigation of C18 and C8 column systems;
(B) phosphate buffer pH 2, acetonitrile, and methanol in volumetric proportions of 60:20:20 on a C8 column;
(C) 0.1% TFA in water, acetonitrile, and methanol in volumetric proportions of 60:20:20 on a C8 column
3.2. Method validation
For the system suitability test, all criteria (retention time, peak area, peak area ratio between carvedilol
and IS, tailing factor, and resolution) meet the requirements according to the standards of the US-FDA and
EMA. The results are presented in detail in Table 1.
Table 1. System suitability compared to criteria of the US-FDA and EMA guidelines
Retention
time
Peak
area
Peak
area
ratio
Tailing factor
(mean ± SD)
Resolution
(mean ± SD)
Carvedilol 0.27 1.81 2.37 0.96 ± 0.01 4.61 ± 0.07
IS 0.94 0.85 1.15 ± 0.21 3.28 ± 0.12
Acceptance criteria RSD* ≤ 3% 0.8 ≤ Tf ≤ 1.5 Rs ≥ 1.5
*RSD: the relative standard deviation
HUE JOURNAL OF MEDICINE AND PHARMACY ISSN 3030-4318; eISSN: 3030-4326
44
Hue Journal of Medicine and Pharmacy, Volume 14, No.6/2024
The results in Figure 1 demonstrated that at the respective retention times of the IS and carvedilol peaks,
no interfering peaks were observed in the chromatogram of the blank sample. Furthermore, the analyte
response at the LLOQ was five times greater than the analyte response of the zero calibrator. Based on these
observations, it can be concluded that this procedure exhibits high selectivity and specificity.
Figure 2. Chromatograms of (A) blank plasma; (B) plasma containing the IS; (C) plasma containing
carvedilol and IS; (D) standard solutions of carvedilol and IS
There was a strong linear correlation between the concentration of carvedilol and the ratio of the peak
areas of carvedilol and IS within the concentration range of 2.5-100 ng/mL, with the regression equation as
y = 0.1104x + 0.0051. The linearity showed a good correlation with a good correlation coefficient of 0.9998,
satisfying the requirement of r2 ≥ 0.98 (Table 2).
Table 2. The correlation between the ratio of the peak area and the concentration of carvedilol.
Ccarvedilol (ng/mL) 2.5 7.5 10 30 75 100
Scarvedilol/SIS 0.2877 0.7989 1.1118 3.3133 8.3908 10.9718
Ccarvedilol is the concentration of carvedilol; Scarvedilol/SIS is the ratio of the peaks of carvedilol and IS.
The LLOQ was found to be 2.5 ng/mL for carvedilol and the carryover did not exceed 20% of the LLOQ.
Besides, the accuracy and precision of the dilution with blank plasma were also within the acceptable range
of 15% of the nominal concentrations and RSD, respectively.
The intra-day and inter-day precision and accuracy are presented in Table 3. All these values fell within the
permissible limits of 85 - 115% of the test concentration and RSD 15%, respectively. Thus, the procedure
met the requirements for accuracy and precision in quantifying carvedilol in biological fluids.
Table 3. Intra-day and Inter-day precision and accuracy of the assay
Actual concentration
(ng/mL)
Concentration found
(mean ± SD) ng/mL
Accuracy
(mean ± SD) %
Precision
(%RSD)
Intraday
(n = 6)
2.5 2.27 ± 0.13 90.94 ± 5.11 5.62
7.5 7.56 ± 0.10 100.81 ± 1.34 1.33
30 32.13 ± 1.07 107.10 ± 3.58 3.58
75 80.74 ± 0.46 107.65 ± 0.62 0.57
Inter day
(n = 6)
2.5 2.32 ± 0.15 92.63 ± 5.87 6.34
7.5 7.30 ± 0.40 97.39 ± 5.18 5.31
30 31.41 ± 1.27 104.70 ± 4.25 4.05
75 79.06 ± 2.31 105.41 ± 3.08 2.92
HUE JOURNAL OF MEDICINE AND PHARMACY ISSN 3030-4318; eISSN: 3030-4326 45
Hue Journal of Medicine and Pharmacy, Volume 14, No.6/2024
For the recovery testing, it was determined at three concentrations of carvedilol and at concentration of
100 ng/mL of the IS. The average recovery of carvedilol and IS was found to be 94.41 ± 3.36% and 94.87 ±
2.82%, respectively (Table 4).
Table 4. Recovery of carvedilol from plasma
Carvedilol spiked concentration
(ng/mL)
Recovery
(mean ± SD)%
Precision
(%RSD)
7.5 91.51 ± 4.58 5.01
30 92.50 ± 5.00 5.41
75 99.22 ± 0.50 0.50
Regarding the stability testing, the results are presented in Table 5. These values demonstrate that the
sample exhibits good stability under all test conditions.
Table 5. Stability of carvedilol in plasma
QC samples Concentration found at
0h (mean ± SD) ng/mL
Concentration found
at the last hour
(mean ± SD) ng/mL
Deviation
(mean ± SD) %
RSD
(%)
Freeze-thaw LQC 7.09 ± 0.40 7.46 ± 0.30 5.45 ± 5.48 4.08
HQC 76.16 ± 3.69 74.74 ± 3.15 –1.65 ± 6.80 4.22
Short-term LQC 7.09 ± 0.40 7.47 ± 0.57 5.40 ± 4.31 7.59
HQC 76.16 ± 3.69 76.63 ± 3.05 0.92 ± 8.20 3.98
Long-term LQC 7.09 ± 0.40 7.52 ± 0.39 6.17 ± 5.65 5.13
HQC 76.16 ± 3.69 72.26 ± 2.58 - 4.99 ± 4.42 3.57
4. DISCUSSION
In this study, the chromatographic conditions
were optimized, including the chromatographic
column, mobile phase, and detection wavelength,
to provide clear and symmetrical substance signals.
Two types of columns, InertSustain™ C18 (5
μm; 4.6x250 mm) and Zorbax Eclipse XDB-C8 (5
μm; 4.6x150 mm), were investigated. The results
revealed no signal on the chromatogram when
eluted on the C18 column, whereas a strong signal
was observed with the C8 column. The C18 column,
consisting of 18 carbon atoms bonded to the silica, is
more densely packed than the C8 column, which has
only 8 carbon atoms. This denser packing increases
the surface area that the analyte molecules
must traverse, prolonging interaction time in the
elution and stationary phases. Consequently, the
analyte elutes faster on the C8 column, leading to
a shortened elution time and easy detection of the
analyte signal on the chromatogram. This C8 column
possesses column dimensions and packing particle
size similar to the study of Gehr T W B et al. [15].
Several mobile phases and gradient programs
were trialed using different proportions of water and
organic solvents such as acetonitrile and methanol.
Most studies employed phosphate buffer solutions
and organic solvents as mobile phases. However,
these buffer solutions are challenging to adjust
and control pH over time, leading to random errors
affecting validation results. In this study, a mobile
phase consisting of 0.1% TFA in water and organic
solvents was utilized, which proved optimal by
improving the stability of the mobile phase while
providing good resolution and symmetric peak
shape.
In the previously published reports, the
majority of detection wavelengths used fall within
the maximum absorption range of carvedilol,
resulting in a favorable signal for carvedilol on the
chromatogram, while the signal for the IS was still
suboptimal. The gradient program employed in this
study includes wavelengths within the maximum
absorption range of both carvedilol and the IS, which
has been an optimization compared to previous
studies, as both the signals for carvedilol and the
IS were adequately recorded on the chromatogram
with the retention time of 13.551 min and 3.157
min, respectively (Figure 2).
According to a previously published
pharmacokinetic study of carvedilol by Gehr T W