121
Journal of Medicine and Pharmacy, Volume 12, No.07/2022
Corresponding author: Vu Quoc Dat, email: datvq@hmu.edu.vn; quocdat181@yahoo.com
Recieved: 26/9/2022; Accepted: 19/12/2022; Published: 30/12/2022
Overall agreement between eGFR estimates obtained with the CKD-
EPI, MDRD and CG formulae in patients with advanced HIV diseases
Vu Quoc Dat1*, Nguyen Dinh Hong Phuc2, Ba Dinh Thang3
(1) Department of Tropical Diseases and Harm redution, Hanoi Medical University, Hanoi, Viet Nam
(2) Hanoi Medical University, Ha Noi, Viet Nam
(3) Department of Tropical Diseases and Harm redution, HaNoi Medical Hospital, Viet Nam
Abstract
Background: Traditional CKD risk factors as well as HIV-related factors are major determinants of the
prevalence of renal diseases among HIV patients. Few equations have been used in clinical practice for
calculating creatinine clearance, however, the accuracy of these formulae in HIV patients has been different.
Our goal was to evaluate the reliability of all three equations (Chronic Kidney Disease Epidemiology
Collaboration, Modification of Diet in Renal Disease, and Cockcroft-Gault) to estimate GFR in HIV-infected
patients. Materials and method: We conduct a retrospective, observational cohort study of patients with
HIV infection who are first time in care at selected HIV OPCs in Vietnam. Results: In 1108 patients eligible
for analysis, a major patient was in HIV clinical stage 3 and 4 with a median age of 36, and median serum
creatinine of 0.89 mg/dL. eGFR calculated by CG equation was lower than CKD-EPI formulae in overall
except overweight patients (p<0.05, paired t-test) while the similar results were observed in both CKD-EPI
and MRDR (p=0.144, paired t-test). Conclusion: There was a substantial agreement between CKD-EPI and
MDRD eGFR, agreement percentage of 90.1 and MDRD was reliable as CKD-EPI to calculate eGFR in the HIV
population.
Keywords: HIV, eGFR, CKD-EPI, MRDR, CG.
1. INTRODUCTION
Human Immunodeficiency Virus (HIV) has
become a popular and serious health problem
worldwide, as the number of people living and
newly infected with HIV in 2021 are 38.4 million
and 1.5 million people respectively [1]. Vietnam,
as a part of Asia and the Pacific which was ranked
as the 3rd of HIV-large scale epidemiology region,
has also suffered from this disease of the century.
According to data from The Joint United Nations
Programme on HIV/AIDS (UNAIDS) in 2017, Vietnam
had 250000 (220000-280000) people living with HIV
and 8600 (6600 11000) cases of death-related AIDS
in all ages [1]. One of the leading causes of mortality
in HIV-positive patients is renal dysfunction, as many
researchers have reported the high prevalence
of this complication, ranging between 20.4% and
33.5% [2],[3].
Renal disease is common among HIV-infected
individuals due to both direct (e.g., renal cell
damaged by apoptosis, immuno-complex formation
in HIV-associated nephropathy) and indirect causes
(e.g., nephrotoxic antiretroviral therapy including
tenofovir) in etiology [4],[5]. Guidelines for the
management of patients with HIV/AIDS, including
from the Vietnam Minister of Health, emphasize the
importance of early recognition of renal insufficiency
to prevent progression and limit complications [6]
and adjusting the dose of the antiretroviral drug
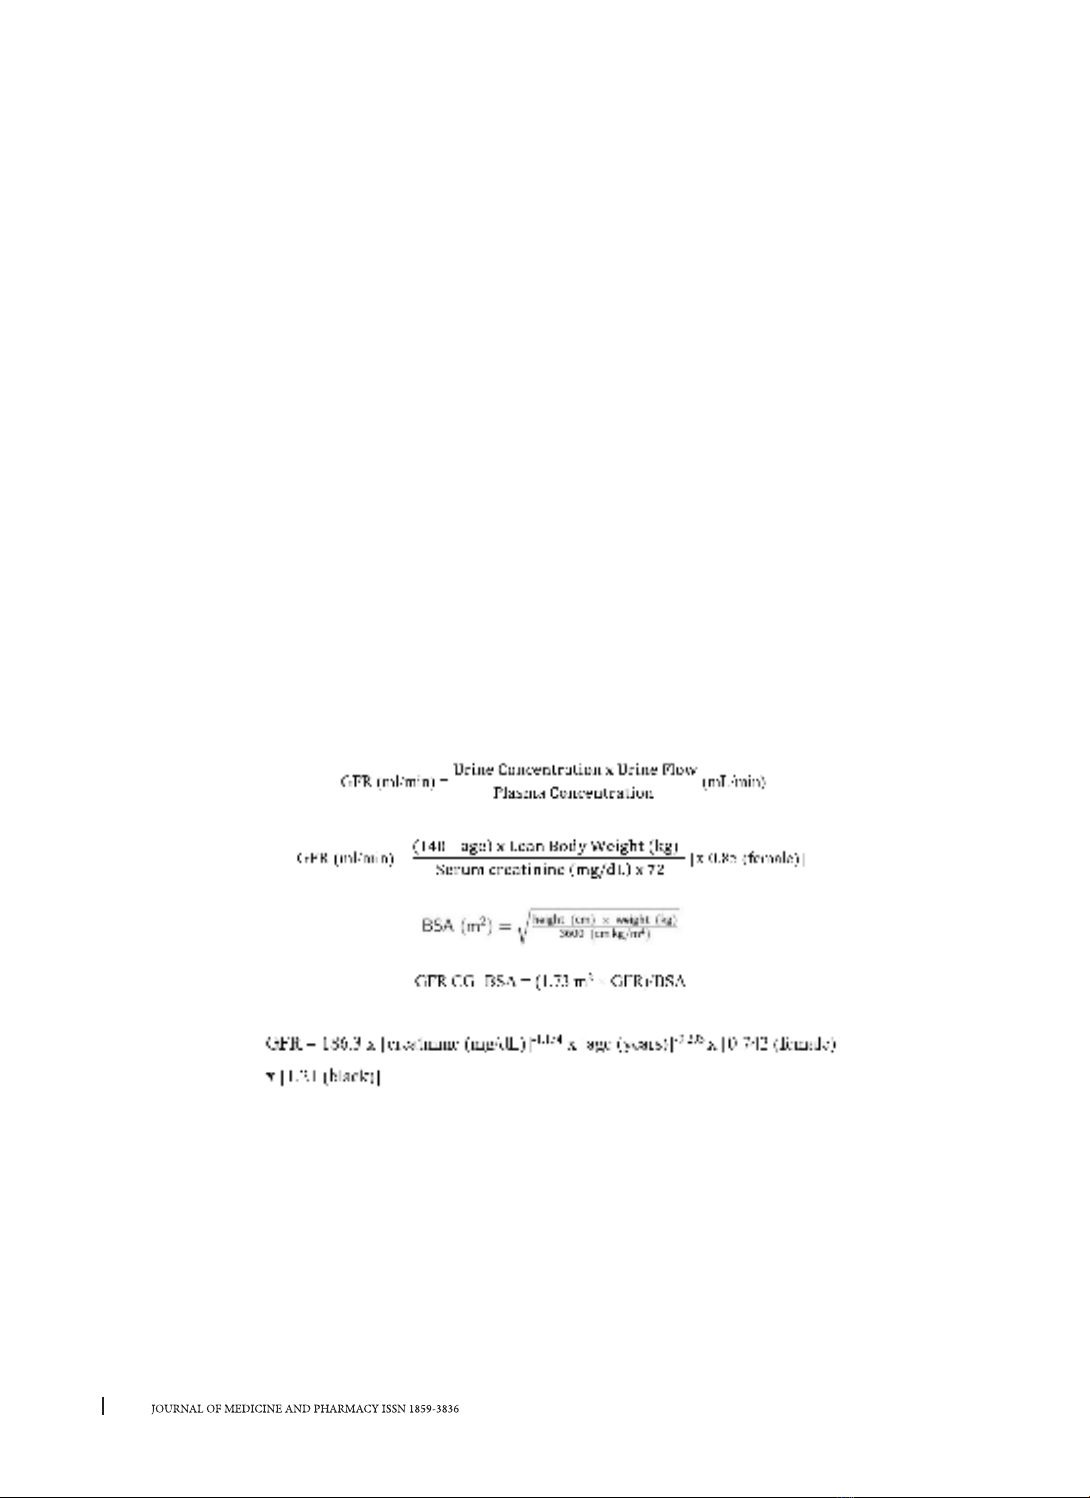
by creatinine clearance [7]. Numerous equations
have been used in clinical to estimate creatinine
clearance or Glomerular Filtration Rate (GFR) in
clinical practice, such as Chronic Kidney Disease
Epidemiology Collaboration (CKD-EPI), Modification
of Diet in Renal Disease (MDRD) and Cockcroft-Gault
(CG) [8], [9], [10]. However, the accuracy of these
equations among HIV-population has been different
among studies, as CKD-EPI has shown to be the most
precise calculation to evaluate renal function while
the others have not been validated [6], [11], [12].
In Vietnam, there haven’t had any research
evaluate the reliability of all three formulae to
estimate GFR in HIV-infected individuals, so we still
haven’t had any data of which formula is the most
accurate. Additionally, there have been few studies
looking specifically at impaired renal function and
how it affects the outcome in Vietnamese HIV-
infected populations [13]. Therefore, we established
a study “Estimation of glomerular filtration rate in
advanced HIV infected patients” to assess the overall
agreement between eGFR estimates obtained with
the CKD-EPI, MDRD and CG formulae.
DOI: 10.34071/jmp.2022.7.17
122
Journal of Medicine and Pharmacy, Volume 12, No.07/2022
2. METHOD
2.1. Study design and selected criteria
This is a retrospective, observational cohort
study of HIV-infected patients under a multicenter,
prospective, cohort evaluation of a CrAg screening
program among HIV-infected patients with CD4
100 cells/μL who are newly enrolled in care at
selected HIV OPCs in Vietnam.
Study population this study was conducted in 22
outpatient clinics throughout Vietnam participating
in the Vietnam Cryptococcal Retention in Care Study.
We included all patients who have met the folowing
criteria: 1) Aged 18 years (having passed 18th
birthday using Western calendar), 2) Confirmed HIV
infection HIV diagnostic testing algorithm with three
tests using different HIV assays, 3) CD4 100 cells/
μL, 4) Able to provide written informed consent, 5)
Enrolled at and plan to receive ongoing outpatient
care at one of the selected study OPCs. We excluded
the following patients: 1) Receipt of ART for more
than 4 consecutive weeks within the past year.
2.2. Procedures and Sampling size
A convenience sampling method was used to
include all patients with HIV infection and serum
creatinine tests during the study period.
Firstly, a list of all patients with HIV infection
was obtained from Microbiology Unit, Laboratory
Department in 22 outpatient clinics. Afterward,
information including the patient’s name, age, blood
collection date, and the department was extracted
from the microbiology records to match with
outpatient clinics identification, address, date of
admission, and discharge from clinical department
data. This information was then used to identify
patients’ full medical records. Patients’ statuses
were updated after 6 months and 12 months.
Records that were lost to follow-up, misplaced,
or did not have serum creatinine tests were not
included in the study process. A clearly instructed
case report form was used to collect data.
Regarding clinical and laboratory characteristics
of HIV-positive patients, the following information
was recorded after hospitalization: demographics
(including age, gender, height and weight at
baseline), clinical stage, CD4 cell counts, HBsAg,
anti-HCV, serum urea and serum creatinine. The
clinical outcomes were evaluated at 6 months and
12 months after enrolment.
2.3. Glomerular filtration rate definition: is
the volume of fluid filtered from the renal (kidney)
glomerular capillaries into Bowman’s capsule per
unit time
Cockcroft-Gault (CG) formulae
Modification of Diet in Renal Disease (MDRD) formulae
Chronic Kidney Disease Epidemiology Collaboration (CKD-EPI) formulae: GFR estimated with serum
creatinine (mg/dL)
1. Female, creatinine ≤ 0.7: GFR = 144 x (creatinine/0.7)-0.329 x (0.993)age
2. Female, creatinine > 0.7: GFR = 144 x (creatinine/0.7)-1.209 x (0.993)age
3. Male, creatinine ≤ 0.9: GFR = 141 x (creatinine/0.9)-0.411 x (0.993)age
4. Male, creatinine > 0.9: GFR = 141 x (creatinine/0.9)-1.209 x (0.993)age
123
Journal of Medicine and Pharmacy, Volume 12, No.07/2022
2.4. Statistical analysis
Data were entered into an electronic database
using Epidata. All analyses were performed using
STATA version 13.0. The quantitative variables
with normal distribution were presented as mean
(95% confidence interval (95% CI)), and those
with non-normal distribution were presented as
median (interquartile range IQR). The categorical
variables were presented as percentages. To
compare the difference between two and over
independent groups, the t-test, and Man-Whitney
test was used for the continuous variable, and
Chi-squared and Fishers exact test were used
for the categorical variable as appropriate. The
kappa statistic was used to assess the agreement
between eGFR stages defined by CG, MDRD,
and CKD-EPI. The Bland-Altman test was used
to graphically illustrate the limits of agreements
between three formulas, although the data were
not normally distributed. The standard deviation
(SD) of the difference between the three values
was used to estimate the limit of agreement. All
statistical tests are two-sided and associations
with P-value 0.05 were considered statistically
different. The association between renal function
estimations and 6-month and 12-month mortality
was assessed by logistic regression and receiver
operating curve with statistical comparisons of the
area under the curve (AUC). Models were adjusted
for age, gender, BMI, clinical stage at baseline,
CD4 cell counts at baseline, HBsAg and anti-HCV
results.
2.5. Ethical issue
All patient information was kept confidential
and anonymous. The inform consent was waived
due to the retrospective nature of the study.
3. RESULT
3.1. Study population characteristics
Table 1. Baseline characteristics of study
population
Characteristic n %
All 1108 100%
Gender
Female
Male
286
822
25.8%
74.2%
BMI
Underweight
Normal weight
Overweight
544
547
17
49.1%
49.4%
1.5%
Clinical stage at
baseline
Stage 1 and 2
Stage 3 and 4
365
743
32.9%
67.1%
CD4 cell counts at
baseline
< 50
50-100
828
280
74.3%
25.7%
HBsAg status
Positve
Negative/Not
performed
123
985
11.1%
88.9%
Anti-HCV status
Positve
Negative/Not
performed
278
830
25.1%
74.9%
Median IQR
Age (year) 36 30-41
BMI (kg/m2) 18.8 16.9-20.4
Serum creatinine
(mg/dL)
0.89 0.74-1.01
Table 1 showed that the median age of the
study population was 36 (IQR 30-41), median BMI
was 18.8 kg/m2 (IQR 16.9-20.4) and median serum
creatinine was 0.89 mg/dL (IQR 0.74-1.01). Patients
were commonly male (74.2%), underweight or
normal weight (49.1% and 49.4%, respectively). At
baseline, 67.1% of the study group was in HIV clinical
stage 3 and 4, 74.3% had CD4 cell counts lower than
50 compared to 25.7% counts between 50 and 100.
Also, the proportion of patients had positive HBV
and HCV results were 11.1% and 25.1% respectively.
Comparison of estimated GFR calculated by
three equations
According to table 2, the mean eGFR of the
study population calculated by both CKD-EPI
and MDRD equation was approximately the
same overall (103, p=0.144, paired t-test) and in
most subgroups. eGFR calculated by MDRD was
statistically higher than CKD-EPI in subgroups male,
underweight, clinical stage 3-4, and HCV-positive
result (p<0.05, paired t-test). Female patients had
higher eGFR calculated by the CKD-EPI equation
than the MDRD equation (p=0.002, paired t-test).
In contrast, the mean eGFR defined by the CG
equation was statistically lower than the CKD-EPI
equation in overall and most subgroups except
overweight patients (p<0.05, paired t-test)
124
Journal of Medicine and Pharmacy, Volume 12, No.07/2022
Table 2. Comparison of eGFR by MDRD and CG to CKD-EPI equation
Characteristic CKD-EPI eGFR
(mL/min/1.73m2)
MDRD eGFR
(mL/ min/1.73m2)p value CG eGFR
(mL/min /1.73m2)
Overall 103 (89-117) 103 (84-117) 0.144a94 (78-107)
Gender Female 100 (84-117) 98 (77-114) 0.002a93 (76-108)
Male 103 (91-117) 105 (86-118) 0.001a95 (79-106)
BMI Underweight 104 (90-119) 106 (86-122) 0.012a92 (76-105)
Normal 101 (88-115) 101 (84-114) 0.377a96 (81-109)
Overweight 96 (81-117) 96 (77-119) 0.948a105 (82-125)
Clinical stage at
baseline
Stage 1 and 2 101 (88-115) 100 (84-113) 0.120a94 (79-106)
Stage 3 and 4 103 (90-118) 105 (85-120) 0.011a94 (78-108)
CD4 cell counts
classification
< 50 103 (90-117) 104 (85-118) 0.163a94 (78-106)
50-100 102 (88-116) 102 (82-116) 0.620a95 (79-108)
HBsAg status Positve 103 (90-117) 103 (85-117) 0.897a94 (78-105)
Negative/Not
performed 103 (89-117) 103 (84-117) 0.112a94 (78-108)
Anti-HCV status Positve 104 (93-117) 106 (87-120) 0.019a96 (79-108)
Negative/Not
performed 102 (89-117) 102 (84-117) 0.753a94 (78-107)
apaired t-test
Table 3. Agreement of eGFR calculated by CKD-EPI and MDRD equations
eGFR classification eGFR–CKD-EPI (mL/min/1.73 m2)Total
≥ 90 60-90 30-60 15-30 < 15
eGFR-MDRD
(mL/min/1.73 m2)
≥ 90 719
(88.0%)
1
(0.4%) 0 0 0 720
(65.0%)
60 - 90 98
(12.0%)
255
(95.5%) 0 0 0 353
(31.8%)
30 - 60 011
(4.1%)
21
(100%) 0 0 32
(2.9%)
15 - 30 0 0 0 3
(100%) 03
(0.3%)
< 15 0 0 0 0 0 0
Total 817
(73.7%)
267
(24.1%)
21
(1.9%)
3
(0.3%) 01108
(100%)
Bold numbers in table 3 indicated the number of patients classified to the same CKD stage according to
both compared methods. Chronic kidney disease as eGFR < 60 was present at baseline in 2.2% (CKD-EPI) and
3.2% (MDRD). Substantial agreement was observed between CKD-EPI and MDRD- derived eGFR band, as the
agreement percentage was 90.1% and kappa = 0.7762 (p < 0.001, kappa statistic). The best agreement was
observed for those with eGFR < 90.
125
Journal of Medicine and Pharmacy, Volume 12, No.07/2022
Table 4. Agreement of eGFR calculated by CKD-EPI and CG equations
eGFR classification eGFR CKD-EPI (mL/min/1.73 m2) Total
≥ 90 60 - 90 30 - 60 15 - 30 < 15
eGFR CG
(mL/min/1.73 m2)
≥ 90 589
(72.1%) 0 0 0 0 589
(53.2%)
60 - 90 228
(27.9%)
237
(88.8%)
1
(4.8%) 0 0 466
(42.0%)
30 - 60 0 30
(11.2%)
19
(90.4%) 0 0 49
(4.4%)
15 - 30 0 0 1
(4.8%)
3
(100%) 04
(0.4%)
< 15 0 0 0 0 0 0
Total 817
(73.7%)
267
(24.1%)
21
(1.9%)
3
(0.3%) 01108
(100%)
Bold numbers in table 4 indicated the number of patients classified to the same CKD stage according to
both compared methods. Chronic kidney disease as eGFR < 60 was present at baseline in 2.2% (CKD-EPI) and
4.8% (CG). Moderate agreement was observed between CKD-EPI and CG derived eGFR band, as agreement
percentage was 76.53% and kappa = 0.536 (p < 0.001, kappa statistic). The best agreement observed for
those with eGFR < 90. Nearly 28% of patients with stage 1 eGFR measurements by CKD-EPI had stage 2
measurements by CG.
Table 5. Agreement of eGFR calculated by CKD-EPI and CG equations in patient with CD4 cell counts
classification <50
eGFR classification eGFR CKD-EPI (mL/min/1.73 m2)Total
≥ 90 60 - 90 30 - 60 15 - 30
eGFR CG
(mL/min/1.73 m2)
≥ 90 443
(71.6%) 0 0 0 443
(53.5%)
60 - 90 176
(28.3%)
169
(88.9%)
1
(6.3%) 0346
(41.8%)
30 - 60 0 21
(11.1%)
14
(87.4%) 035
(4.2%)
15 - 30 0 0 1 (6.3%) 3
(100%)
4
(0.5%)
Total 619
(73.7%)
190
(24.1%)
16
(1.9%)
3
(0.3%)
828
(100%)
Table 6. Areement of eGFR calculated by CKD-EPI and CG equations in patient with CD4 cell counts
classification > 50
eGFR classification eGFR CKD-EPI (mL/min/1.73 m2) Total
≥ 90 60 - 90 30 - 60
eGFR CG
(mL/min/1.73
m2)
≥ 90 146
(73.7%) 0 0 146
(52.1%)
60–90 52
(26.3%)
68
(88.3%) 0120
(42.9%)
30–60 0 9
(11.7%)
5
(100%)
14
(5.0%)
Total 198
(70.8%)
77
(27.5%)
5
(1.8%)
280
(100%)