
Genome Biology 2006, 7:R46
comment reviews reports deposited research refereed research interactions information
Open Access
2006Lainget al.Volume 7, Issue 6, Article R46
Research
Analysis of gene expression in operons of Streptomyces coelicolor
Emma Laing*†, Vassilis Mersinias‡, Colin P Smith‡ and Simon J Hubbard*
Addresses: *Faculty of Life Sciences, The University of Manchester, Manchester M13 9PT, UK. †Current Address: School of Biomedical and
Molecular Sciences, University of Surrey, Guildford GU2 7XH, UK. ‡Functional Genomics Laboratory, School of Biomedical and Molecular
Sciences, University of Surrey, Guildford GU2 7XH, UK.
Correspondence: Simon J Hubbard. Email: simon.hubbard@manchester.ac.uk
© 2006 Laing et al.; licensee BioMed Central Ltd.
This is an open acess article distributed under the terms of the Creative Commons Attribution License (http://creativecommons.org/licenses/by/2.0), which
permits unrestricted use, distribution, and reproduction in any medium, provided the original work is properly cited.
Gene expression in operons<p>Analysis of the relative transcript levels of intra-operonic genes in <it>Streptomyces coelicolor </it>suggests significant levels of inter-nal regulation.</p>
Abstract
Background: Recent studies have shown that microarray-derived gene-expression data are useful
for operon prediction. However, it is apparent that genes within an operon do not conform to the
simple notion that they have equal levels of expression.
Results: To investigate the relative transcript levels of intra-operonic genes, we have used a Z-
score approach to normalize the expression levels of all genes within an operon to expression of
the first gene of that operon. Here we demonstrate that there is a general downward trend in
expression from the first to the last gene in Streptomyces coelicolor operons, in contrast to what we
observe in Escherichia coli. Combining transcription-factor binding-site prediction with the
identification of operonic genes that exhibited higher transcript levels than the first gene of the
same operon enabled the discovery of putative internal promoters. The presence of transcription
terminators and abundance of putative transcriptional control sequences in S. coelicolor operons are
also described.
Conclusion: Here we have demonstrated a polarity of expression in operons of S. coelicolor not
seen in E. coli, bringing caution to those that apply operon prediction strategies based on E. coli
'equal-expression' to divergent species. We speculate that this general difference in transcription
behavior could reflect the contrasting lifestyles of the two organisms and, in the case of
Streptomyces, might also be influenced by its high G+C content genome. Identification of putative
internal promoters, previously thought to cause problems in operon prediction strategies, has also
been enabled.
Background
The analysis of gene expression patterns observed over a
range of conditions and time points has become widely used
in modern biology to discover relationships between different
genes in a genome. This can involve clustering genes into co-
expressed sets to try and predict common functions and reg-
ulatory relationships, or to determine differential expression
in different conditions to provide insight into the function of
specific genes. Additionally, in prokaryotic organisms, the
relationships inferred from gene co-expression should also
provide clues to the organization of genes into operons and
regulons. Since operons are, by definition, a transcriptional
unit containing genes that are co-regulated as a single poly-
cistronic message, they are, therefore, deemed to be
Published: 2 June 2006
Genome Biology 2006, 7:R46 (doi:10.1186/gb-2006-7-6-r46)
Received: 22 December 2005
Revised: 3 March 2006
Accepted: 9 May 2006
The electronic version of this article is the complete one and can be
found online at http://genomebiology.com/2006/7/6/R46
R46.2 Genome Biology 2006, Volume 7, Issue 6, Article R46 Laing et al. http://genomebiology.com/2006/7/6/R46
Genome Biology 2006, 7:R46
functionally similar. Hence, an understanding of operon
structure and regulation forms a basis on which to build reg-
ulatory networks.
Given the importance of operons to prokaryotic gene function
and regulation, several approaches have been developed to
try and predict them, exploiting genome sequences and other
related features. As operon structure has been observed to be
relatively poorly conserved [1-4] non-homology based predic-
tion of operons has predominated. These methods use the
basic principles that genes within the same operon are con-
trolled by a single promoter, tend to be close together [5], ter-
minate at a single transcription terminator, and are
transcribed at similar levels. Several groups have developed
computational methods to predict operons that adopt these
principles, either through the use of sequence information
alone [6] or by combining it with microarray data [7,8] and/
or by including functional annotation [5,9-11] in Escherichia
coli or Bacillus subtilis. The use of microarray data and/or
functional data improves the quality of operon prediction
above that achieved from sequence alone and in addition
offers some experimental validation of the predictions
[7,8,11].
Through the presence of a promoter(s) and other regulatory
features such as cis-acting transcription factor-binding sites
upstream of the first gene of an operon, it is generally
assumed that genes within an operon are expressed at equal
levels. Typically, this equal expression is measured through
distance metrics such as Pearson correlation or Euclidean
distance where a score of 1 or 0 (respectively) is considered to
be more likely with operonic pairs than non-operonic pairs.
Indeed, recent studies in E. coli [8] and B. subtilis [7] have
shown that this is the case, with operonic pairs of genes show-
ing high correlation in gene expression using either metric.
However, although microarray data are useful in predicting
operons, the ideal condition of perfectly correlated gene
expression, even within well characterized operons, is not
observed experimentally, and the distinction between oper-
onic and non-operonic pairs is not straightforward.
In the light of these findings we were motivated to analyze the
patterns of expression across documented operons in Strep-
tomyces coelicolor, an actinomycete with a high G+C content
genome that is responsible for the production of about two-
thirds of all natural antibiotics currently available, and to
compare them with our knowledge of known E. coli operons.
This was driven from an interest in S. coelicolor itself, which
is a complex bacterium equipped with an unusually large
number of transcription factors, including 65 sigma factors
[12], and also to provide a third, phylogenetically diverse,
bacterial species in which to examine operon-expression rela-
tionships. Furthermore, we use the determined pattern of
expression across operons to identify potential internal cis-
acting control sites by combining microarray-derived expres-
sion profiles with transcription factor binding site (TFBSs)
and terminator prediction algorithms. This study reveals that
the control of gene expression in operons in Streptomyces
differs from, and is more complex than that observed in E.
coli and B. subtilis, and is likely to demonstrate more internal
control.
Results and discussion
In order to compare expression levels of genes within oper-
ons, we considered several metrics, concluding that the Pear-
son correlation coefficient provides a superior measure of the
direction or change in gene expression over a set of experi-
ments. This has also been observed by other workers [7] and
suggests that the gene expression profiles of operonic mem-
bers are co-ordinated (that is, go up and down in a correlated
fashion) but not necessarily in terms of absolute expression
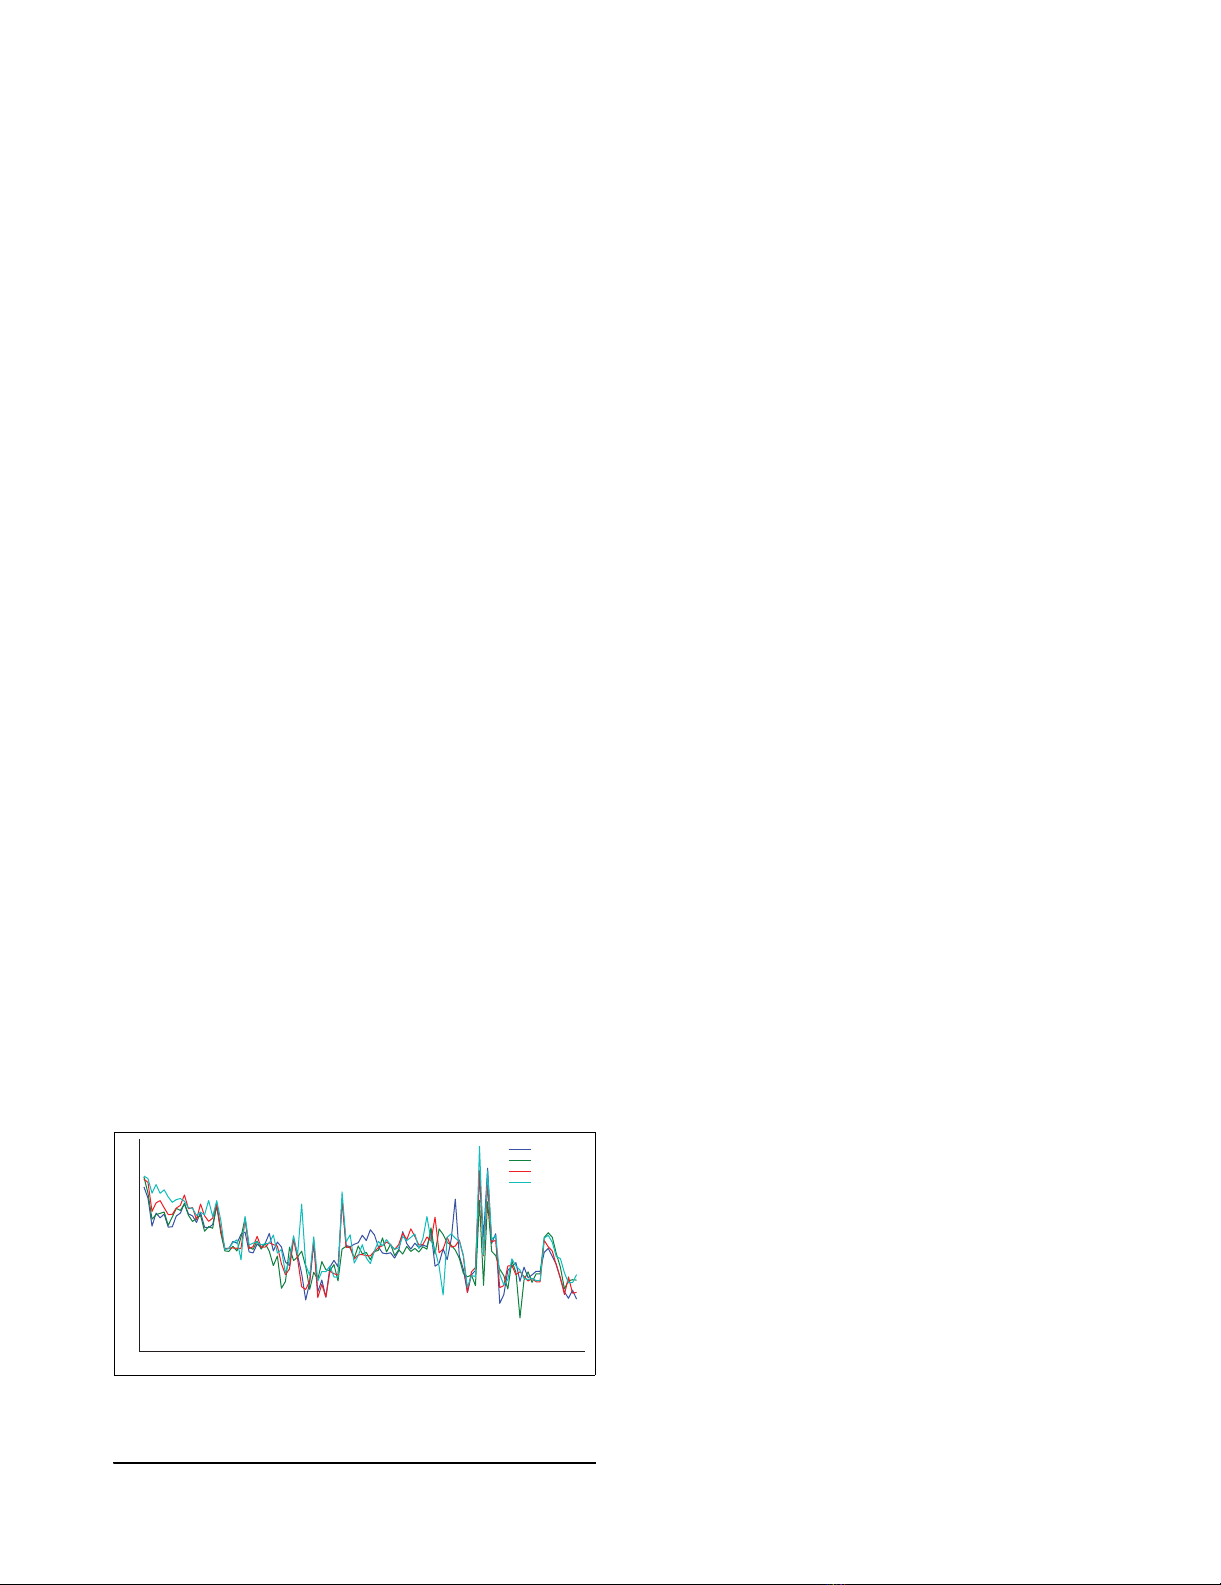
level. This idea is illustrated in Figure 1, which depicts the
normalized expression profile of 107 experiments for each of
the four genes found within the known S. coelicolor rspL-tuf1
operon [13]. Figure 1 illustrates cases where genes in the same
operon have similar trajectory patterns over a variety of
experiments, but varying expression levels for individual
experiments.
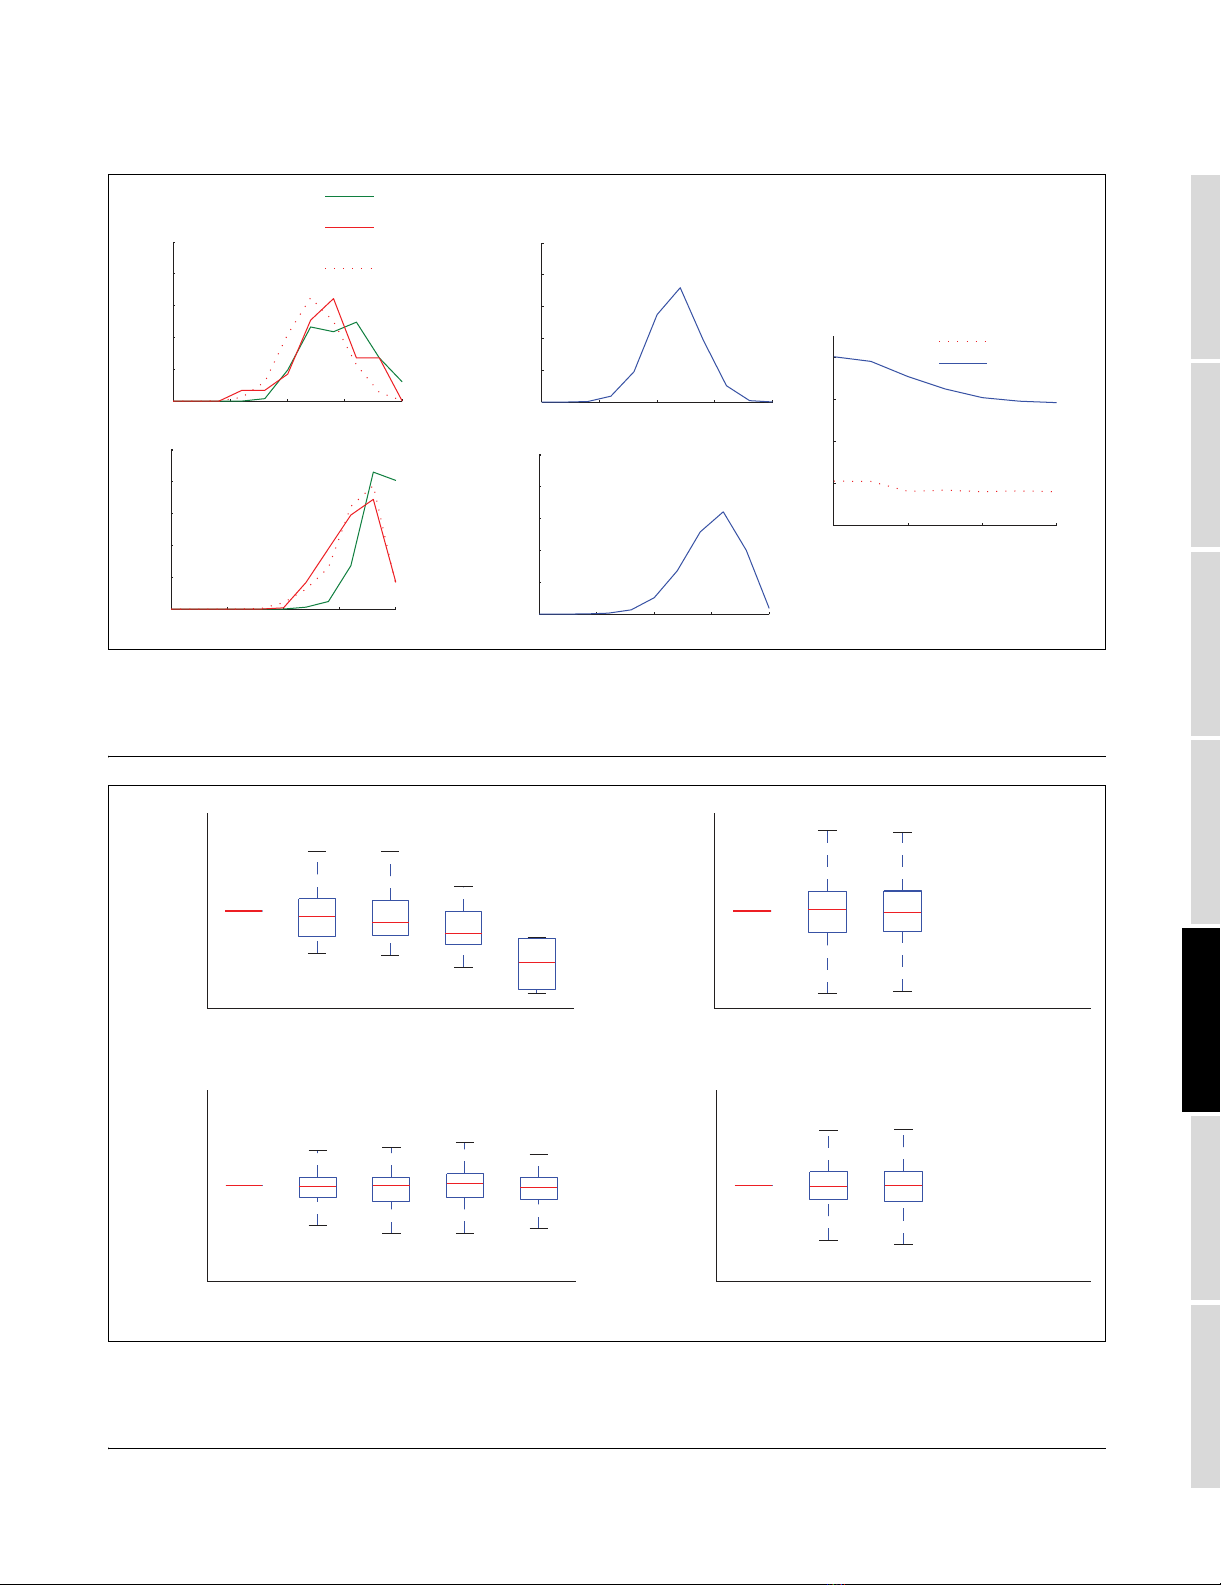
When the normalized expression levels of genes within oper-
ons are compared in S. coelicolor and E. coli (Figure 2a,c), the
intra-operonic pairs show a higher degree of correlation than
those not in operons, using either of our definitions for non-
operonic (either through direction, or crossing a true operon
boundary). For example, the mean correlation values in S.
coelicolor are 0.34, 0.26, 0.14 for known operons, non-oper-
ons (via direction), and non-operons (via boundaries),
respectively. The equivalent values in E. coli are 0.74, 0.53,
0,54. However, the trend is more marked between known
operonic gene pairs and randomly selected gene pairs (p <
0.01 after t test; Figure 2b,d). Interestingly, the most signifi-
cant trend is noted between random gene pairs in E. coli and
S. coelicolor, where randomly selected gene pairs are signifi-
cantly (p < 0.01 after t test) more highly correlated than with
mean correlation coefficients of 0.4 and 0.06, respectively
(Figure 2b,d). This is also backed up by Figure 2e, which
Example operon expression profileFigure 1
Example operon expression profile. Expression profile across all 107
experiments for all genes within the rspL-tuf1 operon in S. coelicolor.
0 102030405060708090100110
−6
−4
−2
0
2
4
6
Experiments
Normalised log(2) expression
SCO4659
SCO4660
SCO4661
SCO4662
http://genomebiology.com/2006/7/6/R46 Genome Biology 2006, Volume 7, Issue 6, Article R46 Laing et al. R46.3
comment reviews reports refereed researchdeposited research interactions information
Genome Biology 2006, 7:R46
Correlations in intra-operonic and non-operonic gene expressionFigure 2
Correlations in intra-operonic and non-operonic gene expression. Correlations in intra-operonic and non-operonic gene expression in (a) S. coelicolor and
(c) E. coli. Random gene pair correlation distribution (after 10,000 simulations) in (b) S. coelicolor and (d) E. coli. (e) Shows upstream intergenic distance
versus Pearson correlation distributions for S. coelicolor and E. coli.
Variation in generalised operon gene expressionFigure 3
Variation in generalised operon gene expression. Box plot diagrams for all Zop,i values calculated for genes at position k in (a) all known S. coelicolor
operons, (b) adjacent genes known not to be in an operon in S. coelicolor, (c) all known E. coli operons, and (d) adjacent genes known not be in an operon
in E. coli.
−50 50 150 250
0
0.2
0.4
0.6
0.8
Intergenic distance (50nt bins)
Pearson correlation
(e)
−1 −0.5 0 0.5 1
0
0.1
0.2
0.3
0.4
0.5
(d)
−1 −0.5 0 0.5 1
0
0.1
0.2
0.3
0.4
0.5
Pearson correlation
Frequency
(c)
−1 −0.5 0 0.5 1
0
0.1
0.2
0.3
0.4
0.5
(b)
−1 −0.5 0 0.5 1
0
0.1
0.2
0.3
0.4
0.5
(a) Operonic pairs
Non−operonic
(boundaries)
Non−operonic
(direction)
S. coelicolor
E. coli
12345
−100
0
100
(a)
12345
−100
0
100
Zop,i
Gene position in operon
(c)
12345
−100
0
100
(b)
12345
−100
0
100
(d)

R46.4 Genome Biology 2006, Volume 7, Issue 6, Article R46 Laing et al. http://genomebiology.com/2006/7/6/R46
Genome Biology 2006, 7:R46
shows that the closer gene pairs are together (using adjacent
gene pairs on the same strand in the genome), the stronger
the correlation in their expression profiles, independent of
their operonic status. Again, the similarity in gene expression
between adjacent genes transcribed in the same direction is
much larger in E. coli compared to S. coelicolor (Figure 3e).
This has important implications for operon prediction meth-
ods that use microarray data directly or to validate predic-
tions [7,8,11,14] because, particularly in E. coli, gene
proximity is highly correlated with co-expression regardless
of whether the genes are members of the same operon.
Taken together, these results suggest that control of genes
within characterized operons in S. coelicolor is more com-
plex, and that the regulation of expression at adjacent loci is
more diverse than in E. coli. Indeed, the large differences in
gene expression patterns observed between the two species
were unexpected and we tested for bias in the data sets that
might cause this. However, we found no systematic differ-
ences in the number and type of experiments (time-course
derived data and/or single perturbations) or absence of vari-
ation of individual gene expression (measured by an entropy
value, (E Laing and S Hubbard, unpublished data)) that
would lead to higher correlations. Indeed, the latter entropy
calculations suggested there is more variation in the E. coli
data sets. The apparent increased complexity of genetic con-
trol in S. coelicolor might explain this, given the larger, more
complex genome and increased number of transcription
factors.
There is, nevertheless, increased correlation in gene expres-
sion for operonic members (Figure 2a,c) and for this reason
we analyzed expression patterns of documented operons in S.
coelicolor and E. coli. Using a Z-score normalization proce-
dure (see Materials and methods), gene expression across an
operon is normalized to the first gene of the same operon,
which allows individual gene expression patterns both within
and across operons to be compared. For every position i
within an operon the distribution of Zop,i for operonic genes at
position i can then be plotted, such that a box in the plots
illustrated in Figure 3a-d represents a gene position in a 'vir-
tual' operon. Figure 3a shows a box plot of Zop,i values for each
gene position in operons in S. coelicolor, restricted to five due
to lack of experimental data for larger operons. Figure 3a sug-
gests that operons in S. coelicolor exhibit 'polar' expression,
whereby gene expression generally decreases throughout the
operon, with successive genes having lower expression levels
than the preceding gene. This does not correspond to the
common notion that operonic genes are expressed equally.
This apparent downward trend was tested by randomly shuf-
fling gene order in the same operon set using 1,000 simula-
tions, which showed that when the order of the genes in an
operon are changed no polarity of expression is observed
(data not shown). Using the random (shuffled) Zop,i distribu-
tions for each position, p values were obtained. Although no
significance less than p < 0.05 was observed for individual
positions compared to random, the deviations from expecta-
tion for individual genes in given operons is significant, with
Z-values exceeding 20 in many instances. We suggest that the
downward trend of expression is a characteristic of S. coeli-
color operons.
It is evident that some genes do not follow the trend of down-
ward expression observed in Streptomyces operons in Figure
3a. One possible explanation for this increased expression is
the presence of internal promoters, a feature that is thought
to cause problems in operon prediction methods [6-8,11,14].
Although the prediction of promoter sequences is difficult,
TFBSs in prokaryotes tend to be proximal to a promoter [15]
and potential internal promoters were assayed by the identi-
fication of a putative TFBS. Intra-operonic genes (excluding
the initial gene of an operon) were classed as either over-rep-
resented intra-operonic genes (OIGs) with a Zop,i greater than
the µop,1 + σop,1 or non-over-represented intra-operonic genes
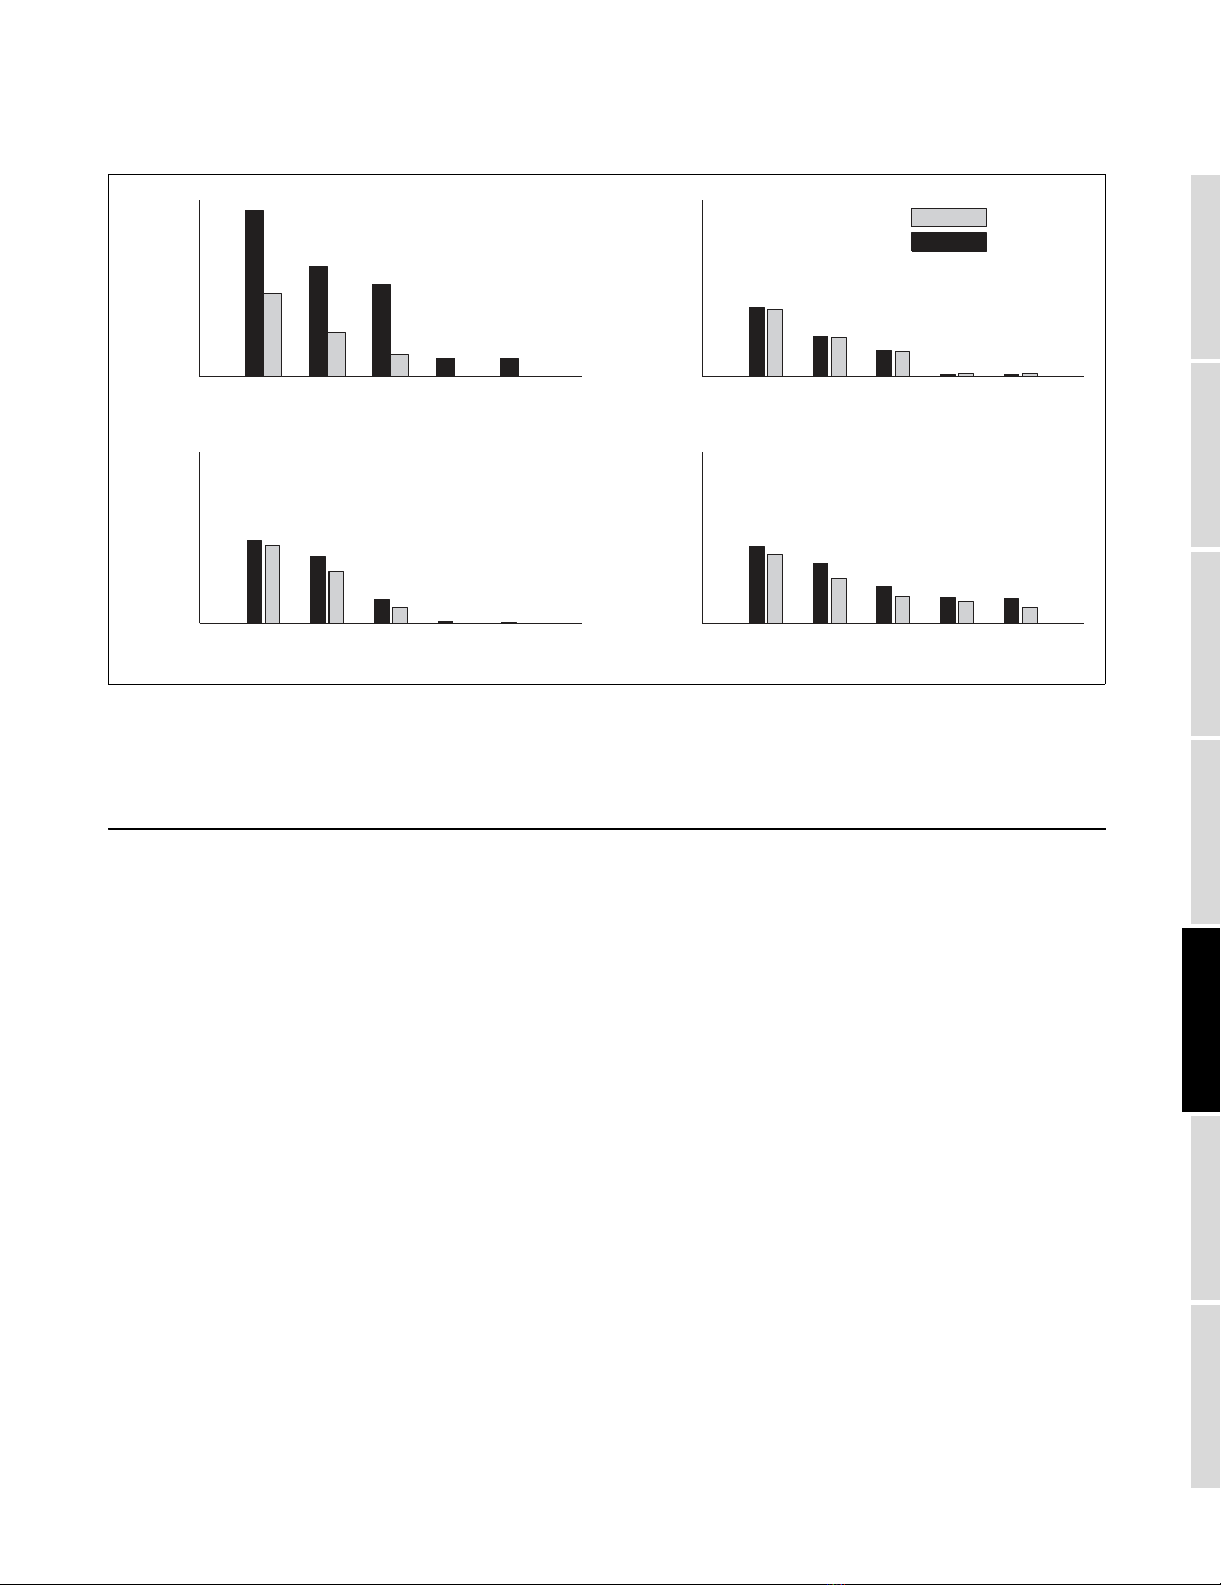
(NOIGs) with a Zop,i less than the µop,1 - σop,1. The abundance
of TFBSs within their upstream intergenic regions was stud-
ied (Figure 4). Figure 4 shows that there is a consistent over-
representation of TFBSs in the OIGS set for Streptomyces,
not present in randomly selected genes from the same operon
set, with a p < 0.05 from a chi-square test using TFBS predic-
tion thresholds mb + nσb (n = 4, 4.5, and 5).
The TFBS prediction algorithm uses position specific weight
matrices (PSWMs) to predict likely sites in the upstream
regions of candidate genes. Some genes do not possess sub-
stantial upstream non-coding sequence, and hence these
genes were filtered out in the TFBS tests shown in Figure 4 in
order to remove any potential bias. However, the gene hisB
(SCO2052) is known to have an internal promoter upstream
in E. coli but has no upstream intergenic sequence in S.
coelicolor, overlapping the upstream neighboring gene by
four bases. This gene was originally assigned to the upregu-
lated set prior to filtering and is, therefore, predicted to be
internally promoted, although our approach would not
attempt to find a putative TFBS. A substantial proportion of
the gene sets fall into this category; 48% of the upregulated
data set and 27% of the normal data set had no upstream
intergenic sequence. The upregulated genes that fall into this
category may well be similar cases in which internal tran-
scription initiation occurs but the internal promoter lies in an
intragenic upstream sequence. The significant difference
between TFBS abundance for upregulated and normal genes
using this method would suggest that TFBS prediction algo-
rithms capable of analyzing overlapping upstream regions
should be developed.
There are several reasons why NOIGs have TFBSs identified
by our prediction methods: first, it could be that those genes
in the majority of cases do not show any upregulation in our
restricted experiments but there are conditions when they are
upregulated; second, the promoter is unregulated and consti-
tutive activity only enables the gene to reach basal expression
http://genomebiology.com/2006/7/6/R46 Genome Biology 2006, Volume 7, Issue 6, Article R46 Laing et al. R46.5
comment reviews reports refereed researchdeposited research interactions information
Genome Biology 2006, 7:R46
[16]; third, a binding site is present and used in termination,
a phenomenon found in Spiroplasma citri [17]; fourth, exper-
imental error, where expression measurements in the profile
are less than the true biological amount; or fifth, due to false
positives within our TFBS set, although few false positives are
expected at the prediction threshold of mb + 5σb [18].
Only 4 of 55 NOIGs were predicted to have a binding site with
a threshold of mb + 5σb; SCO3358 (cseB), SCO2610 (mreC),
SCO5319 (whiE protein II), and SCO5625 (tsf). No additional
information about the transcriptional status of SCO2610 or
SCO5319 could be found and, consequently, information for
the two remaining genes is briefly discussed here. SCO3358 is
the third gene of the sigE operon, an operon that has been
found to be entirely transcribed only 10% of the time due to
termination downstream of the first gene sigE [19]. In agree-
ment with this, SCO3358 has reduced expression compared
to the first gene of the operon. The binding site we predicted
upstream of SCO3358 (cseB) may offer an additional route to
activate this gene in the operon, as the product of SCO3358
regulates the upstream promoter of the operon [19].
SCO5625 (tsf), is the second gene of a bicistronic operon and
is expressed less than the first gene (rpsB) by a ratio of 2:1 in
S. coelicolor [13], consistent with the array data presented
here. However, the authors of this work [13] could not deduce
the likely mechanism and speculated that attenuation, if
occurring, may be brought about by a 16 base-pair inverted
repeat just upstream of tsf in S. coelicolor, similar to that
found in E. coli. Alternatively, a similar attenuation mecha-
nism in S. coelicolor to that proposed for the rpsB-tsf operon
of Spiroplasma citri may be responsible, where a DNA bind-
ing protein interacts with the region immediately down-
stream of rpsB [20]. The binding site found to be bound by a
protein just upstream of tsf (although how it would influence
transcription is not known) by Le Dantec et al. [20] was an
AT-rich inverted repeat that did not resemble a typical termi-
nator sequence. Interestingly, the inverted repeat predicted
by our method to be in the upstream region of tsf is also AT-
rich. From the 23 OIGs, 5 genes were predicted to have a
TFBS (using the threshold of mb + 5σb); SCO2389 (acpP),
SCO0712 (lipR), SCO2390 (fabF), SCO4662 (tuf1), and
SCO5356 (thrB). Table 1 details known information about the
regulation of these genes, where all but one of the OIGs with
predicted binding sites are known to have a promoter in their
upstream regions. Although formally classified as a monocis-
tronic operon in Streptomyces, thrB is included as it is tran-
scriptionally linked to a bicistronic operon involved in the
same pathway immediately upstream in E. coli, and often
part of an operon in other organisms (for example, B. subtilis)
[21].
The fact that thrB was identified as an OIG and a TFBS was
also predicted is promising for operon prediction algorithm
improvement, since thrB is expressed independently in
Predicted TFBS abundance in operonsFigure 4
Predicted TFBS abundance in operons. Transcription factor binding site (TFBS) abundance in the upstream intergenic regions of intra-operonic genes with
a Zop,i greater than µop,1 + σop,1 (OIG) and genes with a Zop,i less than µop,1 - σop,1 (NOIG) when using (a) the documented S. coelicolor operon data set
reduced to genes that have an upstream intergenic distance greater than 0, (b) a random selection from documented S. coelicolor operons, (c) Li et al.'s
[17] TFBS prediction on documented E. coli operons, and (d) our TFBS prediction on documented E. coli operons. NOIG, non-over-represented intra-
operonic genes; OIG, over-represented intra-operonic genes.
4 4.5 5 5.5 6
0
20
40
60
80
(a)
4 4.5 5 5.5 6
0
20
40
60
80
(b)
4 4.5 5 5.5 6
0
20
40
60
80
(c)
Transcription factor binding site prediction threshold
Abundance %
4 4.5 5 5.5 6
0
20
40
60
80
(d)
NOIG
OIG


![PET/CT trong ung thư phổi: Báo cáo [Năm]](https://cdn.tailieu.vn/images/document/thumbnail/2024/20240705/sanhobien01/135x160/8121720150427.jpg)


