HUE JOURNAL OF MEDICINE AND PHARMACY ISSN 3030-4318; eISSN: 3030-4326 127
Hue Journal of Medicine and Pharmacy, Volume 14, No.6/2024
Prognostic values of MESO index in patients with decompensated
cirrhosis
Nguyen Thi Thuan1, Nguyen Manh Huy1, Nguyen Duc Thao1, Tran Van Huy2*
(1) Department of Gastroenterology, Danang Hospital
(2) Department of Internal Medicine, University of Medicine and Pharmacy, Hue University
Abstract
Background: The models for end-stage liver disease (MELD) and serum sodium (SNa) are common prognostic
markers in cirrhosis. A novel score, MELD to SNa ratio (MESO), was developed to amplify the opposing effect of
MELD and SNa on outcome prediction. The aims of this study were to evaluate the prognostic value of MELD
score for complications (acute variceal bleeding, spontaneous bacterial peritonitis, hepatic encephalopathy,
hepatorenal syndrome and mortality) in decompensated cirrhotic patients 6 months after hospitalization.
Patients and methods: 123 patients with decompensated cirrhotic, admitted to Da Nang between February
2021 and May 2022, were included. Each patients MESO score was calculated at the time of admission. All
patients were followed up for 6 months to assess the following events:acute variceal bleeding, spontaneous
bacterial peritonitis, hepatic encephalopathy, hepatorenal syndrome and mortality. Results: The mean MESO
score for all patients was 1.3 ± 0.4; it was 1.0 ± 0 for patients in group Child-Pugh A; 1.04 ± 0.1 for Child-Pugh B;
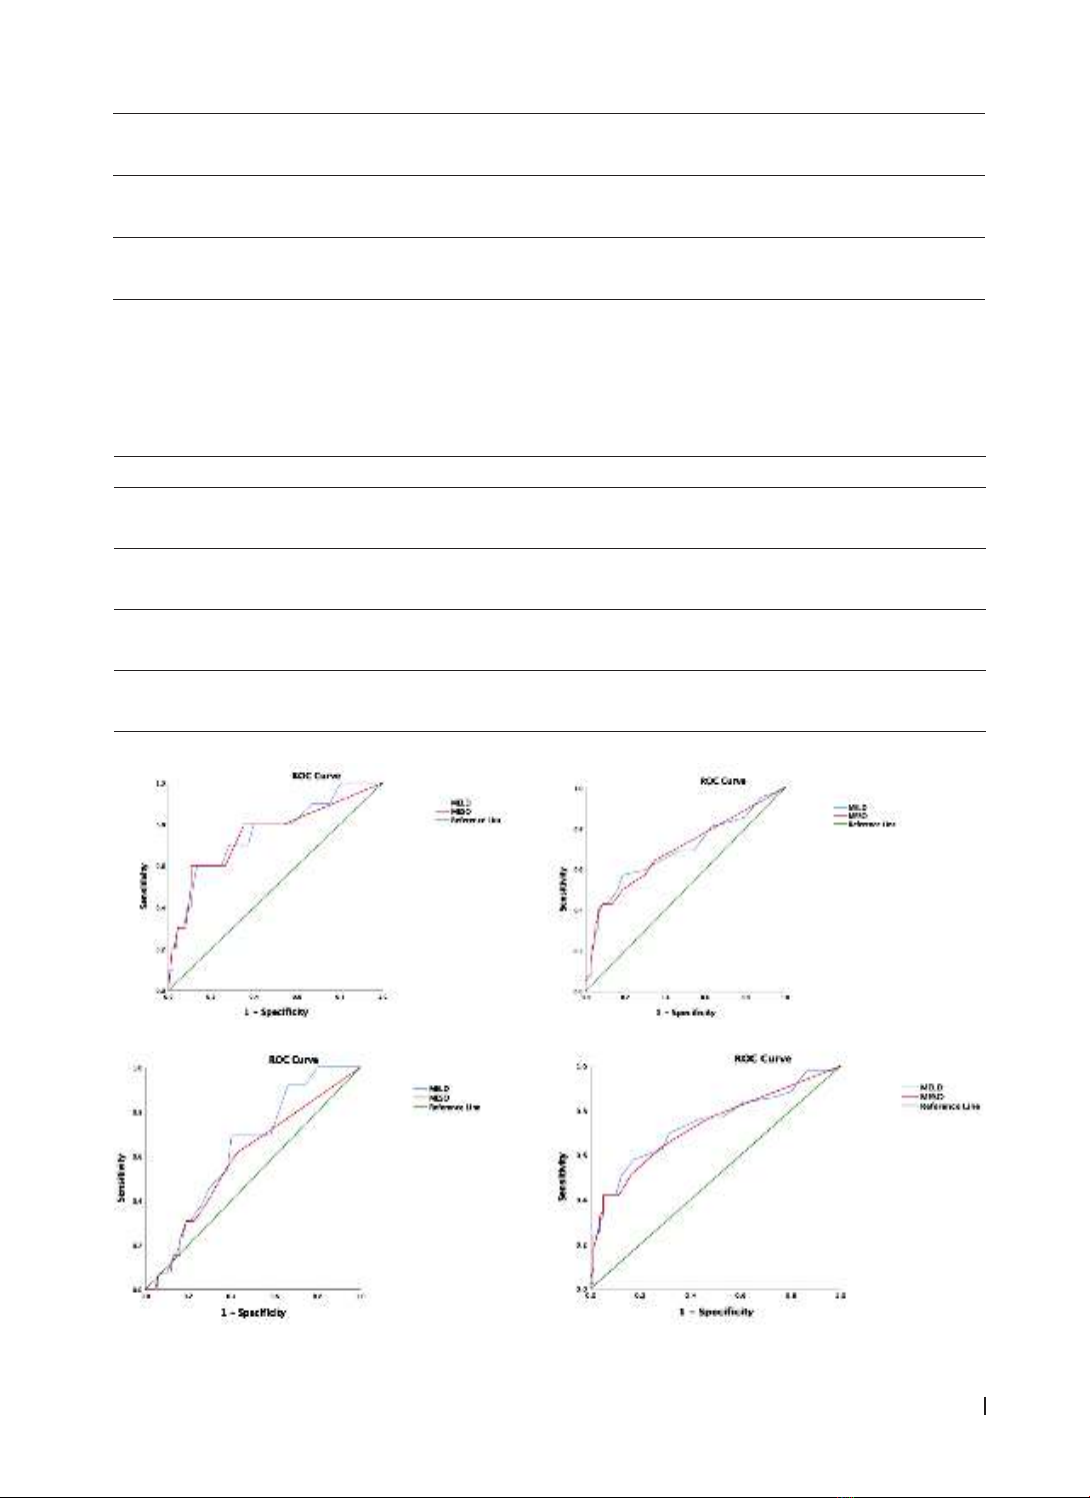
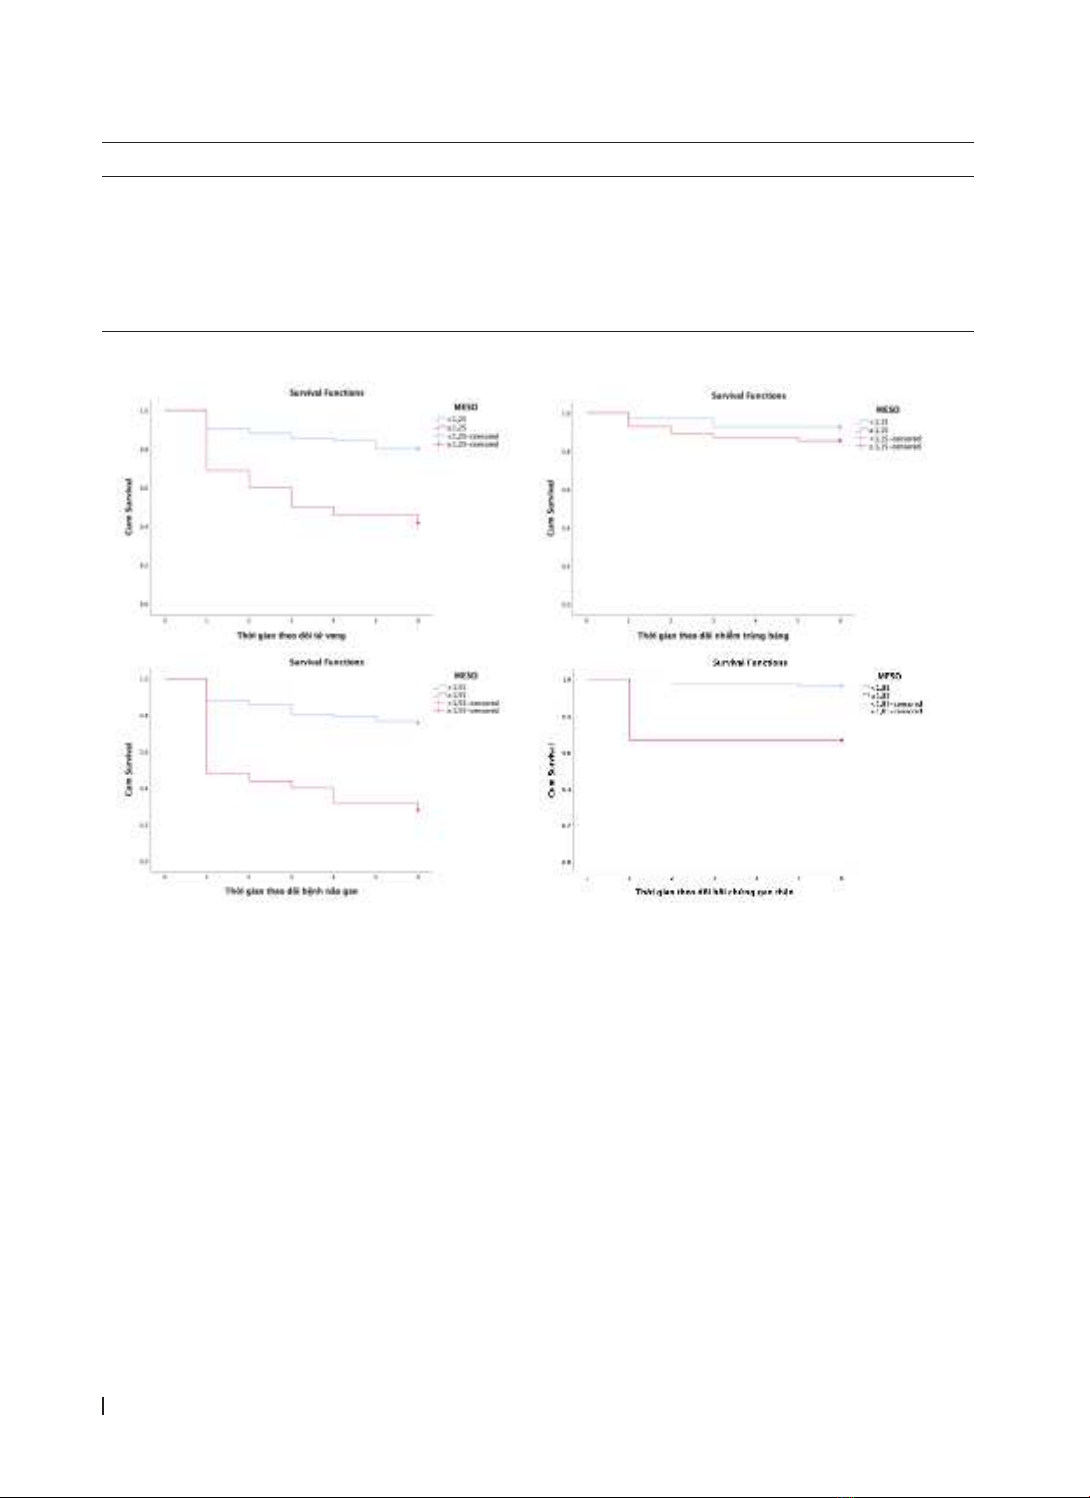
and 1.5 ± 0.5 for Child-Pugh C. MESO score to predict mortality for 6 months after hospitalization (with a cut-off
1.25; AUC 0.74; sensitivity and specificity are 65.1% and 75%) and to predict hepatorenal syndrome (with a cut-
off 1.85; AUC 0.75; sensitivity and specificity are 60.0% and 89.4%), and to predict hepatic encephalopathy (with
a cut-off 1.55; AUC 0.69; sensitivity and specificity are 42.9% and 91.4%). The MESO score had no prognostic
value for acute variceal bleeding and spontaneous bacteremia peritonitis 6 months after hospitalization in this
study. Conclusions: MESO score is a valuable prognostic tool of mortality, hepatorenal syndrome, and hepatic
encephalopathy in decompensated cirrhotic patients six months after hospitalization.
Keywords: cirrhosis, MELD score, MESO score.
Corresponding Author: Tran Van Huy
Email: tvanhuy@hueuni.edu.vn; tvhuy@huemed-univ.edu.vn
Received: 19/9/2024; Accepted: 14/11/2024; Published: 25/12/2024
DOI: 10.34071/jmp.2024.6.18
1. INTRODUCTION
Cirrhosis is a common disease and a major
cause of death. Globally, mortality cases of cirrhosis
increased by 47.15% [1]. The common causes of death
in cirrhosis are the complications of decompensated
cirrhosis, especially refractory ascites, hepatorenal
syndrome, and hepatic encephalopathy.
Hyponatremia is one of the independent
prognostic factors of mortality in patients with
decompensated cirrhosis and thus sodium-based
scores, including MELD-Na, IMELD… have been shown
to have prognostic values in cirrhotic patients [2], [3].
Recently, MESO (MELD to sodium ratio ), by
amplyfing the opposite effect of MELD and serum
sodium, have been shown by some studies a good
prognostic value in patients with decompensated
cirrhosis. Data about prognostic value of the MESO
score in Vietnamese patients of cirrhosis is still
limited. We conducted this study to survey the MESO
score in patients with decompensated cirrhosis and
to assess the value of the MESO score in predicting
some complications and mortality in this group of
patients.
2. PATIENTS AND METHODS
2.1. Research subjects
Criteria for choosing a patient
Patients diagnosed with decompensated cirrhosis
treated at the Department of Gastroenterology, Da
Nang Hospital, from February 2021 to May 2022.
Diagnostic criteria for decompensated cirrhosis
Clinically, it is based on two syndromes:
hepatocellular insufficiency syndrome and portal
hypertension syndrome.
Cirrhosis is decompensated when there is one of
the following manifestations: ascites, variceal bleeding,
jaundice, and hepatic encephalopathy, hepatorenal
syndrome, spontaneous bacterial peritonitis, and
hyponatremia in patients with ascites [4].
Patient exclusion criteria
Cirrhotic patients with an abdominal CT scan
or abdominal ultrasound suspect hepatocellular
carcinoma. Cirrhotic patients with comas suspected
of other causes: stroke, poisoning. The patients did
not have enough tests to be classified according
to MESO, Child-Pugh. Cirrhotic patients with pre-
existing kidney disease.
HUE JOURNAL OF MEDICINE AND PHARMACY ISSN 3030-4318; eISSN: 3030-4326
128
Hue Journal of Medicine and Pharmacy, Volume 14, No.6/2024
2.2. Method of proceeding
Select patients with cirrhosis according to the
selection criteria.
Data recorded: age, gender, occupation, and
history of liver disease. Symptoms: anorexia,
fatigue, palmar erythema, spider nevus, ascites,
hepatomegaly, jaundice, edema of the lower
extremities, and splenomegaly. Determine the cause
of cirrhosis due to alcohol, HBV, HCV, alcohol and
viral causes. Platelets, prothrombin time, INR, ALT,
AST, albumin, bilirubin, creatinine, serum sodium,
and upper gastrointestinal endoscopy with or
without esophageal varices were all measured.
MELD index = 3.8 x ln(serum bilirubin [mg/dL) +
11.2 x ln(INR) + 9.6 x ln(serum creatinine [mg/dL) +
6.4 [5].
MESO index = (MELD/serum Na mEq/l) x 10 [12].
Child-Pugh scale divided into levels: Child-Pugh
A: 5-6 points, Child-Pugh B: 7-9 points, Child-Pugh C:
10-15 points.
Follow-up within 6 months of the time of admission
should be done by direct examination and interviewing
patients or relatives by phone at least once a month for
the following events: gastrointestinal bleeding, hepatic
encephalopathy, spontaneous bacterial peritonitis,
hepatorenal syndrome, and death.
Table 1. Child-Pugh classification [6]
Clinical and Lab Criteria 1 point 2 points 3 points
Ascites None Mild to moderate Severe
Hepatic Encephalopathy Grade 0 Grade 1 or 2 Grade 3 or 4
Albumin (g/l) > 35 28 - 35 < 28
Bilirubin (umol/l) < 35 35 - 50 > 50
Prothrombin time ratio (%) 54 - 100 44 - 54 < 44
2.3. Study Design: a cross-sectional descriptive
study.
2.4. Data analysis method: according to the
medical statistics method and SPSS 26.0 software.
3. RESULTS
From February 2021 to May 2022, there were
123 patients at the Department of Gastroenterology,
Da Nang Hospital, who met the selection criteria. All
patients were followed for a period of six months.
Of the 80 patients who survived, 43 died; 75 (61%)
patients had gastrointestinal bleeding; 42 (34.1%)
patients had hepatic encephalopathy; 13 (10.6%)
patients had spontaneous bacterial peritonitis; and
10 (8.1%) patients had hepatorenal syndrome.
3.1. MESO score in patients with decompensated cirrhosis
Table 2. General characteristics of research subjects
Characteristic
Male/female, % 82.9/17.1
Mean age 54.7 ± 10.4
Etiology: alcohol/alcohol and
virus/HBV/HCV/other (%) 61/17.1/10.6/1.6/9.8
MESO score Median (Min : Max) 1.1 (1 - 1.4)
Mean 1.3 ± 0.4
Mean MELD score
Male/female 1.3 ± 0.4 /1.4 ± 0.4
Child- Pugh A/B/C 1 ± 0/1.04 ± 0.1/1.5 ± 0.5
Males were predominated. Alcohol was the most common cause. The mean MESO score was 1.3 ± 0.4,
with a statistically significant difference between the group of Child-Pugh.
Table 3. Factors related to the MESO score
Events Status MESO p
Gastrointestinal bleeding Yes 1.2 ± 0.3 <0.001
No 1.5 ± 0.5
Spontaneous Bacterial Peritonitis (SBP) Yes 1.4 ± 0.4 0.297
No 1.3 ± 0.5
HUE JOURNAL OF MEDICINE AND PHARMACY ISSN 3030-4318; eISSN: 3030-4326 129
Hue Journal of Medicine and Pharmacy, Volume 14, No.6/2024
Hepatic Encephalopathy (HE) Yes 1.6 ± 0.6 ≤0.001
No 1.2 ± 0.3
Hepatorenal Syndrome (HRS) Yes 1.8 ± 0.7 0.006
No 1.3 ± 0.4
Death Yes 1.6 ± 0.6 <0.001
No 1.2 ± 0.3
A statistically significant difference in MESO scores was between groups of patients with GI bleeding,
hepatic encephalopathy, hepatorenal syndrome, and death.
3.2. Prognostic value of the MESO score for 6-month events in patients with decompensated cirrhosis
Table 4. The area under the ROC curve and the cut-off value of the MESO score in the prognosis of
death, spontaneous bacterial peritonitis (SBP), hepatic encephalopathy (HE), hepatorenal syndrome (HRS)
occurring within 6 months of the time of admission
Events AUC 85% CI Cut-off Sensitivity Specificity p
Death 0.74 0.65 - 0.84 ≥1.25 65.1
(56.7 - 73.5)
75
(67.4 - 82.6) <0.001
HE 0.69 0.59 - 0.80 ≥1.55 42.9
(34.2 - 51.6)
91.4
(86.5 - 96.3) 0.001
SBP 0.59 0.43 - 0.74 ≥1.15 61.5
(52.9 - 70.1)
57.3
(48.6 - 66) 0.32
HRS 0.75 0.57 - 0.93 ≥1.85 60
(51.4 - 68.6)
89.4
(84 - 94.8) 0.009
Figure 1. ROC curves of MESO and MELD score for events occurring in 6 months from the time of admission
HUE JOURNAL OF MEDICINE AND PHARMACY ISSN 3030-4318; eISSN: 3030-4326
130
Hue Journal of Medicine and Pharmacy, Volume 14, No.6/2024
Table 5. Relationship between MESO and some complications in study subjects
Crude HR (95% CI) p
All complications 0.99 (0.6 - 1.6) 0.981
Death 4.2 (2.5 - 7.1) <0.001
SBP 1.4 (0.5 - 4.1) 0.570
HE 3.3 (1.9 - 5.6) <0.001
HRS 5.1 (2.0 - 13.1) 0.001
There was a statistically significant relationship between the change in MESO score and hepatic
encephalopathy, hepatorenal syndrome, and mortality.
Figure 2. MESO’s probability of not occurring events over time
4. DICUSSION
The MELD scoring system has been widely applied
in recent years and shown to predict mortality across
a broad spectrum of liver diseases in most studies
[7], [8], [9], [10]. The utilization of the MELD has
been demonstrated to have an equal or better ability
in short term or medium term outcome prediction
in comparison with the CTP system [11], [12], [13].
In addition, the application of the MELD system
has been shown to be a useful model in predicting
the outcome of patients with cirrhosis undergoing
surgical procedures for hepatocellular carcinoma or
non–hepatocellular carcinoma conditions [14], [15].
Hyponatremia often indicates a state of hepatic
decompensation in patients with liver cirrhosis and
is strongly associated with the risk of mortality [16],
Many studies have also proposed Na-containing
MELD-based prognostic models, MELD- Na has
been extensively studied and demonstrated to be
valuable in mortality prognosis [17], [18], [19], [20].
Recently, Huo et al presented a study on the MESO
score, created intuitively in patients undergoing
portal hemodynamic measurements [18].
Table 2 showed that the mean MESO score of
the research group was 1.3 ± 0.4, the highest MESO
score was 2.9, and the lowest MESO score was 1. El-
Ghannam et al. reported that the mean MESO score
was 1.259 ± 0.029 in a study of 777 patients with
decompensated cirrhosis [21]. According to Fayad,
the mean MESO score was 1.23 ± 0.55 when 123
patients with acute decompensated cirrhosis were
studied [22]. According to Lv Xiao, the mean MESO
score in cirrhotic patients was 1.1 ± 0.5, the highest
MESO was 3.2, and the lowest was 0.4 [23]. Marroni
HUE JOURNAL OF MEDICINE AND PHARMACY ISSN 3030-4318; eISSN: 3030-4326 131
Hue Journal of Medicine and Pharmacy, Volume 14, No.6/2024
et al. studied on 558 cirrhotic patients and recorded
a mean MESO score of 1.1 ± 0.4 [24].
Table 3 showed the MESO score in patients
who eventually died was 1.6 ± 0.6; in the group
of survivors, the MESO score was 1.2 ± 0.3. Thus,
the mean MESO score in the mortality group was
statistically significantly higher than in the surviving
group (p<0.001). Our results are consistent with
Jiangs: the MESO score in patients who were alive
within 3 months was 0.99 ± 0.42, in patients who
died, it was 1.59 ± 0.82, and there was a significant
difference between the 2 groups with p<0.001 [25].
Silva et al. and Mangla et al. also noted that there
was a difference in MESO score in the surviving
group and the mortality group (p<0.001) [26], [27].
In our study, the mean MESO score of the group
without gastrointestinal bleeding (1.5 ± 0.5) was
statistically significantly higher than that of the
group with gastrointestinal bleeding (1.2 ± 0. 3) with
p<0.001. Huo et al. reported that the mean MESO
score of the group with gastrointestinal bleeding
was 1.06 ± 0.56, lower than the group without
gastrointestinal bleeding complications, with a mean
value of 1.14 ± 0.54 [28].
Table 3 also showed that patients with
spontaneous bacterial peritonitis, hepatic
encephalopathy, and hepatorenal syndrome had
higher MESO scores than those without. Huo has also
found that patients with hepatic encephalopathy,
hepatorenal syndrome, and ascites infection had
higher MESO scores than the group without the
above events [22].
Table 4 showed that the MESO score cutoff for
the best 6-month mortality prognosis was 1.25 with
a sensitivity of 65.1%, a specificity of 75%, and an
area under the ROC curve (AUC) of 0.74; this was
statistically significant (p<0.001) and had a moderate
prognostic value. Our findings are consistent
with Jiangs, which had a MESO AUC in mortality
prognosis of 0.723. According to Fayad, the cut-
off value of the MESO score in predicting mortality
was 1.3 with a sensitivity of 74% and a specificity
of 78%, with an AUC of 0.784 [22]. On the other
hand, Huo et al. recorded the highest AUC of MESO
in predicting mortality at 0.86 with a sensitivity of
67% and specificity of 84% [28]. Overall, studies have
shown that the MESO score had a moderate to high
prognostic value in predicting mortality within 3 to
6 months in patients with decompensated cirrhosis.
The higher the MESO score, the worse the prognosis
and the higher risk of death.
Table 4 showed the optimal cut-off value for
predicting hepatic encephalopathy within 6 months
of the time of admission was 1.55, weak prognostic
value, area under the ROC curve (AUC=0.69), with
sensitivity and specificity values of 42.9%, 91.4%,
and statistically significant (p = 0.001), respectively.
The optimal cut-off value of the MESO score in
hepatorenal syndrome was 1.85, the area under
the ROC curve (AUC) = 0.74, which had a moderate
predictive value with a sensitivity of 60% and a
specificity of 89.4%, statistically significant (p=0.009).
According to many authors, the prognostic value
of the MESO score for gastrointestinal bleeding was
very weak [18] and in our study, the prognostic value
of the MESO score for gastrointestinal bleeding and
spontaneous bacterial peritonitis was very weak.
Probability of no events over time by MESO
Figure 2 showed the survival probability in the
group of patients with MESO score ≥1.25 was lower
than in the group of patients with MESO score <1.25
(p<0.001). After 6 months, the group of patients with
MESO score ≥1.25 only had 41.7% survival, while up
to 80% of patients in the group with MESO score <
1.25 were still alive. Hassan et al. found that patients
with MESO scores >1.2 had a higher risk of death
than patients with MESO scores <1.2 (p < 0.001)
[29]. Radisavljevie et al. found that when MESO >
1.85, the risk of death within 3 months increased
4.04 times, with p = 0.008 [30].
Figure 2 also showed that the probability of
not having spontaneous bacterial peritonitis in the
group of patients with MESO score ≥1.15 was lower
than in the group of patients with MESO score <1.15,
but this difference was not statistically significant
with p=0.19. Within 6 months of follow-up, the
group of patients with MESO score ≥1.15 and MESO
score <1.15 had rates of no spontaneous bacterial
peritonitis of 85.5% and 92.6%, respectively. The
probability of not having hepatic encephalopathy
was lower in the group of patients with MESO score
≥1.55 than in the other group; this was statistically
significant (p<0.001). Specifically, within 6 months
of follow-up, the group of patients with MESO
index ≥1.55 and the group with MESO index <1.55
had rates of no hepatic encephalopathy syndrome
of 28% and 75.5%, respectively. Likewise, within 6
months of follow-up, the probability of not having
hepatorenal syndrome in the group of patients with
MESO index ≥1.85 was lower than that in the group
with HRS, this difference was statistically significant
with p<0.001. Specifically, the group of patients with
MESO index ≥1.85 and MESO <1.85 had rates of no
occurrence of hepatorenal syndrome of 66.7% and