
53
Journal of Medicine and Pharmacy, Volume 11, No.07/2021
Method development for the determination of metformin in human
plasma by capillary zone electrophoresis
Thai Thi Thu Hien1, Thai Tran Minh Thi1, Nguyen Van Dung1, Tran Thi Tien Xinh2, Thai Khoa Bao Chau1*
(1) Faculty of Pharmacy, Hue University of Medicine and Pharmacy, Hue University, Vietnam
(2) Faculty of Biochemistry, Hue University of Medicine and Pharmacy, Hue University, Vietnam
Abstract
Background: Metformin is an oral antidiabetic drug from the biguanide class and it is the first-line drug
chosen for the treatment of type 2 diabetes. This is a drug on the list of pharmaceutical substances required
to report bioequivalence study data when registering the drug. Objectives: (1) To develope a capillary zone
electrophoresis method for determining metformin hydrochloride in human plasma. (2) To validate the
method. Materials and methods: Human plasma, metformin hydrochloride, ranitidine hydrochloride. The
method was developed and validated according to US-FDA 2018 and EMA 2011. Results: The procedure was
developed by using the Agilent 7100 CE electrophoresis system with ranitidine hydrochloride as an internal
standard. Sample preparation was accomplished through protein precipitation with acetonitrile. The optimal
electrophoresis conditions are as follows: uncoated fused-silica capillary column of a total length of 40 cm
(31.5 cm effective length, inner diameter 100 µm), phosphate buffer solution 100 mM (pH = 4), the voltage
applied to both capillary ends of 15 kV, the inlet end of capillary dipped in water before sample injection,
sample injection mode of 50 mBar in 7 seconds, using a PDA detector at 232 nm. The analysis method was
validated according to the requirements of the US-FDA 2018 and EMA 2011 with the following criteria: system
suitability with RSD < 3%; good specificity; the calibration curves were linear (r2 ≥ 0.98) in the concentration
range of 0.1 – 4.0 µg/ml for metformin in human plasma; the lower limit of quantification was 0.1 µg/ml;
the intra-day and inter-day accuracy were 99.41 – 105.28% and 92.47 – 106.26%, respectively; the intra-day
and inter-day precision were 1.99 – 4.03% and 3.11 – 6.05%, respectively; the mean recovery of ranitidine
(internal standard) was 86.2%, the mean recoveries of metformin at three levels LQC, MQC, and HQC were
72.9%, 75.9%, and 77.4%, respectively; plasma samples were stable to analysis. Conclusions: The developed
method meets the requirements of US-FDA 2018 and EMA 2011 to determine metformin in plasma.
Keywords: Capillary zone electrophoresis, plasma, metformin
1. BACKGROUND
Metformin is a biguanide-class oral antidiabetic
drug with a different mechanism of action than
other antidiabetic drugs [4]. It belongs to group III
in the biopharmaceutics classification system with
high solubility in water and poor permeability to
cell membranes, which means that the preparation
technique has a significant impact on the drug’s
bioavailability. Therefore, metformin is a drug
that require in-vivo bioequivalence testing when
registering a generic product [7]. For this reason,
it is necessary to validate metformin analytical
procedures in biological fluids (usually in plasma)
in accordance with guidelines of US-FDA 2018 and
EMA 2011 [9, 14].
In the world, there have been a number of
studies on the quantification of metformin in human
plasma using various methods, with the most widely
used methods being high - performance liquid
chromatography (HPLC) [6, 10, 11], and capillary
electrophoresis (CE) [12, 13, 15].
In Vietnam, metformin in human plasma
was measured by high-performance liquid
chromatography [1, 2, 5]. However, up to now, there
has been no study published on the quantitative
determination of metformin in biological fluids by
capillary electrophoresis.
This analytical method has many advantages
such as high separation performance, short analysis
time, saving consumable supplies. In order to
develop an applicable method for quantifying
metformin in human plasma, we conduct the study
to develop a capillary electrophoresis method.
2. MATERIALS AND METHODS
2.1. Materials
Human plasma was supplied by the National
Institute of Hematology and Blood Transfusion.
Corresponding author: Thai Khoa Bao Chau, email: thaikhoabaochau92@gmail.com
Received: 28/7/2021; Accepted: 21/9/2021; Published: 30/12/2021
DOI: 10.34071/jmp.2021.7.7
54
Journal of Medicine and Pharmacy, Volume 11, No.07/2021
Secondary standards, metformin hydrochloride
(99.12%) and ranitidine hydrochloride (98.36%)
were purchased from the National Institute of Drug
Quality Control.
All other chemicals used in the study were
sodium dihydrogen phosphate (NaH2PO4), acid
orthophosphoric (H3PO4), sodium hydroxide (NaOH),
acetonitrile, methanol (MeOH, Merck, Germany),
and double-distilled deionized water.
Instrumentation – equipment: Agilent 7100
capillary electrophoresis system, HI 2550 - 02 pH
meter (Hanna, Italy), double distilled water machine
A400D (UK), vortex mixer VX – 200 Labnet (USA),
centrifuge Labnet Spectrafuge 24D (USA), analytical
balance HR-250AZ (Korea), refrigerator preserved
sample TOSHIBA (Japan), elmasonic S100H ultrasonic
cleaner (Germany), fused – silica capillaries Agilent
Technology (USA); Glassware: volumetric flasks type
10 ml, beakers, micropipettes,...
2.2. Methods
2.2.1. CE Method Development
Preparation of standard solutions
Standard stock solutions were prepared by dissolving
the metformin standard in distilled water to obtain an
exact concentration of about 100 µg/ml.
The internal standard solution was prepared by
dissolving the ranitidine standard substance in water
with an exact concentration of about 100 µg/ml.
From stock standard solutions, working standard
solutions (QC1, QC2) in plasma were prepared with
metformin concentrations of about 4.0 µg/ml and 1.0
µg/ml, respectively.
Dilute QC1, QC2 with blank plasma to obtain standard
samples with metformin concentration from 0.1 to 4.0
µg/ml to prepare samples to build standard curves.
Dilute QC1, QC2 with blank plasma to obtain test
samples including 3 different concentrations (LQC 0.3
µg/ml, MQC 2.0 µg/ml, HQC 3.0 µg/ml).
Sample preparation
The protein precipitation method [1, 2, 5] and the
liquid-liquid extraction method [6] were conducted.
Electrophoretic conditions
Fixed electrophoretic conditions are as follows:
uncoated fused-silica capillary column of a total
length of 40 cm (effective length 31.5 cm) [13]; the
capillary temperature was set at 250C [13]; injection
pressure was set at 50 mBar [12, 13], the wavelength
of detection was set at 232 nm [15].
The preliminary studies were conducted to
select capillary column diameter, buffer solution
type, buffer solution concentration, buffer
solution pH, the voltage on capillary ends, and
sample injection time.
2.2.2. Method validation
The method was validated according to US-FDA
2018 and EMA 2011 about the validation of analytical
procedures in human plasma including the following
criteria: system compatibility, specificity, linearity
range, the lower limit of quantitation, precision,
accuracy, recovery rate (extraction efficiency);
stability.
Data were expressed as the mean ± standard
deviation, calculated using Microsoft Excel 2016
software.
3.1.2. Sample preparation
Protein precipitation methods were conducted
with two protein precipitation agents, including
acetonitrile or perchloric acid 70% (w/v). By using
perchloric acid, metformin were not separated from
the matrix, while by using acetonitrile, metformin
and ranitidine were separated from the matrix, and
peak responses were stable. Therefore, acetonitrile
was selected as the protein precipitation agent.
After selecting the protein precipitation agent,
experiments were conducted to choose the proper
centrifuge time among 5 minutes, 10 minutes, and 15
minutes at 10000 rpm. The results showed that after
centrifugation for 5 minutes, the sample matrix was
3. RESULTS
3.1. CE method development
3.1.1. Selection of internal standard
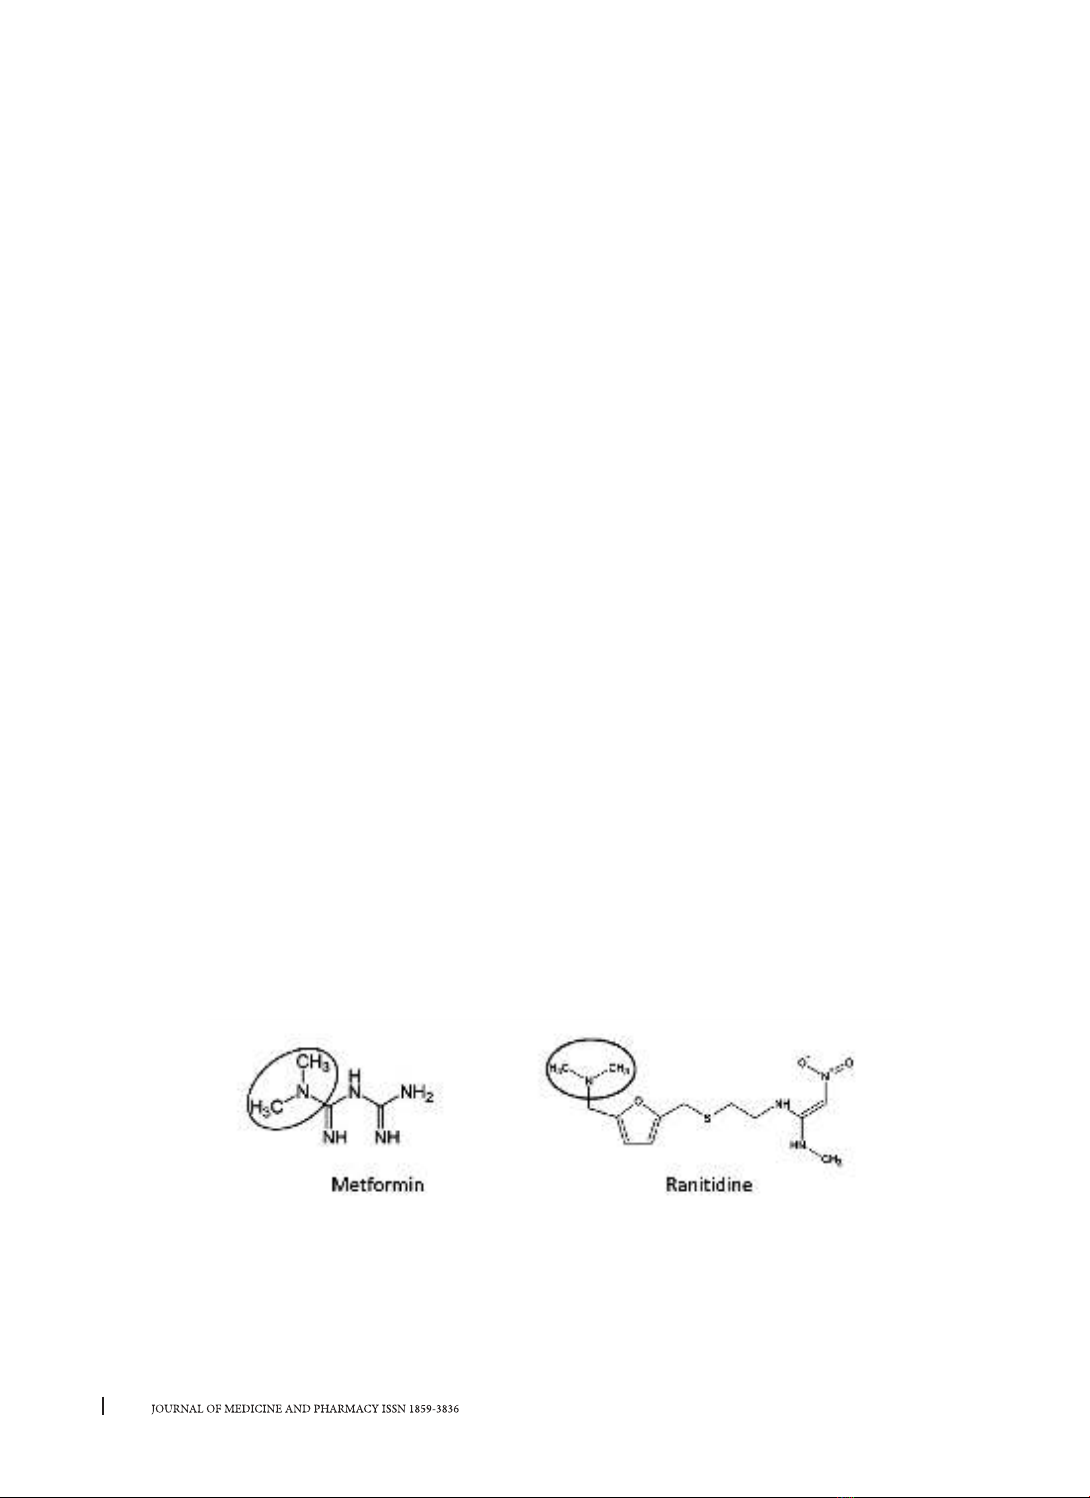
Ranitidine hydrochloride was chosen as the internal standard in this study because it has a dimethylamino
group similar to that of metformin.
55
Journal of Medicine and Pharmacy, Volume 11, No.07/2021
not clean, the extraction efficiency was low (46.69%);
after centrifugation for 10 minutes, the sample matrix
was relatively clean, the extraction efficiency was quite
high (73.50%); after centrifugation for 15 minutes, the
matrix was also clean and the extraction efficiency was
lower than that of 10 minutes (58.80%). Therefore, the
centrifuge time of 10 minutes was selected for further
analysis.
Finally, the sample preparation process was
conducted as follows: 50 µl of ranitidine hydrochloride
solution 40 µg/ml (internal standard) and 1 ml of
acetonitrile were added to 1 ml of plasma samples
(blank/standard) in a 5 ml centrifuge tube, vortexed
for 2 min then centrifuged for 10 min at 10000 rpm.
The supernatant layer was filtered through a 0.45 μm
membrane filter. The filtrate (1 ml) was transferred to
another 1.5 ml Eppendorf centrifuge tube, evaporated
to dryness with a centrifugal evaporator. The residues
were reconstituted with 100 µl of a mixture of
acetonitrile and water (1:1, v/v), vortexed for 30s
before analysis.
3.1.3. Electrophoretic conditions
The preliminary studies were conducted to select
CE conditions that provide good separation and good
peak shape. The electrophoretic separation was
achieved on an uncoated fused-silica capillary column
(total length 40 cm, effective length 31.5 cm, inner
diameter 100 µm), maintained at 250C. The detection
wavelength was set at 232 nm. Phosphate solution
(100 mM, pH = 4) was used as the buffer. The applied
voltage was set at 15 kV. Before injecting samples, the
inlet end of the capillary was dipped in water. Sample
injection mode was set at 50 mBar in 7 seconds.
3.2. Method validation
3.2.1. System suitability
Capillary electrophoresis system suitability was
determined by repeated injection of 6 standard
solutions of metformin at the concentration of 2.0
µg/ml. Results of the capillary electrophoresis system
suitability are presented in Table 1.
Table 1. Results of capillary electrophoresis system suitability (n = 6)
Serial
Number
Metformin Ranitidine RS
TR (min) S (mAu.s) N AsTR (min) S (mAu.s) N As
12.097 182.8 7158 1.1 2.648 63.5 4804 1.1 4.4
22.098 184.2 7158 1.0 2.669 63.1 5127 1.1 4.6
32.156 184.3 7361 1.0 2.757 63.1 5328 1.2 4.8
4 2.134 187.9 7027 1.0 2.733 64.1 4999 1.2 4.7
5 2.128 184.2 6609 1.1 2.737 65.4 4652 1.2 4.6
6 2.140 187.0 6877 1.0 2.736 63.4 5385 1.2 4.7
Mean 2.126 185.1 7032 1.0 2.713 63.8 5049 1.2 4.6
RSD (%) 1.11 1.05 3.72 5.00 1.62 1.38 5.72 4.43 2.95
TR: Retention time; S: Peak area; N: Plate theory; RS: Resolution; AS: Asymmetry
According to Table 1, the relative standard deviations of retention time and peak area are within the
acceptance range (< 3.0%); 0.8 ≤ As ≤ 1.5; Rs ≥ 1.5 [3]. This showed that the capillary electrophoresis system
is suitable for the determination of metformin in human plasma.
3.2.2. Specificity
Analyze 6 blank plasma samples and 6 standard solutions of metformin 0.1 µg/ml in plasma.
Electropherograms are shown in Figure 1 and Figure 2.
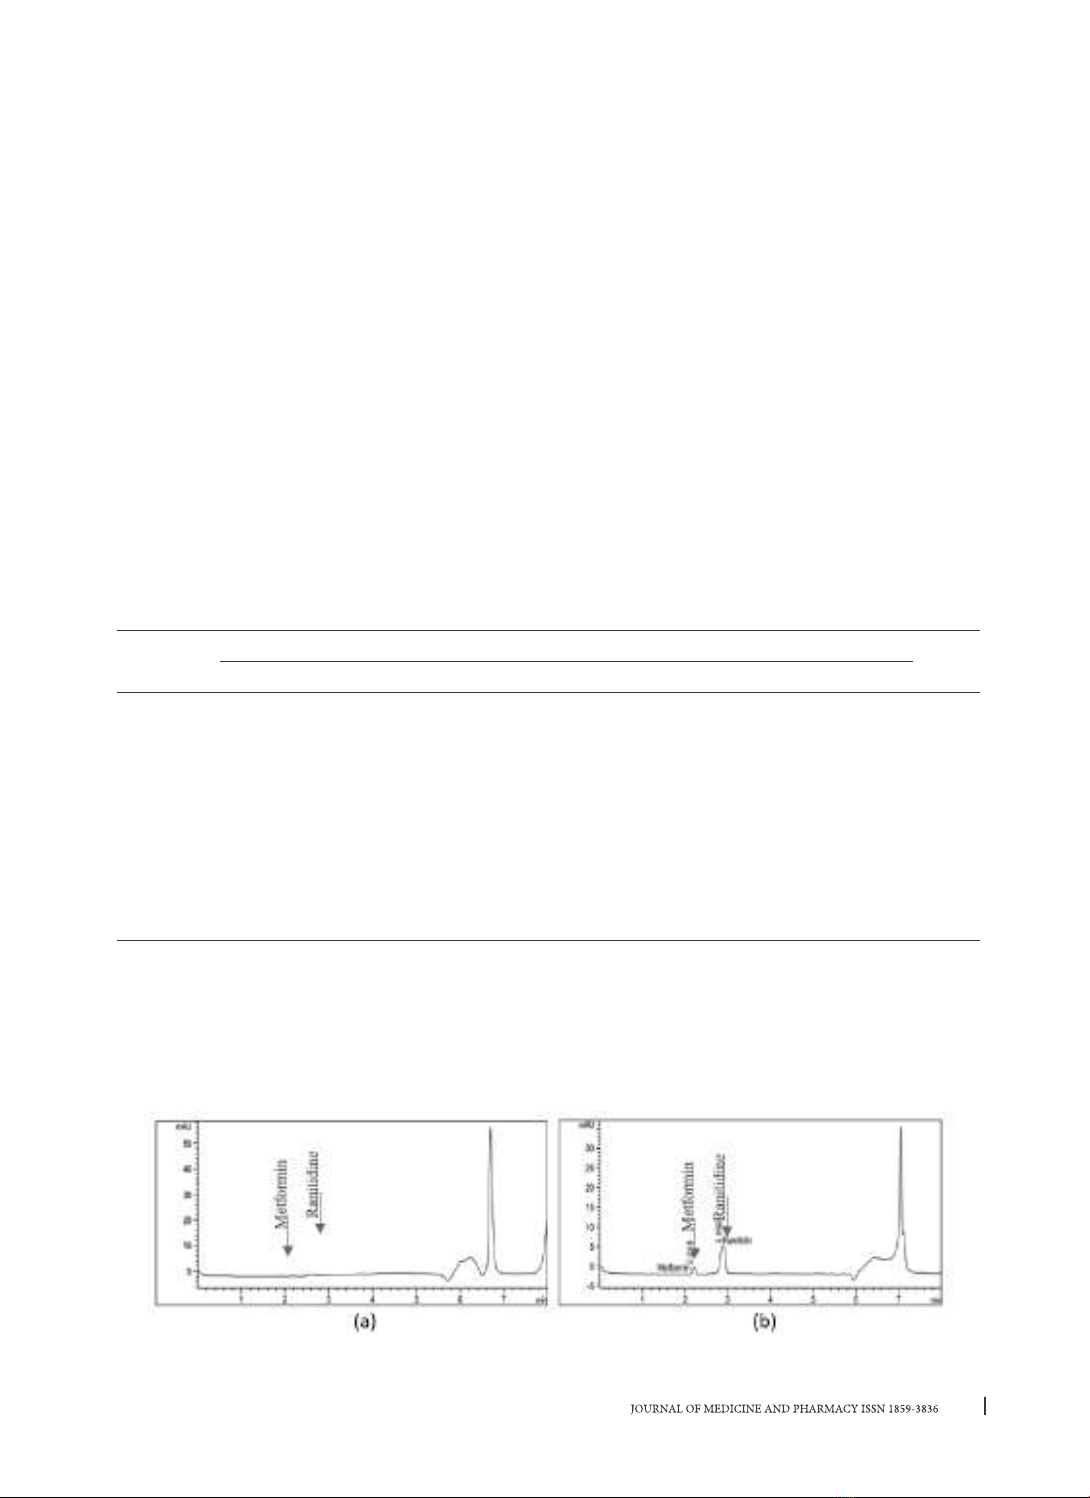
(a) (b)
Figure 1. Electropherograms of (a) Blank plasma sample; (b) Standard plasma sample spiked with
metformin and ranitidine
56
Journal of Medicine and Pharmacy, Volume 11, No.07/2021
(a) (b)
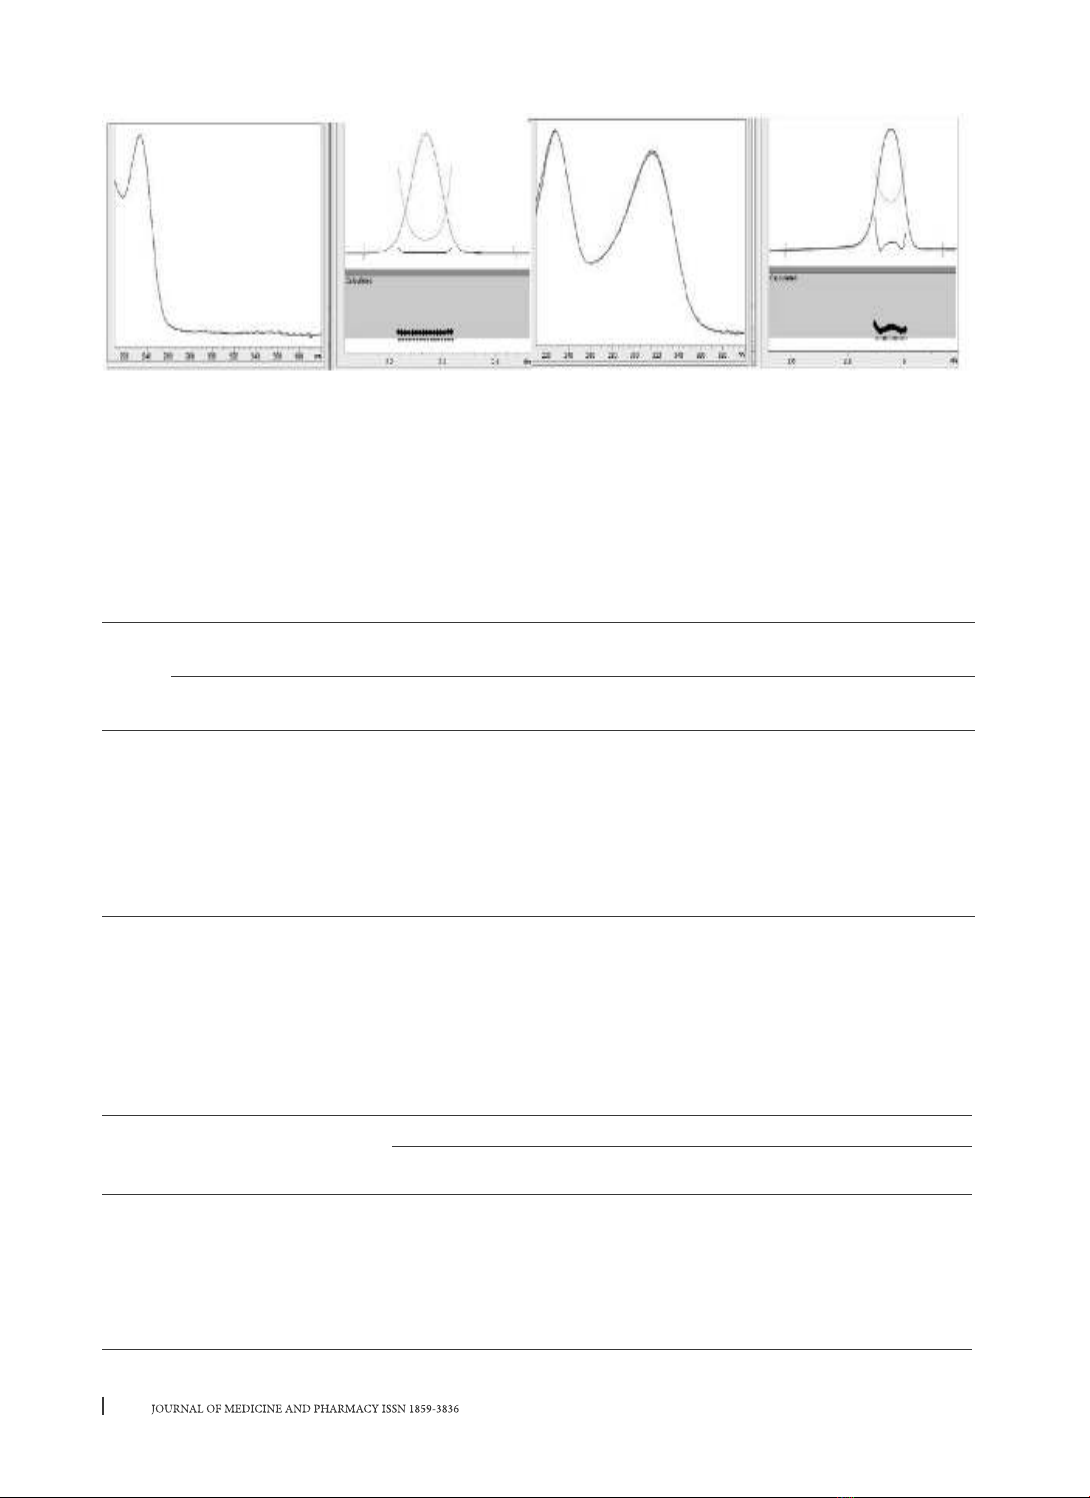
(a) Metformin; (b) Ranitidine
(a) (b)
Figure 2. UV spectrum and peak purity
(a) Metformin; (b) Ranitidine
In the electropherogram of standard solutions, 2 peaks of metformin and ranitidine were detected at 2.2
minutes and 2.9 minutes, respectively (Fig. 1b); whereas peaks of metformin and ranitidine were not found
in the blank at those retention times (Fig. 1a). The results of UV spectroscopy tests of two peaks using a PDA
detector (Fig. 2) showed that these two peaks were metformin and ranitidine, respectively.
Moreover, the results of the purity index in Figure 2 showed that the two peaks having high purity index
(0.999). Therefore, the method has good specificity.
Table 2. The results of specificity (n = 6)
S.No
Response (mAU.s) Respone rate
(%) Response (mAU.s) Respone rate
(%)
Blank
sample
LLOQ
(Met 0.1 µg/ml)
Blank/Met
(< 20 %)
Blank
sample
LLOQ
(Met 0.1 µg/ml)
Blank/Ran
(< 5 %)
1 0 11.6 0 0 57.6 0
2 0 10.4 0 0 53.6 0
3 0 10.7 0 0 54.7 0
40 10.0 0 0 53.8 0
5 0 11.8 0 0 54.8 0
60 11.0 0 0 54.4 0
Besides, the signals of interfering components can be acceptable where the responses in the blank
samples are less than 20% (for the analyte) and 5% (for the internal standard) of those in the LLOQ samples
(Table 2). Thus, the specificity of the method is in accordance with US-FDA 2018 and EMA 2011.
3.2.3. Linear range
Analyze standard samples of metformin in plasma with the range of concentration 0.1 – 4.0 µg/ml, each
concentration was analyzed 5 times on five consecutive days. The linear relationships between the concentration
of metformin in plasma and the peak area ratio of metformin/ranitidine are presented in Table 3.
Table 3. Results of linear range (n = 5)
Sample
Concen
tration
(µg/ml)
Accuracy (%)
CC1 CC2 CC3 CC4 CC5
S1 0.1 81.72 96.11 82.59 93.49 115.30
S2 0.2 88.62 98.46 89.46 109.50 103.21
S3 0.5 100.59 104.03 99.30 101.33 101.55
S4 1.0 102.55 99.79 95.91 95.38 94.99
S5 2.0 105.34 102.18 106.52 102.69 103.31

57
Journal of Medicine and Pharmacy, Volume 11, No.07/2021
S6 3.0 95.25 95.88 100.72 98.69 96.87
S7 4.0 101.21 101.74 98.26 100.31 101.20
Linear regression
(Y= a + bX)
b = 1.4685
r2 = 0.9974
a = 0.0799 a = 0.059 a = 0.0449 a = 0.0156 a = -0.0283
b = 1.4661 b =1.5181 b = 1.5546 b = 1.5312
r2 = 0.9984 r2 = 0.9982 r2 = 0.9995 r2 = 0.9987
(Y: the peak area ratio of metformin/ranitidine: X: the concentration of metformin in plasma)
The accuracy compared with the actual
concentration was from 86.34 to 106.43% (in the
range from 80 to 120%), the repeatability of the
method after 6 analyses met the guideline on
validation of analytical methods of US-FDA and
EMA with the relative standard deviation less than
20% (7.09%). Thus, the human plasma sample with
metformin 0.1 µg/ml met the LLOQ requirement of
the bioanalytical method.
3.2.5. Accuracy, precision
The intra-day accuracy and intra-day precision
were evaluated by analyzing quality control (QC)
samples at three levels of concentration: Lower
Quality Control (LQC = 0.3 µg/ml), Medium Quality
Control (MQC = 2.0 µg/ml), High Quality Control
(HQC = 3.0 µg/ml). At each concentration, analyzing
6 independent samples (n = 6), the results were
shown in Table 5.
In the concentration range of 0.1 – 4.0 µg/
ml, there are linear relationships between the
concentration of metformin and the peak area ratio
of standard/internal standard with the correlation
of coefficient (r) of all five calibration curves ≥
0.98. Metformin concentrations determined from
the calibration curve compared with the actual
concentration were within the allowable range (80
- 120% for the lowest concentration and 85 - 115%
for other concentrations).
3.2.4. Lower Limit of Quantification (LLOQ)
LLOQ was determined by gradually lowering
the concentration of metformin in human plasma
(0.2 µg/ml, 0.1 µg/ml, and 0.05 µg/ml). At each
concentration, analyzing 6 independent samples
(n = 6). Calculate metformin concentrations in
the standard samples based on a daily calibration
curve, then determine LLOQ value based on the
accuracy and the peak response ratio of metformin
in standard samples compared to blank samples. At
the concentration of 0.1 µg/ml, metformin meets
the LLOQ requirement of the analytical method in
biological fluids. The results were shown in Table 4.
Table 4. Results of lower limit of quantification (n = 6)
S.No
Blank sample Standard sample (0.1 µg/ml)
Met
(mAU.s)
Met
(mAu.s)
IS
(mAu.s)
Concentration found
(µg/ml)
Accuracy
(%)
1 0 11.6 57.6 0.0969 96.92
2 0 10.4 53.6 0.0919 91.90
3 0 10.7 54.7 0.0930 92.98
40 10.0 53.8 0.0863 86.34
5 0 11.8 54.8 0.1064 106.43
60 11.0 54.4 0.0975 97.48
Mean 010.9 54.8 0.0953 95.34
SD 0.0068 6.76
RSD (%) 7.09%