
RESEA R C H Open Access
Suppression of nitric oxide production from nasal
fibroblasts by metabolized clarithromycin in vitro
Ayako Furuya
1
, Kazuhito Asano
2*
, Naruo Shoji
1
, Kojiro Hirano
1
, Taisuke Hamasaki
1
, Harumi Suzaki
1
Abstract
Background: Low-dose and long-term administration of 14-membered macrolide antibiotics, so called macrolide
therapy, has been reported to favorably modify the clinical conditions of chronic airway diseases. Since there is
growing evidence that macrolide antibiotic-resistant bacteria’s spreaders in the populations received macrolide
therapy, it is strongly desired to develop macrolide antibiotics, which showed only anti-inflammatory action. The
present study was designed to examine the influence of clarithromycin (CAM) and its metabolized materials, M-1,
M-4 and M-5, on free radical generation from nasal polyp fibroblasts (NPFs) through the choice of nitric oxide (NO),
which is one of important effector molecule in the development of airway inflammatory disease in vitro.
Methods: NPFs (5 × 10
5
cells/ml) were stimulated with 1.0 μg/ml lipopolysaccharide (LPS) in the presence of
agents for 24 hours. NO levels in culture supernatants were examined by the Griess method. We also examined
the influence of agents on the phosphorylation of MAPKs, NF-B activation, iNOS mRNA expression and iNOS
production in NPFs cultured for 2, 4, 8, and 12 hours, respectively.
Results: The addition of CAM (> 0.4 μg/ml) and M-4 (> 0.04 μg/ml) could suppress NO production from NPFs after
LPS stimulation through the suppression of iNOS mRNA expression and NF-B activation. CAM and M-4 also
suppressed phosphorylation of MAPKs, ERK and p38 MAPK, but not JNK, which are increased LPS stimulation. On
the other hand, M-1 and M-5 could not inhibit the NO generation, even when 0.1 μg/ml of the agent was added
to cell cultures.
Conclusion: The present results may suggest that M-4 will be a good candidate for the agent in the treatment of
chronic airway inflammatory diseases, since M-4 did not have antimicribiological effects on gram positive and
negative bacteria.
Background
Macrolide antibiotics, such as roxithromycin and clari-
thromycin (CAM), are a well-established class of antibac-
terial agent, which are active against many species of
Gram-positive and some Gram-negative bacteria. Besides
their antibacterial activity, these compounds are reported
to exert anti-inflammatory actions in vitro and in vivo
[1-3]. It has been reported previously that macrolides sup-
press the inflammatory steps through the inhibition of
inflammatory cell migration, modulation of oxidative burst
and inflammatory cytokine production [4-6]. In addition,
macrolides have beneficial effects in the treatment of
chronic airway inflammatory diseases, such as diffuse
panbronchiolitis (DPB), chronic sinusitis (CS) and cystic
fibrosis [2]. In this regard, the anti-inflammatory action,
but not the antimicrobial action of macrolides, is reported
to be responsible for the clinical effectiveness of these
agents against the inflammatory diseases [1,2,6-8]. On the
other hand, since there is growing evidence that macrolide
antibiotic-resistant bacteria’s spreaders in the populations,
who are orally administered macrolide antibiotics for long
periods, it is strongly desired to develop macrolide antibio-
tics, which showed only anti-inflammatory action [9,10].
From that point of view, several types of derivatives of
macrolide antibiotics were synthesized from erythromycin
(EM) and their biological activities were examined in vitro
and in vivo. Among these derivatives, EM201, obtained by
mild acid treatment of EM, known as an internal metabo-
lite of EM, has been reported to show a strong inhibitory
effect on macrophage differentiation and to possess weak
* Correspondence: asanok@med.showa-u.ac.jp
2
Division of Physiology, School of Nursing and Rehabilitation Sciences,
Showa University, Yokohama, Japan
Full list of author information is available at the end of the article
Furuya et al.Journal of Inflammation 2010, 7:56
http://www.journal-inflammation.com/content/7/1/56
© 2010 Furuya et al; licensee BioMed Central Ltd. This is an Open Access article distributed under the terms of the Creative Commons
Attribution License (http://creativecommons.org/licenses/by/2.0), which permits unrestricted use, distribution, and reproduction in
any medium, provided the original work is properly cited.

antimicrobial activity [11]. Furthermore, EM703, the
12-membered psuedoerythromycin A, was also reported
to inhibit macrophage activation and to be free of any
antibacterial activity, and was known to exert a prophylac-
tic effect on lung injury in the rat model, similar to EM
[12], suggesting that these derivatives from EM will be
good candidates for drugs used in the treatment of airway
inflammatory diseases.
Nitric oxide (NO), which was first identified as an
endothelium-derived relaxing factor, is accepted as one
of the important regulators of many cell and tissue func-
tions. NO is also known to be produced by various types
of cells and tissues (e.g. macrophages, epithelium and
fibroblasts) in response to inflammatory stimulation
[13]. Although physiological production of NO is gener-
ally believed to play an important role in host defense,
overproduction of NO and its metabolites has been
implicated in the pathogenesis of conditions such as
bacterial sepsis, chronic inflammation [14] and pulmon-
ary fibrosis [15].
After oral administration of CAM, the agent was
metabolized into several types of metabolized materials,
M-1, M-4 and M-5, among others [16]. In these materi-
als, M-1 and M-5 show anti-microbial effects similar to
that observed in CAM, whereas M-4 has no antibacterial
effects [17]. Our previous work clearly shows the sup-
pressive effects of M-4 on dendritic cell functions, such
as inflammatory cytokine production and co-stimulatory
molecule expression [18]. It is also observed that M-4
could inhibit the production of IL-8 from BEASE-2B
cells, human airway epithelial cell line, in response to
TNF-astimulation in vitro [19]. However, the influence
of M-4 on NO production is not still defined. In the
present study, therefore, we examined whether M-4
could suppress NO production from nasal fibroblasts in
response to inflammatory stimulation in vitro.
Methods
Agents
CAM and its metabolized materials, M-1, M-4 and M-5,
are kindly donated by Taisho-Toyama Pharmaceutical
Co. Ltd. (Osaka, Japan) as a preservative-free pure pow-
der. They were firstly dissolved in 100% methanol at a
concentration of 2.0 mg/ml, and then diluted with mini-
mum essential medium (MEM; SIGMA Chemicals, St
Louis, MO) supplemented with 3% heat-inactivated calf
serum (MEM-FCS; Irvine, Santa Ana, CA) to give a con-
centration of 100.0 μg/ml. The solutions were then ster-
ilized by passing through 0.2 μmfiltersandstoredat4°
C as stock solutions. Lipopolysaccharide (LPS) extracted
from Escherichia coli (SIGMA Chemicals) was dissolved
in MEM-FCS at a concentration of 10.0 mg/ml. It was
then sterilized by passing it through a 0.2 μmfilterand
diluted with MEM-FCS at appropriate concentrations
for experiments.
Cell source
Nasal polyp specimens were surgically obtained from
chronic sinusitis patients who had not received any
medical treatment, including systemic and topical ster-
oid application. Specimens were cut into small pieces
(approximately 1 mm) and washed several times in
phosphate-buffered saline supplemented with 200 U/ml
penicillin, 200 μg/ml streptomycin and 5.0 μg/ml
amphotericin B, followed by MEM that contained 10%
FCS. Diced specimens were then plated at a density of
10 pieces in 100 mm tissue culture dishes and covered
with a cover slip adhered to the dish. The dishes were
then placed at 37°C in a humidified atmosphere contain-
ing 5% CO
2
. When a monolayer of fibroblast-like cells
was found to be confluent, the explanted tissues were
removed. The cells were then trypsinized and replated
at a concentration of 5 × 10
5
cells/ml. The medium
(MEM containing 10% FCS) was changed every 3 days
for 2-3 weeks until confluence was attained. Subse-
quently, the cells were split into two at confluence and
passaged. The cells were characterized [20], and used as
nasal polyp fibroblasts (NPFs). All donors (5 subjects)
were male, aged between 25 and 62 years (mean 40.5
years) and had given their informed consent, according
to the protocol approved by the Ethics Committee of
Showa University.
Cell culture
The cells, passaged 3-5 times, were washed several times
with MEM-FCS, introduced into each well of 24-well cul-
ture plates in triplicate at a concentration of 5 × 10
5
cells/
ml in a volume of 1.0 ml and allowed to adhere for 2
hours. The plates were then washed twice with MEM-FCS
to remove dead and unattached cells. The residual cells
were stimulated with LPS in the presence of various con-
centrations of agents in a total volume of 2.0 ml. To pre-
pare culture supernatants, cells were cultured for 24 hours
[21], and the culture medium was removed and stored at
-40°C until used. Cells for examination of phosphorylation
of mitogen-activated protein kinases (MAPKs), transcrip-
tion factor activation, inducible NO synthase (iNOS)
mRNA expression and iNOS protein were cultured in a
similar manner for 2, 4, 8 and 12 hours, respectively. The
cells were then stored at -80°C and used within 24 hours.
In all experiments, treatment of cells with the agents was
started 2 hours before LPS stimulation.
Assay for cell proliferation
Cell proliferation induced by LPS stimulation was exam-
ined by a commercially available Cell Proliferation
Furuya et al.Journal of Inflammation 2010, 7:56
http://www.journal-inflammation.com/content/7/1/56
Page 2 of 12

enzyme-linked immunosorbent assay (ELISA) test kit
(GE Healthcare Ltd., Buckinghamshire, UK) that con-
tained sufficient reagents according to the manufac-
turer’s recommended procedures. Briefly, cells (1 × 10
5
cells/well) stimulated with LPS for 48 hours in the pre-
sence of various concentrations of CAM and M-4 in 96-
well flat-bottomed culture plates in triplicate were
labeled with 10 μM5-brom-2’-deoxyuridine (BrdU) for
2 hours. After removing BrdU solution, cells were
blocked with blocking buffer for 30 min and then trea-
ted with peroxidase-labeled anti-BrdU monoclonal anti-
body for 90 min. After washing three times with
washing buffer, 3,3’5,5’-tetramethylbenzidine (TMB) was
added into each well and incubated for 30 min. After
addition of 1 M sulphuric acid, the optical density (OD)
at 450 nm was measured with an ELISA plate reader.
The results were expressed as the mean OD ± SE of five
different subjects.
Assay for NO (NO
2-
/NO
3-
)
The NO concentration in culture supernatants was mea-
sured using Griess Reagents Kits for NO
2-
/NO
3-
assay
(Dojindo, Co. Ltd., Kumamoto, Japan). The assay was
done in duplicate, and the results were expressed as the
mean μM ± SE of five different subjects.
Assay for inducible NO synthases (iNOS)
The iNOS levels in cytosol were assayed by commer-
cially available human iNOS ELISA kits (R & D Systems,
Inc., Minneapolis, MN) that contained sufficient
reagents, according to the manufacturer’s recommenda-
tions. Samples used for examining iNOS levels were pre-
pared from 5 × 10
5
cells cultured for 12 hours. The
results were expressed as the mean U/ml ± SE of five
different subjects. The minimum detectable level of this
ELISA kit was 0.15 U/ml.
Assay for iNOS mRNA expression
iNOS mRNA was examined using commercially avail-
able ELISA test kits for human iNOS mRNA that
contained sufficient reagents, according to the manufac-
turer’s recommendations. Poly A
+
mRNA was separated
from cells cultured for 8 hours using oligo(dT)-coated
magnetic microbeads (Milteny Biotec, Bergisch Glad-
bach, Germany), and used as target mRNA at a concen-
tration of 2.0 μg for examining iNOS mRNA expression.
Poly A
+
mRNAinavolumeof150μl were added into
each well of a 96-well microplate that contained 50 μl
of specific probe in duplicate and incubated for 60 min
at 65°C. The materials (150 μl) were then transferred
into each well of a 96-well microplate, which was coated
with streptavidin and incubated for 60 min at 25°C.
Polyclonal antibody against digoxigen conjugated to
alkaline phosphatase was added to wells and incubated
at 25°C. After 60 min, 50 μlofNADPHsolutionwas
added and incubated for 60 min. After addition of
enzymes, OD at 490 nm was measured, and the results
were expressed as the mean OD ± SE of five different
subjects.
Assay for transcription factor activation
Nuclear factor-B(NF-B) activity was analyzed using a
commercially available ELISA test kits (Active Motif,
Co., Ltd, Carlsbad, CA), which contained sufficient
reagents and monoclonal antibodies against p50 subunit,
according to the manufacturer’s recommendations.
Briefly, nuclear extract (5.0 μg protein) from 4-hour cul-
tured cells was introduced into each well of a 96-well
microplate precoated with oligonucleotide containing
the NF-B consensus site (5’-GGGACTTTCC-3’)ina
volume of 20 μl, and incubated for 1 hour at 25°C. After
washing three times, 100 μl monoclonal antibody against
p50 was added to the appropriate wells, and incubated
for a further 1 hour at 25°C. Anti-IgG HRP-conjugate in
avolumeof100μl was then added and incubated for 1
hourat25°C.ODat450nmwasmeasuredafterthe
addition of tetramethylbenzyne solution. Using the man-
ufacturer’s data sheets, the amount of NF-Bboundto
DNA can be measured by this ELISA system. ELISA
was done in duplicate, and the results were expressed as
the mean OD ± SE of five different subjects.
Assay for phosphorylation of MAPKs
The phosphorylation of p38 MAPK was measured by a
commercially available ELISA test kit (Active Motif, Co.
Ltd) according to the manufacturer’s recommendations.
Briefly, cells cultured for 2 hours in 96-well culture
plates were fixed with 4% formaldehyde for 20 min at
25°C. After washing three times, 100 μl antibody block-
ing buffer was added into each well, and incubated for 1
hour at 25°C. After removing blocking buffer, 40 μlpri-
mary antibody (phosphorylated-p38 MAPK antibody)
was added, and incubated for a further 12 hours at 4°C.
Secondary antibody (anti-IgG HRP-conjugate) was
added in a volume of 100 μl, and incubated for 1 hour
at 25°C. OD at 450 nm was measured after the addition
of tetramethylbenzyne solution. The phosphorylation of
both extracellular signal related kinase (ERK)1/2 and
Jun N-terminal kinase (JNK) were also measured with
ELISA test kits (Active Motif, Co. Ltd.) in a similar
manner. In all phosphorylation assay, ELISA was done
in duplicate, and the results were expressed as the mean
OD ± SE of five different subjects.
Statistical evaluation
A one-way ANOVA test was employed for statistical
analysis, with significant difference determined as P <
0.05.
Furuya et al.Journal of Inflammation 2010, 7:56
http://www.journal-inflammation.com/content/7/1/56
Page 3 of 12
Results
Suppression of NO production from NPFs by CAM and its
metabolized materials
The first set of experiments was undertaken to examine
the influence of LPS stimulation on NO production from
NPFs. NPFs were stimulated with various concentrations
of LPS in triplicate and the culture supernatants were col-
lected 24 hours later for measurement of NO concentra-
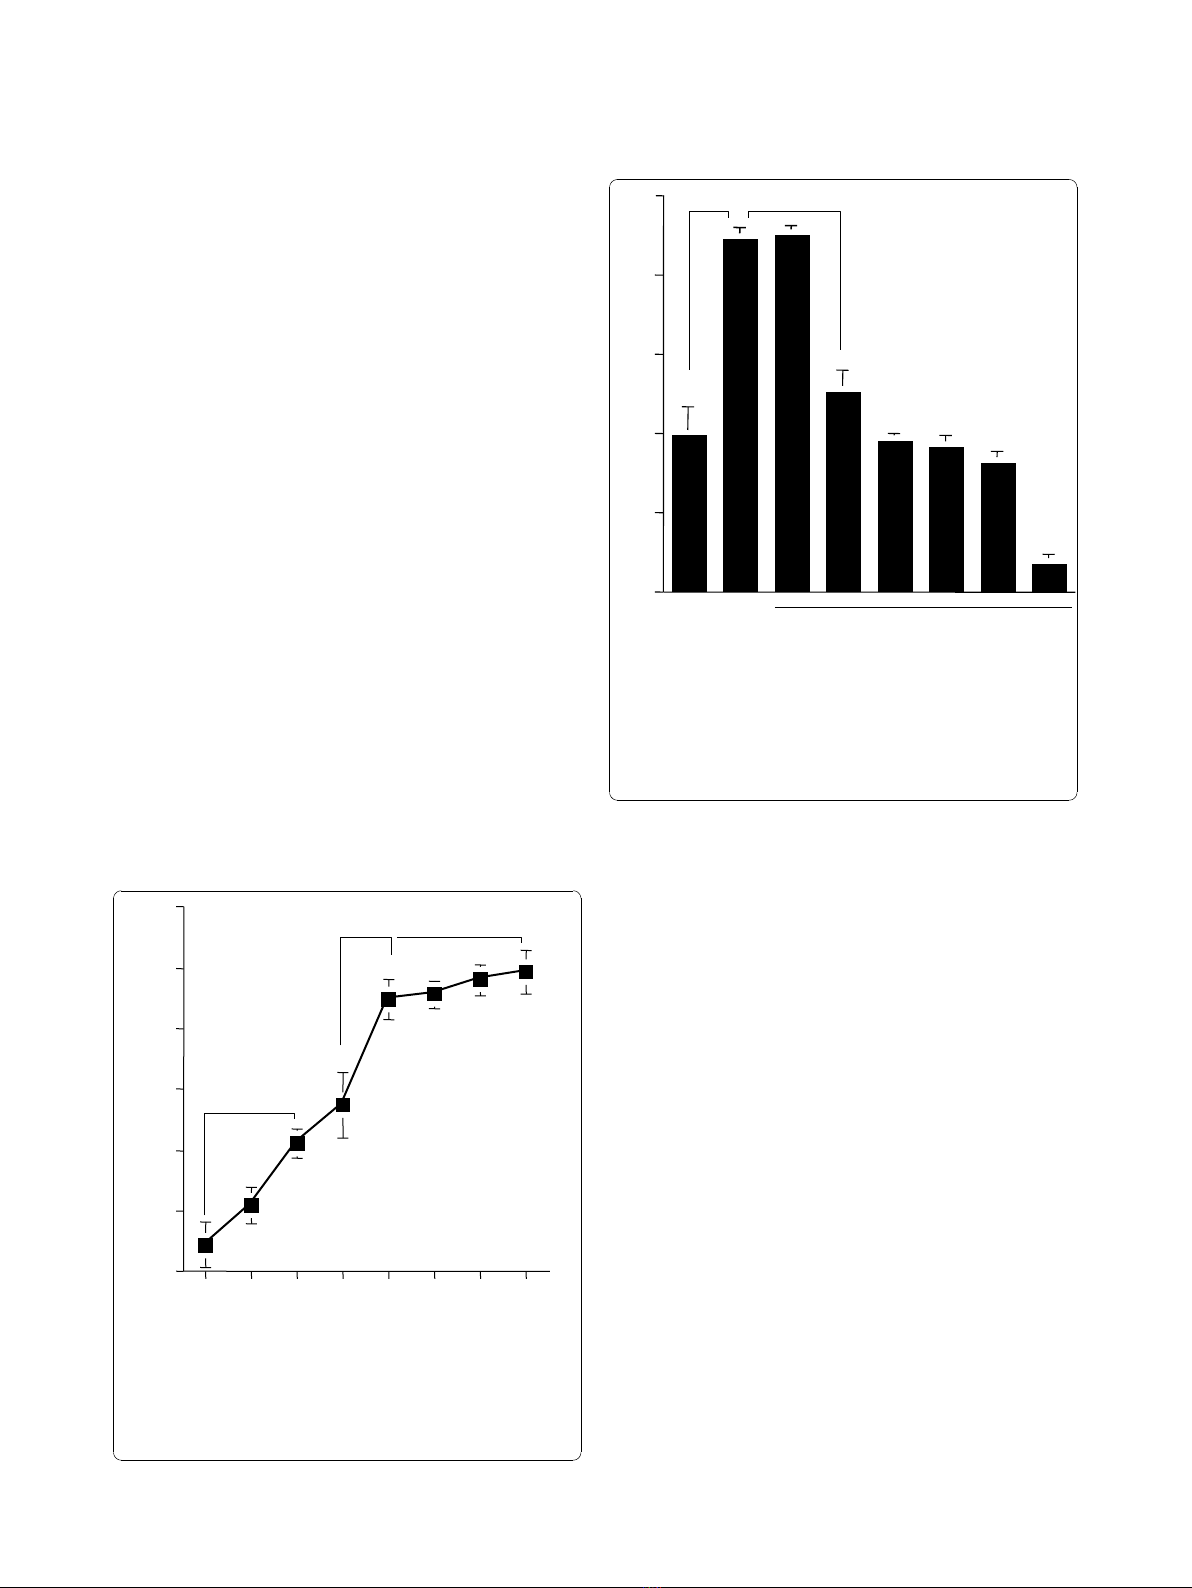
tion. As shown in Figure 1, LPS stimulation caused a
dose-dependent increase in NO production from NPFs,
which was first detected at 0.5 μg/ml and peaked at more
than 1.0 μg/ml. We then examined the influence of CAM
on NO production from NPFs in response to LPS stimula-
tion. NPFs were stimulated with 1.0 μg/ml LPS in the pre-
sence of various concentrations of CAM for 24 hours. The
addition of CAM into cell cultures caused suppression of
NO production (Figure 2). The minimum concentration
of CAM, which caused significant suppression of NO pro-
duction was 0.4 μg/ml (Figure 2). The third set of experi-
ments was designed to examine the influence of
metabolized CAM, M-1, M-4 and M-5, on NO production
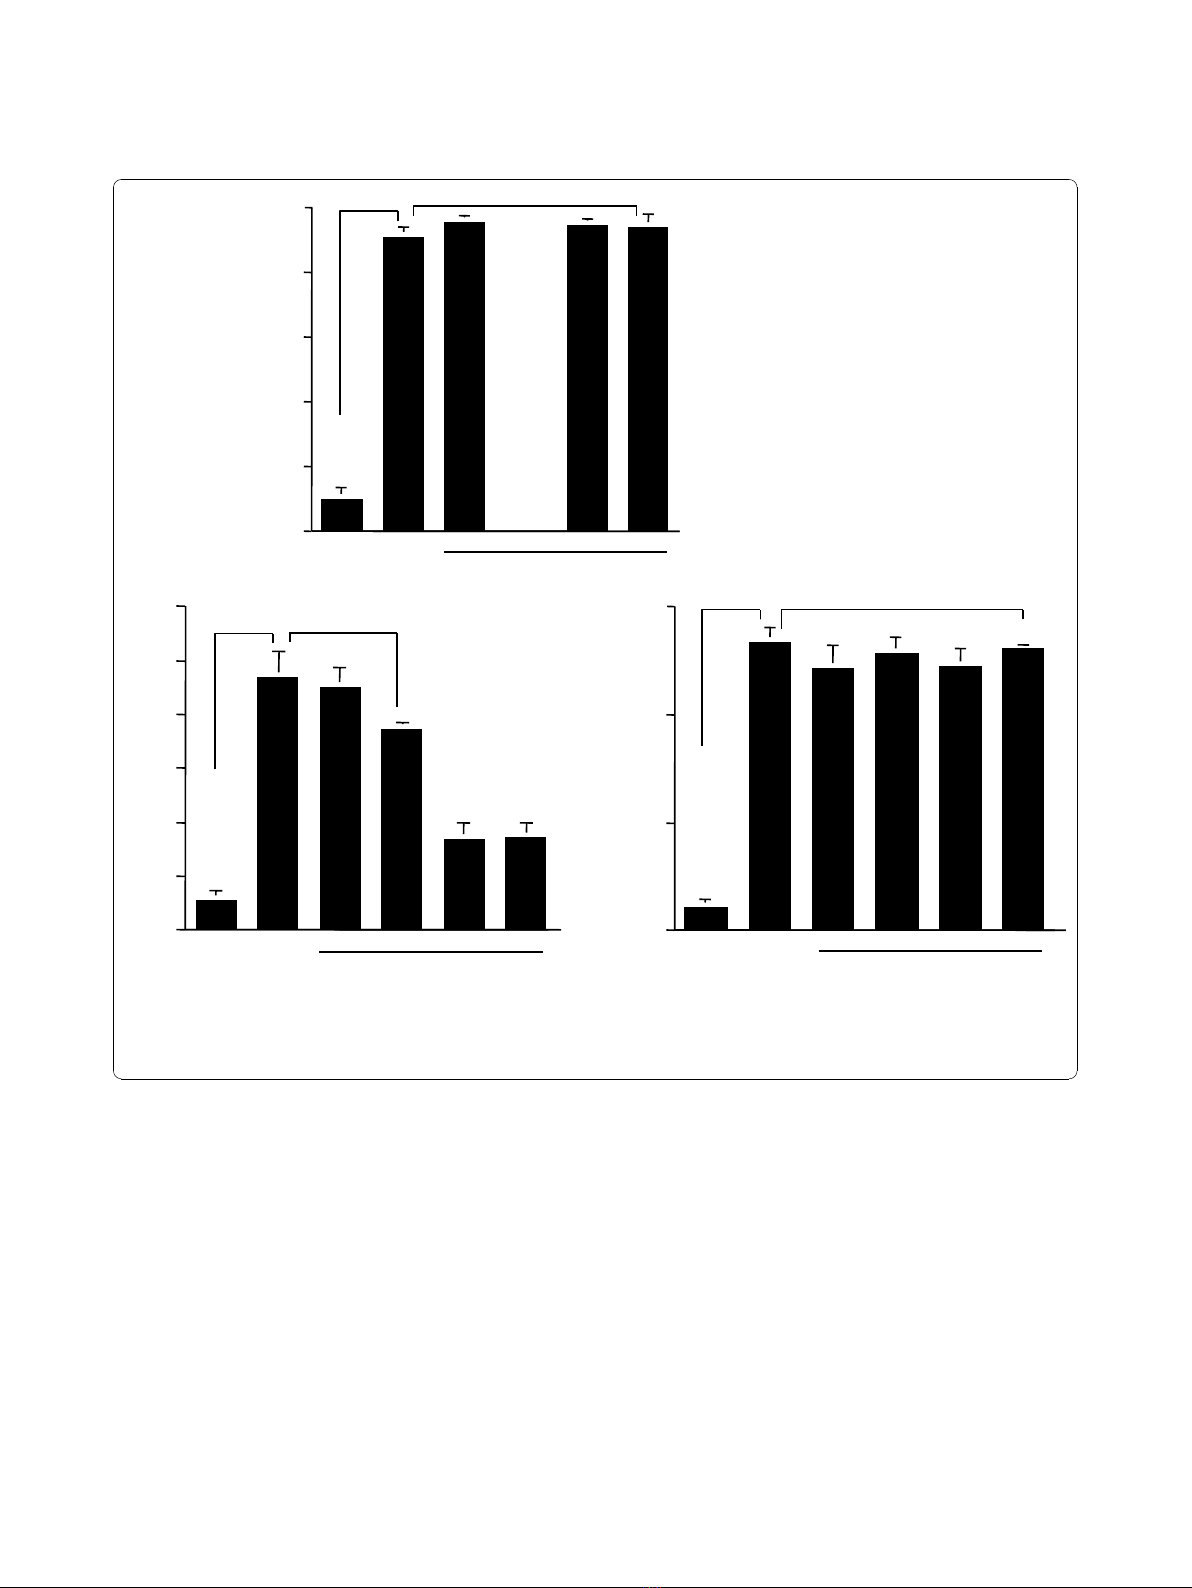
from NPFs induced by LPS stimulation. As shown in
Figure 3A, M-1 could not inhibit NO production from
NPFs, even when 0.1 μg/ml of the agent was added to cell
cultures. On the other hand, the addition of M-4 at more
than 0.04 μg/ml exerted the suppressive effect on NO pro-
duction from NPFs (Figure 3B). The data in Figure 3C
also showed the negative suppressive effect of M-5 at 0.1
μg/ml on NO production from NPFs: NO levels in culture
supernatants from cells treated with 0.1 μg/ml M-5 were
similar to that from control supernatants (P > 0.05).
Influence of CAM and M-4 on cell proliferation induced
by LPS stimulation
The fourth set of experiments was carried out to exam-
ine the influence of CAM and M-4 on cell proliferation
induced by LPS stimulation. NPFs were stimulated with
1.0 μg/ml LPS in the presence of various concentrations
of CAM and M-4 for 48 hours. Cell proliferation was
examined by ELISA. As shown in Figure 4A, addition of
CAM into cell cultures scarcely affected cell prolifera-
tion and OD at 450 nm in experimental groups was
similar(notsignificant;P>0.05)tothatobservedin
cells stimulated with LPS alone. The data in Figure 4B
also showed that M-4 did not exert harmful effects on
cell proliferation induced by LPS stimulation: OD at
450 nm in cells treated with M-4 at 0.15 μg/ml was
nearly identical (not significant; P > 0.05) to that
observed in LPS alone.
Influence of CAM and M-4 on iNOS levels in NPFs after
LPS stimulation
The fifth set of experiments was done to examine the
influence of CAM and M-4 on iNOS production from
0
5
10
15
20
25
30
0.25 0.5 0.75 1.0 1.5 2.0 2.5
0
NO2-/NO3-levels (mean μM
s
SE)
LPS concentration
(
μ
g
/ml
)
P < 0.05 NS
P < 0.05
Figure 1 Influence of LPS stimulation on NO production from
NPFs. NPFs at a concentration of 5 × 10
5
cells were stimulated with
various concentrations of LPS. After 24 hours, culture supernatants
were obtained and assayed for NO (NO
2-
/NO
3-
) levels by the Griess
method. Data are the mean ± SE of five different subjects. LPS,
lipopolysaccharide; NO, nitric oxide; NPFs, nasal polyp fibroblasts. NS,
not significant (P > 0.05).
0
5
10
15
20
2
5
Med.
alone
LPS
alone
0.2 0.4 0.6 0.8 1.0 1.2
LPS + CAM
(
μ
g
/ml
)
NO2-/NO3-levels (mean μM
s
SE)
P < 0.05 P < 0.05
Figure 2 Influence of CAM on NO production from NPFs in
response to LPS stimulation. NPFs at a concentration of 5 × 10
5
cell/ml were stimulated with 1.0 μg/ml LPS in the presence of
various concentrations of CAM. After 24 hours, culture supernatants
were obtained and NO (NO
2-
/NO
3-
) levels were assayed by the
Griess method. Data are the mean ± SE of five different subjects.
CAM, clarithromycin; NO, nitric oxide; NPFs, nasal polyp fibroblasts;
LPS, lipopolysaccharide.
Furuya et al.Journal of Inflammation 2010, 7:56
http://www.journal-inflammation.com/content/7/1/56
Page 4 of 12
NPFs after LPS stimulation. NPFs were stimulated with
1.0 μg/ml LPS in the presence or absence of the agents
for 12 hours. iNOS levels in cytosol were examined by
ELISA. As shown in Figure 5A, the addition of CAM at
more that 0.4 μg/ml into cell cultures caused significant
suppression of iNOS levels in NPFs, which was
increased by LPS stimulation. The data in Figure 5B
also showed that M-4 at more than 0.04 μg/ml, but not
0.02 μg/ml, could exert suppressive effects on the
increase in iNOS levels in NPFs after LPS stimulation.
Influence of CAM and M-4 on iNOS mRNA expression
The sixth set of experiments was undertaken to examine
the influence of CAM and M-4 on iNOS mRNA
expression in NPFs after LPS stimulation. NPFs were
stimulated with LPS in the presence of CAM and M-4
for 6 hours. iNOS mRNA expression was examined by
ELISA. The addition of CAM and M-4 into cell cultures
scarcely affected GAPDH mRNA expression in NPFs
cultured for 8 hours (Figure 6A), whereas iNOS mRNA
expression was significantly suppressed by CAM and
M-4, when these agents were added to cell cultures at
0.4 μg/ml and 0.04 μg/ml, respectively (Figure 6B).
Assay for CAM and M-4 on NF-B activation and
phosphorylation of MAPKs
The final set of experiments was undertaken to examine
the influence of CAM and M-4 on transcription factor
0
10
20
30
C
Med.
alone
LPS
alone
0.02 0.04 0.06 0.1
LPS + M-5 (μg/ml)
NO2-/NO3-levels (mean μM
s
SE)
P < 0.05 NS
Med.
alone
LPS
alone
0
5
10
15
20
25
A
Not tested
0.02 0.04 0.06 0.1
LPS + M-1 (μg/ml)
NO2-/NO3-levels (mean μM
s
SE)
P < 0.05 N
S
Med.
alone
LPS
alone
0.02 0.04 0.06 0.1
0
5
10
15
20
25
30
B
LPS + M-4 (μg/ml)
NO2-/NO3-levels (mean μM
s
SE)
P < 0.05 P < 0.05
Figure 3 Influence of metabolized clarithromycin, M-1 (A), M-4 (B) and M-5 (C) on NO production from NPFs in response to LPS
stimulation. NPFs at a concentration of 5 × 10
5
cell/ml were stimulated with 1.0 μg/ml LPS in the presence of various concentrations of the
agents. After 24 hours, culture supernatants were obtained and NO (NO
2-
/NO
3-
) levels were assayed by the Griess method. Data are the mean ±
SE of five different subjects. NO, nitric oxide; NPFs, nasal polyp fibroblasts; LPS, lipopolysaccharide; NS, not significant (P > 0.05).
Furuya et al.Journal of Inflammation 2010, 7:56
http://www.journal-inflammation.com/content/7/1/56
Page 5 of 12


![PET/CT trong ung thư phổi: Báo cáo [Năm]](https://cdn.tailieu.vn/images/document/thumbnail/2024/20240705/sanhobien01/135x160/8121720150427.jpg)


