12
Journal of Medicine and Pharmacy, Volume 10, No.7/2020
Method development for the simultaneous determination of
paracetamol and diclofenac in pharmaceutical formulations by
capillary zone electrophoresis
Nguyen Thi Huong Giang, Vi Thi Yen Nhi, Nguyen Van Dung, Thai Khoa Bao Chau
Faculty of Pharmacy, Hue University of Medicine and Pharmacy, Hue University
Abstract
Background: Analgesic therapy with the combinations of active ingredients having different mechanisms
of action is beneficial for reducing the therapeutic dose and side effects. Therefore, multi-ingredients
pharmaceutical preparations such as the combination of paracetamol and diclofenac are becoming more
popular on the market. Objectives: (1) Developing a capillary zone electrophoresis method for determining
simultaneously paracetamol and diclofenac in pharmaceutical formulations (2) Applying this method on
the products circulated on the market. Materials and methods: Paracetamol and diclofenac in Zengesic and
Ripaigesic film-coated tablets were used in this research. The method was developed and validated according
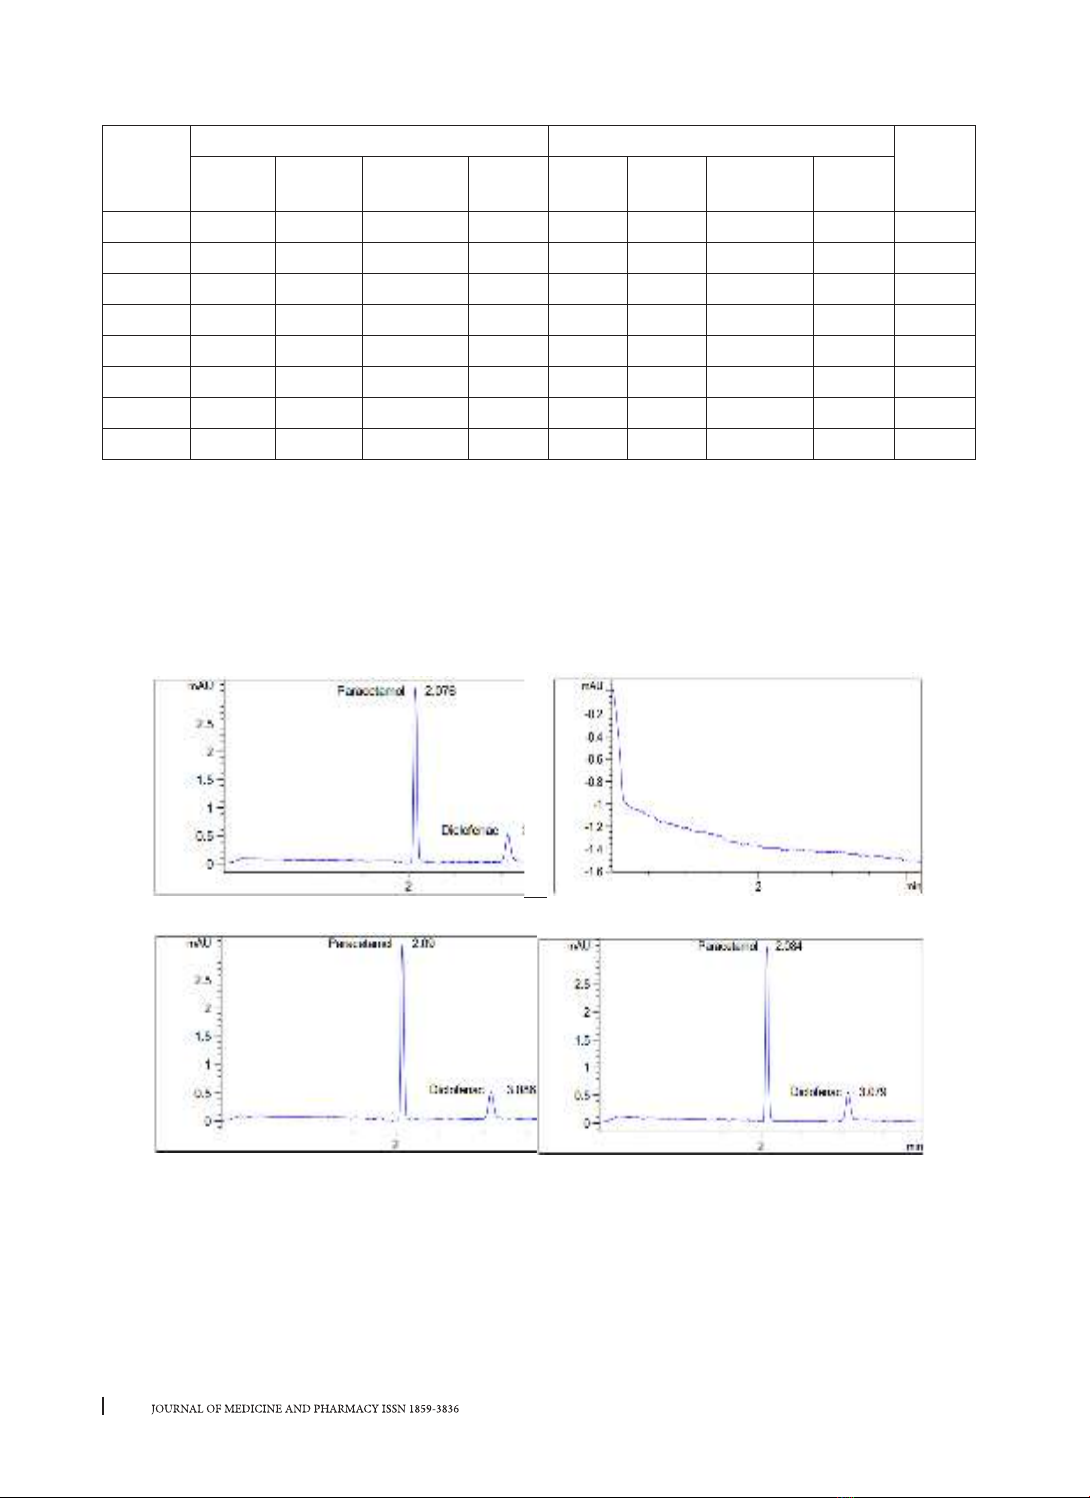
to AOAC 2016 and ICH 2005 guidelines. Results: The procedure was developed using the Agilent 7100 CE
electrophoresis system with the following electrophoresis conditions: uncoated fused-silica capillary column
of a total length of 50 cm (effective length 41.5 cm), sodium tetraborate buffer solution 50 mM (pH = 9), the
voltage applied to both capillary ends 30 kV, sample injection mode 35 mbar for 4s, detection with a PDA
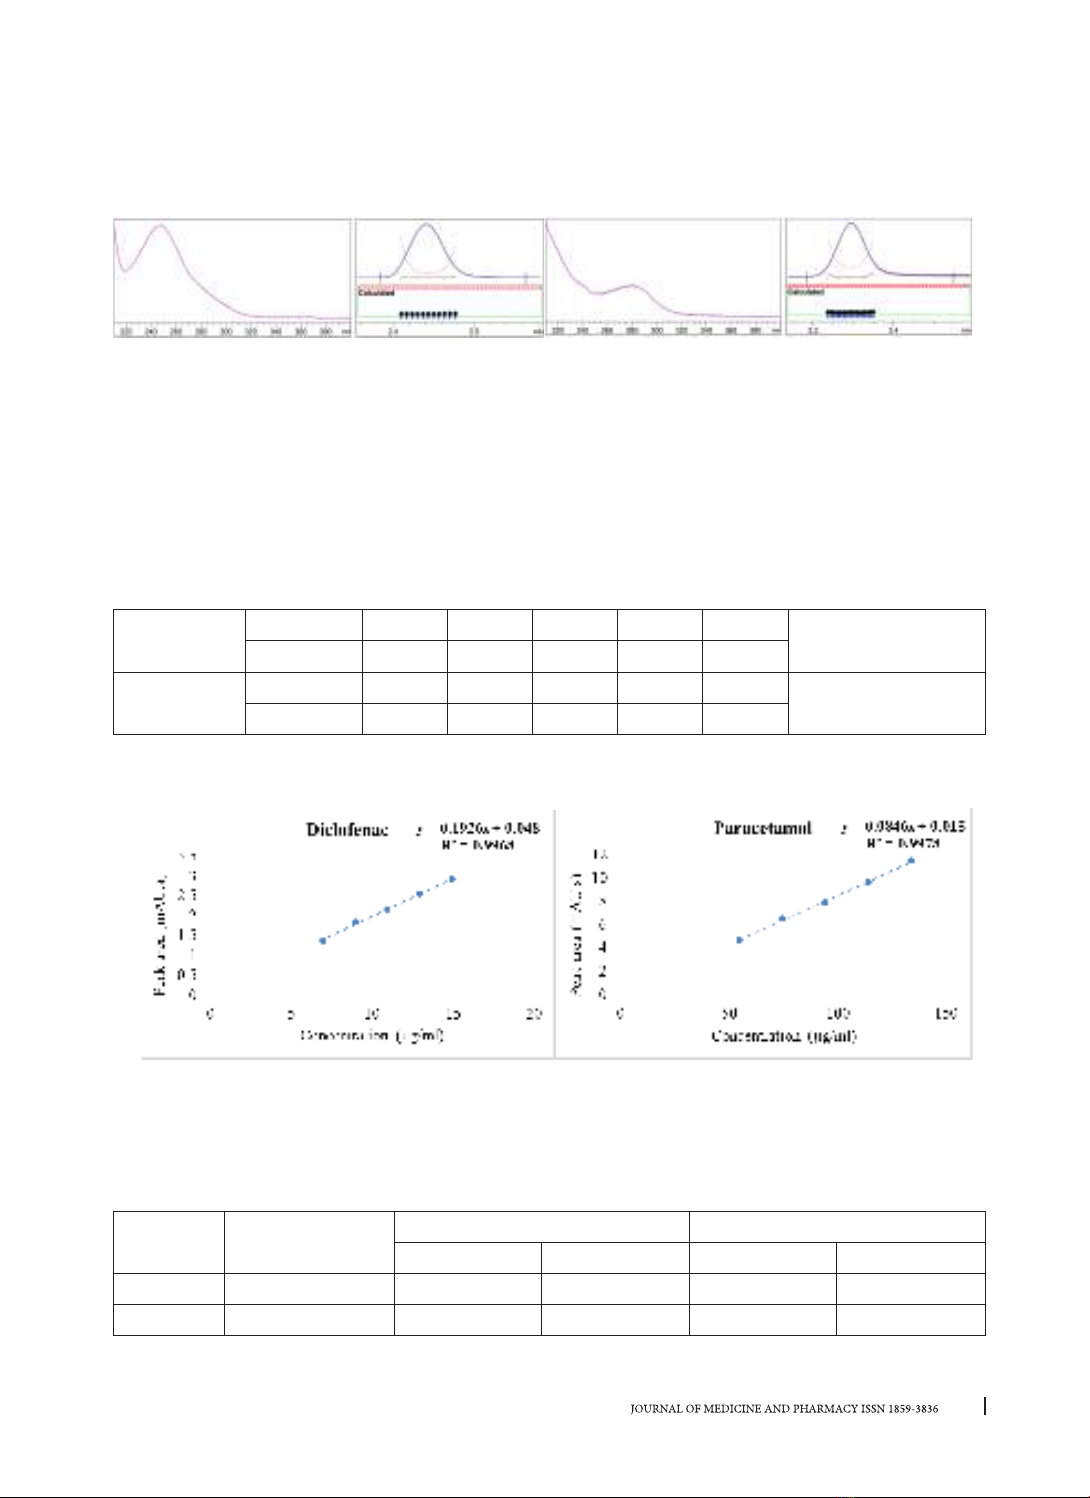
detector at 276 nm. The method was validated for the capillary zone electrophoresis system compatibility,
specificity, linearity range, precision, and accuracy in accordance with AOAC standards. Conclusions: The
developed capillary zone electrophoresis method can be applied to simultaneously determine paracetamol
and diclofenac in pharmaceutical formulations on the market.
Keywords: Capillary zone electrophoresis, paracetamol, diclofenac.
Corresponding author: Thai Khoa Bao Chau, email: tkbchau@huemed-univ.edu.vn
Received: 6/8/2020, Accepted: 14/9/2020
1. BACKGROUND
Paracetamol is an antipyretic and analgesic
drug with the mechanism of inhibiting
prostaglandin synthesis in the central nervous
system. However, this active ingredient inhibits
both cyclooxygenase-1 and cyclooxygenase-2
poorly, so it has the only limited anti-inflammatory
ability. Diclofenac sodium, a salt of diclofenac, is a
popular nonsteroidal anti-inflammatory drug that
has a strong anti-inflammatory effect due to the
inhibition of prostaglandin synthesis in peripheral
inflammatory organizations. Some studies have
shown that analgesic therapy combining drugs
that act on different pain mechanisms may be
beneficial in reducing the dose of each component
and also reducing side effects. Therefore, nowadays,
products combining paracetamol and diclofenac
are available on the market to solve the problem of
managing mild to moderate pain, which typically has
the synergistic analgesia in case of musculoskeletal
disease, toothache or postoperative pain [9].
In the world, there have been a number of studies
on the simultaneous quantify of paracetamol and
diclofenac by different methods, in which the most
commonly used methods are high - performance
liquid chromatography (HPLC) [7], derivative
spectroscopy [10], and capillary electrophoresis (CE)
[11].
In Vietnam, paracetamol and diclofenac were
simultaneously quantified by high-performance
liquid chromatography [3], and derivative
spectroscopy [2]. However, up to now, there have
been no domestic studies that have announced the
simultaneous quantification of these two active
ingredients by capillary electrophoresis.
In order to propose a method for
simultaneously quantifying the mixture of two
components that can be applied in drug quality
control, and also contribute to the efficient use
of the capillary electrophoresis system with many
advantages such as separation efficiency, short
analysis times, and saving consumable supplies,
we carried out this research to develop a capillary
electrophoresis method to simultaneously
quantify paracetamol and diclofenac in
pharmaceutical formulations.
DOI: 10.34071/jmp.2020.7.2
13
Journal of Medicine and Pharmacy, Volume 10, No.7/2020
2. MATERIALS AND METHODS
2.1. Materials
Secondary standard: Paracetamol: content 99%,
control number 041519.04 follow Vietnam Phar-
macopoeia standards; diclofenac sodium: content
99.51%, control number 0517047.04 of National In-
stitute of Drug Quality Control.
Reagents: Zengesic film-coated Tablets of STA-
DA-VN Joint Venture Co., Ltd (registration number:
VD-19193-13, lot number: 540518, expiration date:
26/05/2020) and Ripaingesic film-coated tablets
of Thanh Nam pharmaceutical production trading
company limited (registration number: VD-19227-
13, lot number: 230618, expiration date: 06/2021)
Chemicals: sodium tetraborate (Na2B4O7), so-
dium hydroxide (NaOH), boric acid (H3BO3), or-
thophosphoric acid (H3PO4), disodium hydrogen
phosphate (Na2HPO4), methanol (MeOH, Merck,
Germany), double-distilled deionized water)
Instrumentation equipment: Agilent 7100 cap-
illary electrophoresis system, HI 2550 - 02 pH me-
ter (Hanna, Italy), double distilled water machine
A400D (UK), analytical balance HR-250AZ (Korea),
refrigerator preserved sample TOSHIBA (Japan), el-
masonic S100H ultrasonic cleaner (Germany), fused
– silica capillaries Agilent Technology (USA); preci-
sion glassware: volumetric flasks type 10 ml, beaker,
micropipette…
2.2. Methods
Preparation of standards
Standard stock solutions: Standard stock
solutions of paracetamol and diclofenac were
prepared by transferring 10 mg of the drug into
two separate 10 ml volumetric flasks having 5 ml
of buffers and were ultrasonicated for 5 minutes.
Finally, the volume was made up with suitable
buffers, which gave 1 mg/ml stock solutions.
Standard mixture solution: The standard
mixture solution was prepared by adding 1 ml of
paracetamol stock solution and 0.1 ml of diclofenac
stock solution in a 10 ml volumetric flask, then
added the buffer to the mark and mixed well. The
obtained concentration of paracetamol was 100
μg/ml and diclofenac was 10 μg/ml in this standard
mixture solution.
Preparation of calibration standards
Suitable aliquots of the above-prepared stock
solutions were transferred into a series of 10 ml
volumetric flasks, then completed to final volumes
with sodium tetraborate 50 mM, pH = 9 to yield
final concentrations of 55, 75, 95, 115, 135 µg/
ml (paracetamol), and 7, 9, 11, 13, 15 µg/ml
(diclofenac).
Sample treatment
For the analysis of pharmaceutical preparations,
20 tablets were pulverized and an average weight
of a single tablet, equivalent to 500 mg paracetamol
and 50 mg diclofenac, was weighed, transferred
to a 100 ml volumetric flask and diluted with
buffer to the mark. The content of the flask was
ultrasonicated for 10 minutes, and the solution
was filtered through a 0.45 μm syringe filter. 1 ml
filtrate was transferred to a 10 ml flask and diluted
with buffer to the mark.
Blank sample: Working buffer solution
CE Method Development
Fixed electrophoresis conditions are as follows:
uncoated fused-silica capillary column of a total
length of 50 cm (effective length 41.5 cm) [8];
capillary temperature: 250C [8]; injection pressure
35 mbar and injection time 4s, wavelength 276 nm
[1].
Experiment to select buffer solution type, buffer
solution concentration, buffer solution pH, and
voltage on capillary ends.
Validation of the method
The method was validated according to AOAC
2016 (Association of Official Analytical Chemists)
and ICH 2005 guidelines (International Conference
on Harmonisation) about the validation of analytical
procedures including the following criteria: system
compatibility, specificity, linearity range, precision,
and accuracy.
Processing statistics are calculated based on
Microsof Excel 2016 software.
3. RESULTS
3.1. CE Method Development
The experiments were conducted to select
buffer type and concentration, pH, applied voltage,
combined with the fixed parameters: the uncoated
fused-silica capillary column of a total length of
50 cm (effective length 41.5 cm) [8], the inner
diameter of 50 µm, sample injection mode 35 mbar
for 4s, capillary temperature: 250C [8], detection
wavelength 276 nm [1].
The optimum conditions determined were as
follows: sodium tetraborate buffer solution 50 mM,
pH = 9, the voltage applied 30 kV.
3.2. Validation of the method
3.2.1. System suitability
Capillary electrophoresis system suitability was
determined by repeated injection of 6 standard
solutions of paracetamol 100 µg/ml and diclofenac
10 µg/ml. Results of the capillary electrophoresis
system suitability are presented in Table 1.
14
Journal of Medicine and Pharmacy, Volume 10, No.7/2020
Table 1. Results of capillary electrophoresis system suitability (n = 6)
Serial
Number
Paracetamol Diclofenac
RS
TR
(min)
S
(mAu.s)
N AsTR (min) S
(mAu.s)
N As
12.07 8.10 12744.00 1.00 3.08 1.97 12738.00 0.90 10.87
22.08 7.92 13512.00 1.00 3.09 2.03 11955.00 0.90 10.95
32.08 7.85 13057.00 1.00 3.08 2.00 12880.00 0.90 11.04
42.10 7.84 13512.00 1.00 3.19 2.01 9474.00 0.90 10.65
52.11 7.86 13496.00 1.00 3.22 1.92 9634.00 0.90 10.83
62.10 7.94 13588.00 1.00 3.16 2.03 11124.00 1.00 11.10
Average 2.09 7.92 13318.17 1.00 3.14 1.99 11300.83 0.92 10.91
RSD% 0.76 1.21 2.55 0.00 1.96 2.19 13.21 4.45 1.49
n is the number of experiments
TR: Retention time; S: Peak area; N: Plate theory; R: Resolution; As: Asymmetry
According to Table 1, the relative standard deviation of retention time and peak area are within the
permissible range (<3.0%) [1]. This proves that the capillary electrophoresis system is suitable for the
simultaneous determination of paracetamol and diclofenac.
3.2.2. Specificity
Conduct analysis of the blank, the mixed standard solution, the Zengesic and Ripangesic samples. Electro-
pherograms are shown in Figure 1.
(a) (b)
(c) (d)
Figure 1. Electropherogram
a. Blank sample; b. Standard mixture solution; c. Zengesic tablet; d. Ripangesic tablet
The selectivity of the method was tested by comparing the electropherogram of standard solutions
and commercial pharmaceutical product solutions containing an equivalent concentration of analytes. No
interference occurred from excipients with the drug peaks of the studied analytes during the analysis of
formulation samples. Electropherogram showed no peaks of paracetamol and diclofenac in the blank. The
sample had a characteristic paracetamol peak at 2.0 minutes and a diclofenac peak at 3.0 minutes; which has
15
Journal of Medicine and Pharmacy, Volume 10, No.7/2020
similar retention time to those in the standard mixture solution. The UV spectroscopy test of the standard
solution by PDA detector and the purity index in Figure 2 showed that the two peaks having high purity with
the purity of paracetamol and diclofenac are both 0.999. The above results showed that the method has
good specificity.
(a) (b)
Figure 2. UV spectrum and peak purity
(a) Paracetamol; (b) Diclofenac
3.2.3. Linearity range
The stock solutions were diluted with buffer solution to secondary standard solutions with an accurate
concentration of about 55 - 135 µg/ml for paracetamol and 7-15 µg/ml for diclofenac.
The linear relationships between the concentration of the two analytes and the corresponding peak
height were investigated under the optimum separation conditions. The regression equations and correlation
coefficients are presented in Table 2. The calibration curves were plotted for paracetamol and diclofenac in
Figure 3.
Table 2. Linearity regression data for the CE separation of paracetamol and diclofenac
Paracetamol C (µg/ml) 54.45 74.25 94.05 113.85 133.65 y = 0.0846x + 0.015
R² = 0.9978
A (mAU.s) 4.59 6.46 7.84 9.56 11.42
Diclofenac C (µg/ml) 6.97 8.96 10.95 12.94 14.93 y = 0.1926x + 0.048
R² = 0.9968
A (mAU.s) 1.35 1.83 2.15 2.54 2.91
The linear regression data for the calibration curves showed good linear relationships between peak area
and concentration. The correlation of coefficient (r) was found to be 0.9989 and 0.9984 for paracetamol and
diclofenac, respectively.
Figure 3. Calibration curve of paracetamol and diclofenac
3.2.4. Precision
To assess the repeatability of the method, 6 separate weighing samples of Zengesic film-coated tablets
were analyzed by the proposed methods. The samples were prepared using the procedure given in Section
2.2. The results of repeatability assessment of CE method were presented in Table 3.
Table 3. The results of the repeatability assessment of the CE method
S.No Weight of sample
taken (mg)
Paracetamol Diclofenac
S (mAu.s) Content % S (mAu.s) Content %
1671.90 8.53 100.57 1.97 99.67
2671.70 8.25 97.32 1.94 98.39
16
Journal of Medicine and Pharmacy, Volume 10, No.7/2020
3672.60 8.27 97.38 2.03 102.75
4671.10 8.40 99.16 2.00 101.19
5671.80 8.42 99.32 1.98 100.30
6671.90 8.37 98.51 1.96 98.85
Average 98.71 100.19
RSD% 1.26 1.60
As can be seen from Table 3, the present method is precise in all sample applications which meet the
guideline on validation of analytical methods by AOAC with relative standard deviation RSD for paracetamol
less than 1.3% (1.26%) and RSD for diclofenac less than 1.9% (1.60%) [5].
3.2.5. Accuracy
To study the accuracy of the developed method, a recovery study was carried out by using the standard
addition method at two different levels for Zengesic film-coated tablets and then calculated the % recoveries.
The amounts of the added standard were approximately 10%, 20%, and 30% of the total amounts of each
active ingredient in the tablet. The recovery study was performed three times at each level and analyzed by
the proposed methods, the results were shown in Table 4.
Table 4. % Recovery of paracetamol and diclofenac in combined dosage form
Name of
compound
% Added Serial
Number
Amount
added
Peak area
(mAU.s)
%
recovery
Average RSD%
Paracetamol
10%
149.70 9.12 98.01
98.66 0.74250.00 9.29 99.46
349.60 8.98 98.51
20%
199.60 9.99 100.37
100.16 0.802100.50 10.14 99.28
3100.60 9.87 100.84
30%
1151.10 10.73 100.84
99.98 0.772157.20 10.80 99.36
3152.10 10.86 99.72
Diclofenac
10%
15.20 2.19 101.86
100.43 1.5825.00 2.19 98.73
35.10 2.14 100.71
20%
19.90 2.36 99.06
100.53 1.4529.70 2.37 100.56
310.00 2.33 101.97
30%
116.20 2.55 98.10
99.92 1.61217.10 2.60 100.52
315.10 2.57 101.15
Average recoveries for paracetamol were from 98.01 to 100.84% and diclofenac were from 98.10 to
101.97%. That are between the AOAC recommended ranges 98 102% for both paracetamol and di-
clofenac [5].
3.3. Application
The developed method has been applied for the determination of paracetamol and diclofenac from phar-
maceutical preparations. The samples were prepared using the procedure given in Section 2.2. The resulting
contents of the analytes in the samples are listed in Table 5.