169
8
MULTISENSOR ARCHITECTURES
AND ERROR PROPAGATION
8-0 INTRODUCTION
The purpose of this chapter is to extend the data acquisition error analysis of the
preceding chapters to provide understanding about how errors originating in multi-
sensor architectures combine and propagate in algorithmic computations. This de-
velopment is focused on the wider applications of sensor integration for improving
data characterization rather than the narrower applications of sensor fusion em-
ployed for data ambiguity reduction.
Three diverse multisensor instrumentation architectures are analyzed to explore
error propagation influences. These include: sequential multiple sensor informa-
tion acquired at different times; homogeneous information acquired by multiple
sensors related to a common description; and heterogeneous multiple sensing of
different information that jointly describe specific features. These architectures are
illustrated, respectively, by multisensor examples of airflow measurement through
turbine engine blades, large electric machine temperature modeling, and in situ
material measurements in advanced process control. Instructive outcomes include
the finding that mean error values aggregate with successive algorithmic propaga-
tion whose remedy requires minimal inclusion.
8-1 MULTISENSOR FUSION, INTEGRATION, AND ERROR
The preceding chapters have demonstrated comprehensive end-to-end modeling of
instrumentation systems from sensor data acquisition through signal conditioning
and data conversion functions and, where appropriate, output signal reconstruction
and actuation. These system models beneficially provide a physical description of
instrumentation performance with regard to device and system choices to verify ful-
fillment of measurement accuracy, defined as the complement of error. Total instru-
Multisensor Instrumentation 6
Design. By Patrick H. Garrett
Copyright © 2002 by John Wiley & Sons, Inc.
ISBNs: 0-471-20506-0 (Print); 0-471-22155-4 (Electronic)

mentation error is expressed as a sum of static mean error contributions plus the one
sigma root-sum-square (RSS) of systematic and random error variances as a percent
of full-scale amplitude. This is utilized throughout the text as a unified measure-
ment instrumentation uncertainty description. Its components are illustrated in Fig-
ure 1-1, applicable to each system element beginning with the error of a sensor rel-
ative to its true measurand, and proceeding with all inclusive device and
instrumentation system error contributions.
Chapter 4, Section 4-4 reveals that combining parallel–redundant instrumenta-
tion systems serves to reduce only the systematic contributions to total error
through averaging, whereas mean error contributions increase additively to signifi-
cantly limit the merit of redundant systems. This result emphasizes that good instru-
mentation design requires minimization of mean error in the signal path as shown
for band-limiting filters in Chapter 3. Conversely, additive interference sources are
generally found to be insignificant error contributors because of a combination of
methods typically instituted for their attenuation. Modeled instrumentation system
error, therefore, valuably permits performance to be quantitatively predicted a priori
for measurement confidence and data consistency such as sensed-state process ob-
servations. Confidence to six sigma is defined for a system as its static mean error
plus six times its RSS 1error.
Sensor fusion is primarily limited to medical imaging and target recognition ap-
plications. Fusion usually involves the transformation of redundant multisensor
data into an equivalent format for ambiguity reduction and measured property re-
trieval otherwise unavailable from single sensors. Data fusion often extracts multi-
ple image or target parametric attributes, including object position estimates, fea-
ture vector associations, and kinematics from sources such as sub-Hz seismometers
to GHz radar to Angstrom-wavelength spectrometers. Sonar signal processing, il-
lustrated in Figure 8-1, illustrates the basics of multisensor fusion, whereby a sensor
array is followed by signal conditioning and then signal processing subprocesses,
concluding in a data fusion display. Sensor fusion systems are computationally in-
tensive, requiring complex algorithms to achieve unambiguous performance, and
are burdened by marginal signal quality.
This chapter presents multisensor architectures commonly encountered from in-
dustrial automation to laboratory measurement applications. With these multisen-
sor information structures, data are not fused, but instead nonredundantly integrat-
ed to achieve better attribution and feature characterization than available from
single sensors. Three architectures are described that provide understanding con-
cerning integrated multisensor error propagation, where propagation in algorith-
mic computations is evaluated employing the relationships defined in Table 8-1. A
sequential architecture describes multisensor data acquired in different time inter-
vals, then a homogeneous architecture describes the integration of multiple mea-
surements related to a common description. Finally, a heterogeneous architecture
describes nonoverlapping multisensor data that jointly account for specific fea-
tures. The integration of instrumentation systems is separately presented in
Chapter 9.
170 MULTISENSOR ARCHITECTURES AND ERROR PROPAGATION

8-1 MULTISENSOR FUSION, INTEGRATION, AND ERROR 171
FIGURE 8-1. (a) Sonar redundant sensor fusion; (b) molecular beam epitaxy nonredundant
integration.

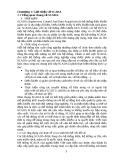
8-2 SEQUENTIAL MULTISENSOR ARCHITECTHRE
Figure 8-2 describes a measurement process applicable to turbine engine manufac-
ture for determining blade internal airflows, with respect to design requirements,
essential to part heat transfer and rogue blade screening. A preferred evaluation
method is to describe blade airflow in terms of fundamental geometry such as its ef-
fective flow area. The implementation of this measurement process is described by
analytical equations (8-1) and (8-2), where uncontrolled air density
appears as a
ratio to effect an air-density-independent airflow measurement. That outcome bene-
ficially enables quantitative determination of part airflows from known parameters
and pressure measurements defined in Table 8-2. The airflow process mechaniza-
tion consists of two plenums with specific volumetric airflows and four pressure
measurements.
172 MULTISENSOR ARCHITECTURES AND ERROR PROPAGATION
TABLE 8-1. Instrumentation Error Algorithmic Propagation
Instrumentation Algorithmic
Error Operation Error Influence
Addition ⌺
苶
m
苶
e
苶
a
苶
n
苶
%FS
Subtraction ⌺
苶
m
苶
e
苶
a
苶
n
苶
%FS
苶
m
苶
e
苶
a
苶
n
苶
%FS
Multiplication ⌺
苶
m
苶
e
苶
a
苶
n
苶
%FS
Division ⌺
苶
m
苶
e
苶
a
苶
n
苶
%FS
Power function ⌺
苶
m
苶
e
苶
a
苶
n
苶
%FS × |exponent value|
Addition RSS
%FS 1
Subtraction RSS
%FS 1
%FS 1
Multiplication RSS
%FS 1
Division RSS
%FS 1
Power function RSS
%FS 1× |exponent value|
FIGURE 8-2. Multisensor airflow process.

In operation, the fixed and measured quantities determine part flow area employ-
ing two measurement sequences. Plenum volumetric airflows are initially recon-
ciled for Pitot stagnation pressures P
o
– P
o
obtaining the plenums ratio of internal
airflow velocities V
p1
/V
r1
. The quantities are then arranged into a ratio of plenum
volumetric airflows that combined with gauge and differential pressure measure-
ments P
r1
, P
atm
, and P
p1
– P
r1
permit expression of air-density-independent part
flow area A
P2
of equation (8-2). Equation (8-3) describes sequential multisensor er-
ror propagation determined from the influence of analytical process equations (8-1)
and (8-2) with the aid of Table 8-1. Part flow area error is accordingly the algorith-
mic propagation of four independent pressure sensor instrumentation errors in this
two-sequence measurement example, where individual sequence errors are summed
because of the absence of correlation between the measurements each sequence
contributes to the part flow area determination.
⌬P
o
= (P
p1
+ l
–
2
V
2
p1
) – (P
r1
+ l
–
2
V
2
r1
)P
o
equilibrium sequence (8-1)
A
P2
= A
P1
·冤冥
1/2
part flow area sequence (8-2)
In the first sequence, an equalized Pitot pressure measurement ⌬P
o
is acquired
defining Bernoulli’s equation (8-1). The algorithmic influence of this pressure mea-
surement is represented by the sum of its static mean plus single RSS error contri-
bution in the first sequence of equation (8-3). The second measurement sequence is
defined by equation (8-2), whose algorithmic error propagation is obtained from
– 2(P
p1
– P
r1
)/V
2
r1
ᎏᎏᎏ
+ 2(P
r1
– P
atm
)/V
2
r1
8-2 SEQUENTIAL MULTISENSOR ARCHITECTURE 173
TABLE 8-2. Airflow Process Parameter Glossary
Known Airflow Process Parameters Measured Airflow Process Parameters
_________________________________ ______________________________________
Symbol Value Description Symbol Value Description
Reference plenum A
P2
ft
2
Part effective flow area
ᎏ
m
r
ᎏ
ᎏ
m
ft
i
3
n
ᎏ
volumetric flow
A
r1
ft
2
Reference plenum P
p1
– P
r1
lb/ft
2
Part-to-reference plenum
inlet area differential pressure
V
r1
Reference plenum P
r1
lb/ft
2
Reference plenum gauge
ᎏ
m
f
i
t
n
ᎏ
inlet velocity pressure
A
P1
ft
2
Part plenum inlet P
o
– P
o
lb/ft
2
Reference part plenum
area equalized stagnation
pressures
0.697E-6 Air density at P
p2
P
atm
lb/ft
2
Part plenum exit
standard temperature pressure
ᎏ
lb –
ft
m
4
in
ᎏ
and pressure
·


![SCADA, DCS: Tìm hiểu và ứng dụng trong công nghiệp [A-Z]](https://cdn.tailieu.vn/images/document/thumbnail/2013/20130701/lilinz/135x160/5571372680022.jpg)

![DCS và SIS: Khái niệm và Thực tiễn [Cập nhật mới nhất]](https://cdn.tailieu.vn/images/document/thumbnail/2013/20130623/sea123123/135x160/1504773_269.jpg)


![Đề cương đề tài nghiên cứu khoa học [chuẩn nhất/mới nhất]](https://cdn.tailieu.vn/images/document/thumbnail/2025/20251117/duong297/135x160/26111763433948.jpg)