
* Corresponding author.
E-mail addresses: sheiskii@bk.ru (V. A. Isheyskiy)
© 2017 Growing Science Ltd. All rights reserved.
doi: 10.5267/j.esm.2017.4.001
Engineering Solid Mechanics (2017) 199-204
Contents lists available at GrowingScience
Engineering Solid Mechanics
homepage: www.GrowingScience.com/esm
Determination of rock mass weakening coefficient after blasting in various fracture
zones
Valentin Aleksandrovich Isheyskiya* and Mikhail Anatolyevich Marinina
aSaint-Petersburg Mining University, 21 line, 2, Saint-Petersburg, 199106 Russia
A R T I C L EI N F O A B S T R A C T
Article history:
Received 6 January, 2017
Accepted 9 April 2017
Available online
9 April 2017
Quality of blast preparation for rock beneficiation influences both on integrity of mineral stock
in particular and in economical performances of enterprise operations in general. While rock
processing for obtaining of crushed stone the yield of screenings is high, its amounts depend
on rock strength properties. Investigation into the influence of drilling and blasting parameters
on strength properties of blasted rocks is an urgent research and practical task for mining
companies producing building stones. This article discusses results of full-scale experiment
aimed at determination of strength of blasted rocks in shotpile with accounting for fracture
zones as a function of rock massif saturation with energy of explosive substance.
© 2017 Growing Science Ltd. All rights reserved.
Keywords:
Full-scale experiment
Energy parameters
Strength properties
Rocks, blast
Fracture zones
Rock strength
1. Introduction
Management of natural resources becomes more and more important upon development of resource
intensive technologies. Reasonable management of natural resources as a system of scientific,
industrial, and structural essence assumes the most complete use of mined natural resources and, as a
consequence, decrease in amount of consumed resources, provision of recovery and reasonable use of
natural resources (Bozhenov, 1994). Development of resource saving mining activities should be based
on comprehensive investigation into mineral base, versatile estimation of destructed rocks and mined
mineral resources. One of major issues in the field of aggregates is uncontrollable yield of screenings.
For instance, upon production of gravel on the basis of granite, gabbro-diorite, basalt the average yield
of screenings is 25%, and on the basis of carbonates is approximately 35% (Kharo et al., 2003).

200
Blasting impact on fractured massif leads to decrease in strength properties of rocks, which
influences significantly on the yield of screenings at processing stage. Numerous works are devoted to
this aspect (e.g. Akande & Lawal, 2013; Inoue et al., 2014; Sasaoka et al., 2015, Yugo & Shin 2015).
This article continues integrated studies discussed elsewhere (Paramonov et al. 2014; Isheysky &
Yakubovskii, 2016; Isheysky, 2014). On the basis of simulations described by Paramonov and Isheysky
(2014), a series of rock massif blasting with various specific consumptions was performed at
Gavrilovskoe-1 open cast mine. Nitronit E-70 was used as explosive substance in all three series.
Specific consumption was varied by means of narrower borehole pattern. Table 1 summarizes
parameters of drilling and blasting in various series.
Table 1. Parameters of drilling and blasting activities
Description Units of
measurement Values
Blast No. - 1 2 3
Diameter - d mm 144 144 144
Subdrill depth - Lsub m 1.4 1.4 1.4
Drill depth - Ldr m 13.4 13.4 13.4
Distance between drills in a row - a m 4.5 4.0 4.0
Distance between rows - b m 4.5 4.5 4.0
Stemming length -
s
tem
l m 3.0 3.0 3.0
Loaded length - load
l m 10.4 10.4 10.4
ES capacity in 1 m of drill - Р kg 16.4 16.4 16.4
Load weight in drill - Q kg 220 220 220
Average yield g/m from drill - Vdrill m3 243 216 192
ES specific consumption - q kg/m3 0.9 1.01 1.14
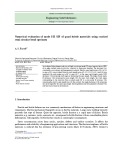
2. Experimental study
Strength properties of raw stock delivered to factory were estimated by strength of averaged rock
from shotpile. In order to determine averaged rock the shotpile photo was taken was after each
excavation. The shotpile was conventionally separated into 12 intervals. Planimetric analysis was
performed using linear approach. The shotpile was outlined by measuring tape marked by black and
white stripes. The tape is applied each 10 meters. Photos were taken from the distance of 10 meters to
the shotpile using two cameras.
Table 2. Average rock size
Sampling zone Blast No.
№1 №2 №3
1-1 0.380 0.385 0.421
1-2 0.401 0.330 0.237
1-3 0.310 0.280 0.314
2-1 0.267 0.380 0.374
2-2 0.370 0.355 0.251
2-3 0.330 0.320 0.398
3-1 0.340 0.360 0.325
3-2 0.385 0.315 0.341
3-3 0.478 0.261 0.242
4-1 0.258 0.365 0.372
4-2 0.350 0.251 0.352
4-3 0.285 0.452 0.289
Avg. 0.346 0.337 0.326
V. A. Isheyskiy and M. A. Marinin / Engineering Solid Mechanics 5 (2017)
201
Table 3. Average compression strength
Sampling zone Average compression strength. MPa
№1 №2 №3
1-1 218.0 199.5 184.3
1-2 197.0 210.0 201.4
1-3 228.1 201.4 183.7
2-1 224.0 221.5 175.4
2-2 189.5 209.0 197.0
2-3 215.0 201.0 191.0
3-1 221.0 205.0 187.5
3-2 225.0 203.3 183.0
3-3 208.5 192.3 194.0
4-1 221.0 193.0 174.0
4-2 224.4 187.5 188.3
4-3 207.0 205.0 181.1
Avg. 215.0 202.0 182.0
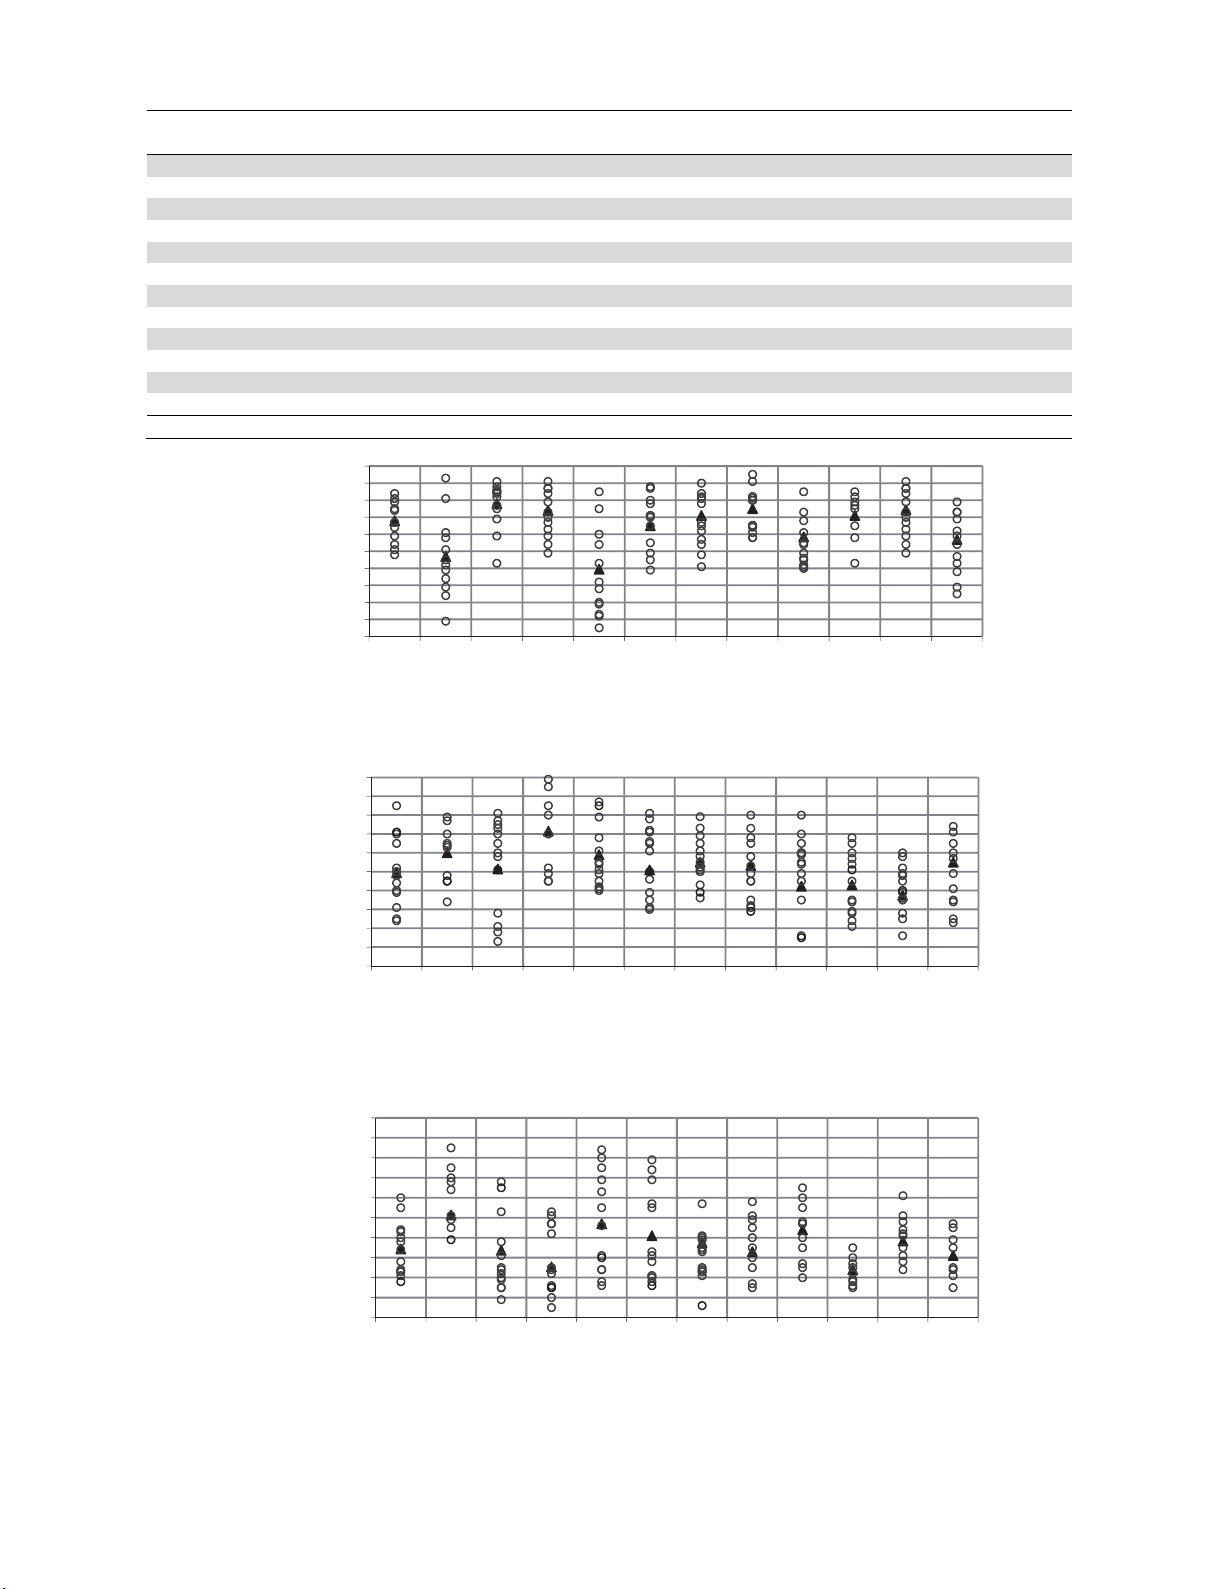
Blast No. 1
Blast No. 2
Blast No. 3
Fig. 1. Average strength of average size rock from various shotpile zones.
218
197
228.1 224
189.5
215 221 225
208.5
221 224.4
207
150
160
170
180
190
200
210
220
230
240
250
1-11-21-32-12-22-33-13-23-34-14-24-3
Compressive strength (MPa)
Interval No.
199.5
210
201.4
221.5
209
201 205 203.3
192.3 193 187.5
205
150
160
170
180
190
200
210
220
230
240
250
1-11-21-32-12-22-33-13-23-34-14-24-3
Compressive strength (MPa)
Interval No.
184.3
201.4
183.7
175.4
197 191 187.5 183
194
174
188.3
181.1
150
160
170
180
190
200
210
220
230
240
250
1-11-21-32-12-22-33-13-23-34-14-24-3
Compressive strength (MPa)
Interval No.
202
The obtained photos were initially processed using MapInfo GIS software and then using WipFrag
software according to the procedure described elsewhere (Maerz et al., 1996; Maerz, 1996). Size
averaged rock was taken after each excavation. Linear parameters of average rock were measured
directly in mine. Length, height, and width were measured. The measured values were summarized in
Tables 2 and 3. Spot sample was taken from various points. The sizes of average rock from various
zones of shotpile are shown in Table 2. Samples for testing were prepared from mined rocks. Rock
samples for laboratory studies were prepared by drilling of cores from sampled rocks after blasting and
provision of required shapes and sizes using appropriate stone cut equipment (Broch & Franklin 1972).
Sizes and amount of prepared rock samples were selected individually for each batch taking into
account optimum combination of requirements to sample representativity and its actual amount. Upon
testing the samples with flat parallel edges, perpendicular to smooth side surface, were destroyed by
compression using an MTS hydraulic press machine. The testing results are illustrated in Fig. 1 and
summarized in Table 3. Specific consumption for various blasting series can be expressed by specific
energy intensity using the following equation:
QqE , MJ/m3, (1)
where Q is the specific energy, MJ/kg; q is the specific consumption of explosive substance, kg/m3.
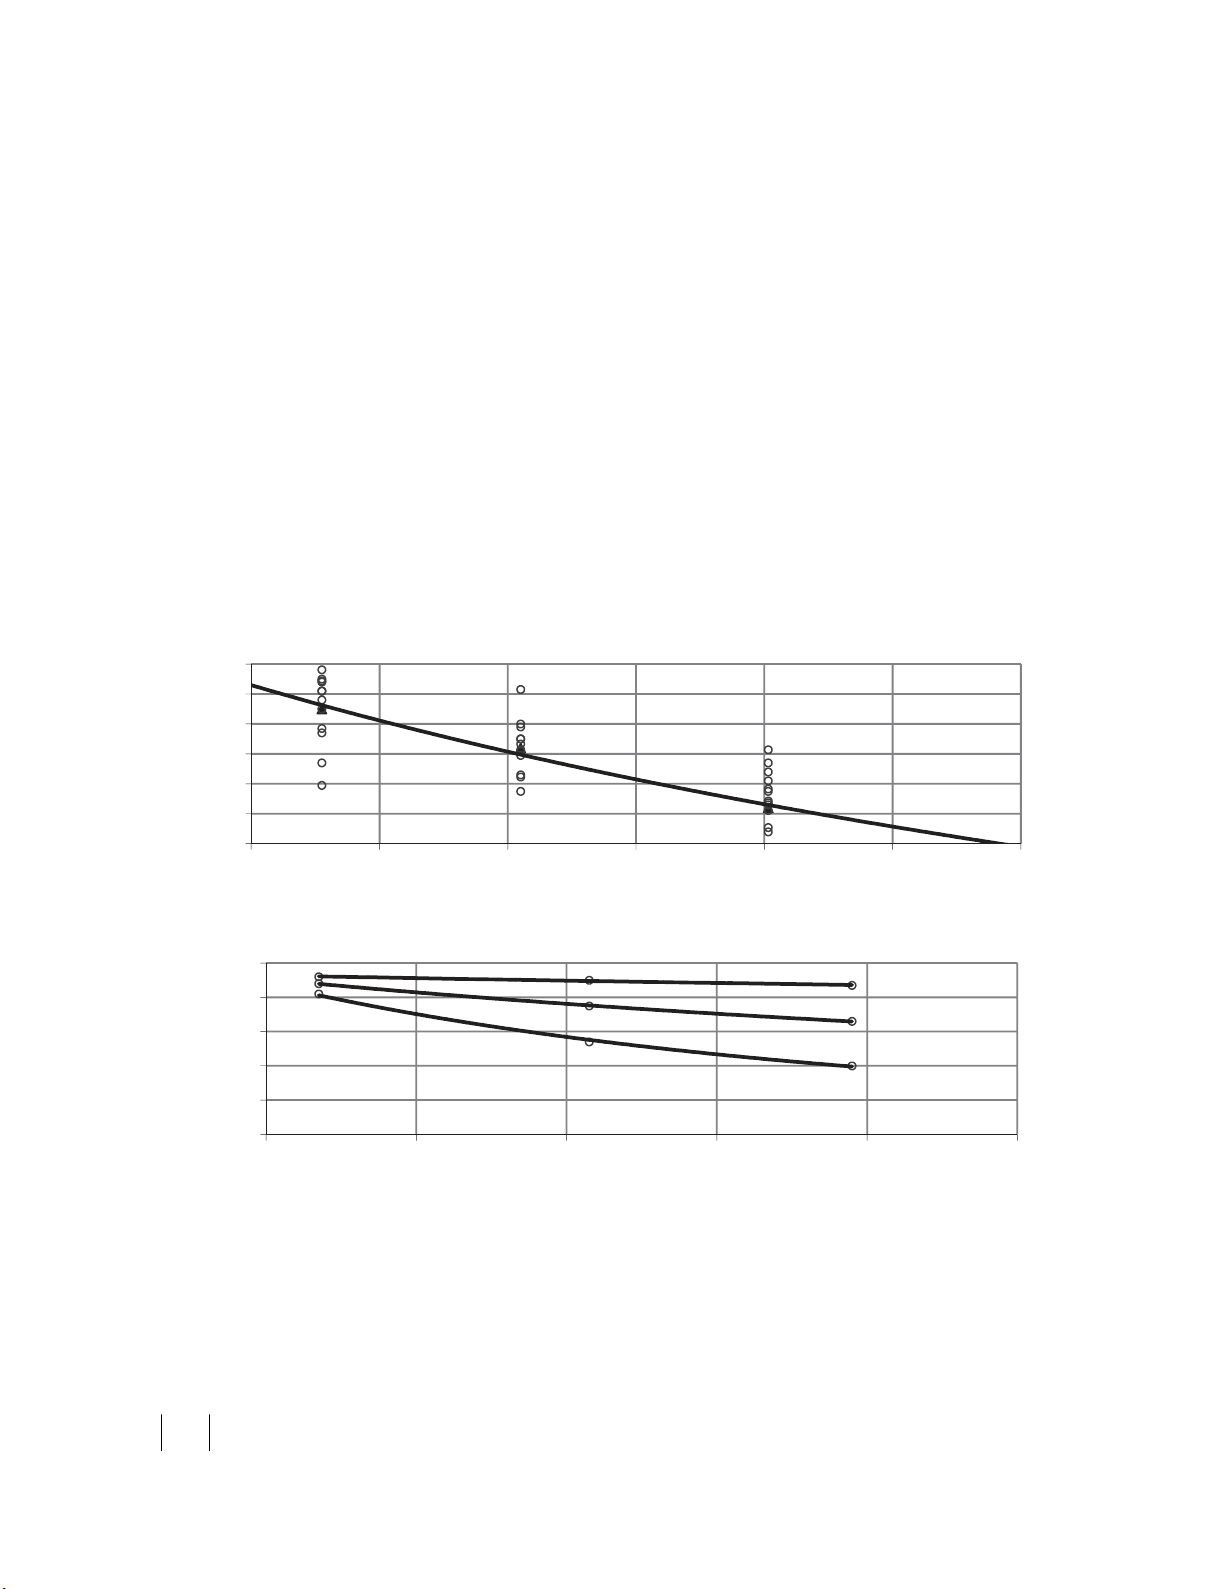
On the basis of Table 3 and using Eq. (1) let us plot strength variation of average rock as a function of
specific energy intensity (see Fig. 2):
Fig. 2. Average rock strength as a function of specific energy intensity.
Fig. 3. Rock mass weakening coefficient as a function of specific energy intensity with regard to
distance from blast source
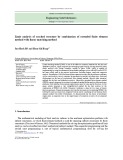
3. Results and discussion
On the basis of plotting we obtained power law dependence which enables forecasting of
compressive strength of averaged rock supplied to crushing as a function of specific energy intensity:
0,7
426.25
comp avg E
, (2)
215
202
182
V=426,25x‐0,7
R²=0,98
170
180
190
200
210
220
230
2.5 2.7 2.9 3.1 3.3 3.5 3.7
Compressive strength (MPa)
Energy intensity (MJ/m3)
E=13,13x‐2,9
E=2,67x‐1,1
E=1,14x‐0,2
0
0.2
0.4
0.6
0.8
1
2.52.72.93.13.33.5
Coefficient of strucral
fracturing
Energy intensity (MJ/m3)
V. A. Isheyskiy and M. A. Marinin / Engineering Solid Mechanics 5 (2017)
203
where E is the specific energy intensity, MJ/m3; .comp avg
is the compressive strength of averaged rock,
MPa. Taking into account the results in (Maerz, 1996; Kharo et al., 2003), and considering for the fact
that the strength of averaged blasted rock is a function of distance to blasting source (Akande & Lawal,
2013), it is possible to express the rock mass weakening coefficient for uniaxial compressive strength
of granite with regard to unbroken material in each zone as a function of energy intensity. The
dependences of structural weakening in various zones are illustrated in Fig. 3. Therefore, the strength
of averaged rock after blasting with consideration for fracturing zone can be expressed as follows:
n
1
i
comp comp i
avg m
itot
V
kV
, (3)
where Vi is volume of destruction zone, m3; Vtot is the volume of all zones, m3; comp m
is the uniaxial
compressive strength of rocks before blasting, MPa; ki is the coefficient of strength weakening in a
zone; n is the number of destruction zones.
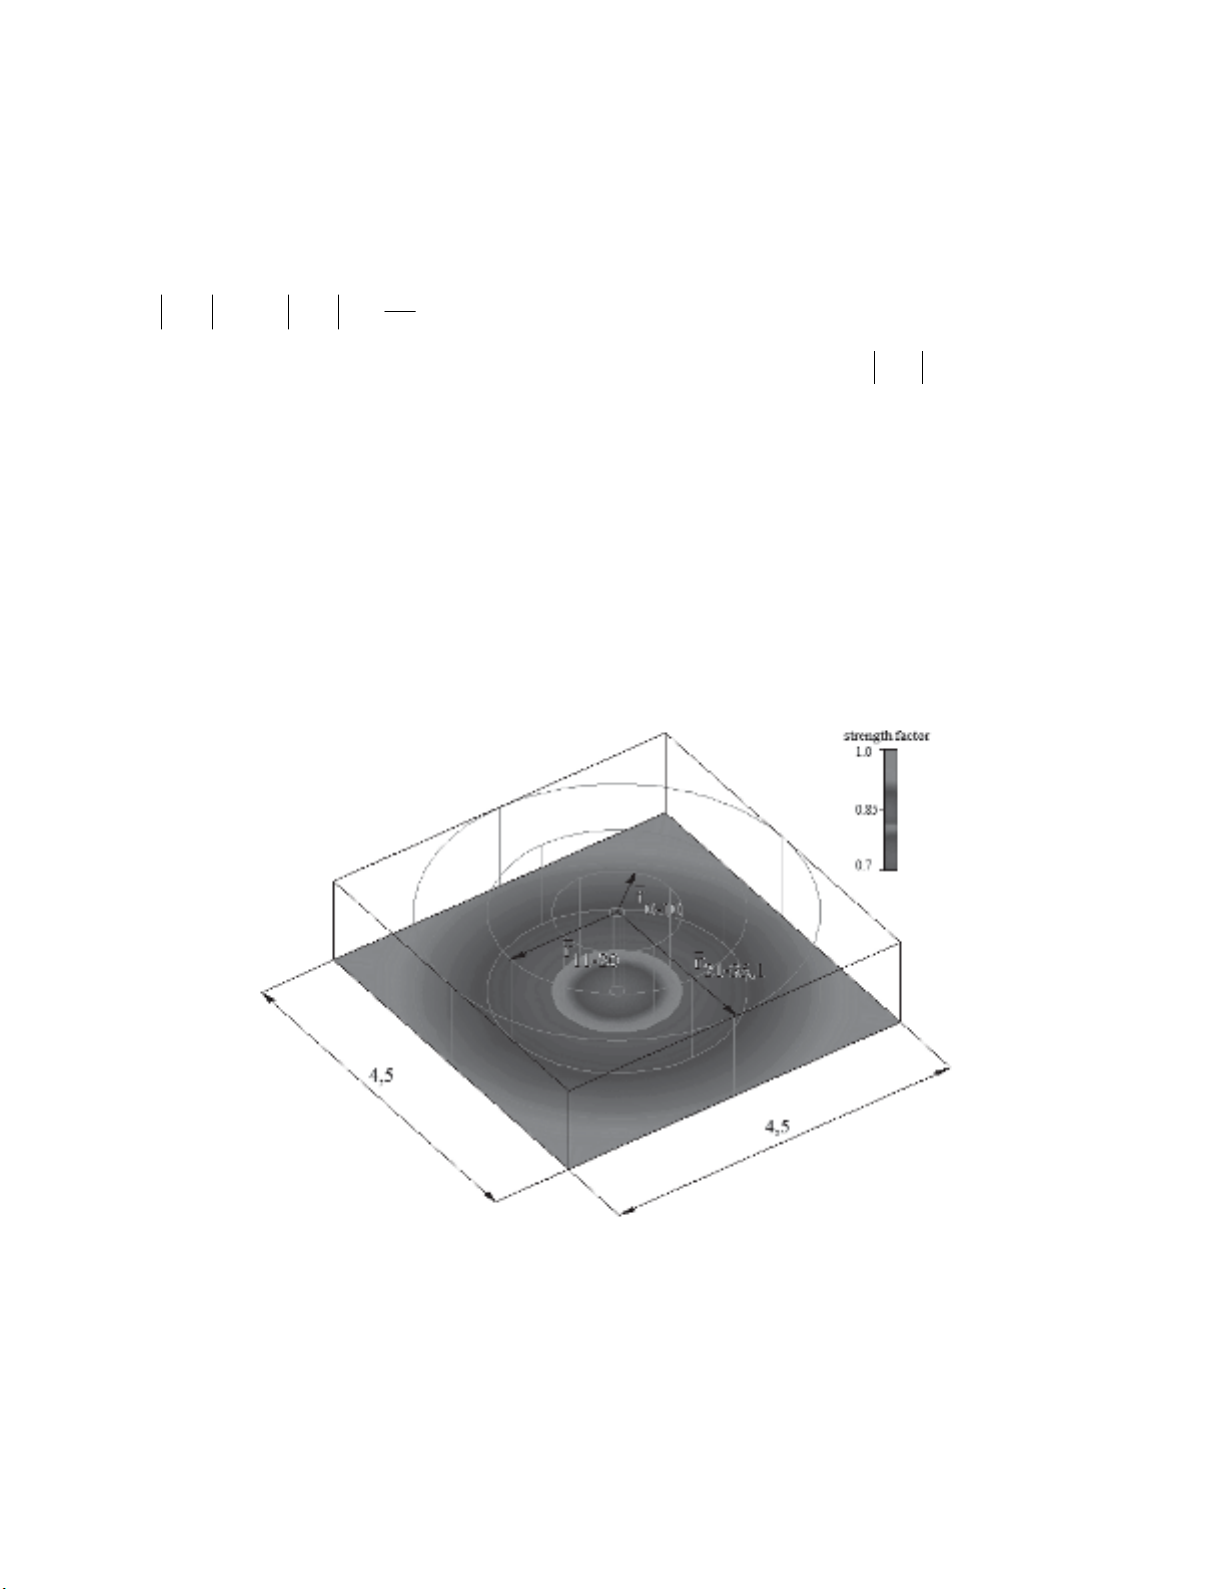
Validation of Eq. (3) for the experimental conditions of the open cast mine was performed on the
basis of blasting data and by comparison with the obtained Eq. (2). On the basis of results in Paramonov
et al. (2014) and using MathCAD software the strength of averaged rock was calculated by Eq. (3). The
example of output data for blasting No. 1 is illustrated in Fig. 4. The uniaxial compressive strength of
granite for the considered conditions was 240 MPa. Specific energy intensity of the massif according
to Eq. (1) was 2.61 MJ. Substituting the calculated data into equations of strength weakening for zones
illustrated in Fig. 3 we obtain the uniaxial compressive strength for averaged rock in shotpile. The
calculations were compared with the experimental curve shown in Fig. 5.
Fig. 4. Distribution of coefficients of structural weakening for specific energy intensity of 2.61 MJ
(MathCAD)
4. Conclusion
On the basis of calculations and experiments ti has been established that variation of uniaxial
compressive strength of average rock as a function of ES specific energy consumption in the range
from 2.5 MJ/kg3 to 3.5 MJ/kg3 for the considered rocks is determined according to Eq. (2). It was
demonstrated that this equation can satisfactorily approximates the experimental data and therefore is


![Đề cương ôn thi Nguyên lý máy [mới nhất]](https://cdn.tailieu.vn/images/document/thumbnail/2025/20251231/cuchoami2510/135x160/90481767694770.jpg)
