RESEARCH Open Access
Polymorphisms in the SULF1 gene are associated
with early age of onset and survival of
ovarian cancer
Chan H Han
1
, Yu-Jing Huang
1
, Karen H Lu
2
, Zhensheng Liu
1
, Gordon B Mills
3
, Qingyi Wei
1
, Li-E Wang
1*
Abstract
Background: SULF1 (sulfatase 1) selectively removes the 6-O-sulphate group from heparan sulfate, changing the
binding sites for extracellular growth factors. SULF1 expression has been reported to be decreased in various
cancers, including ovarian cancer. We hypothesized that single nucleotide polymorphisms (SNPs) of SULF1 would
impact clinicopathologic characteristics.
Methods: We genotyped five common (minor allele frequency>0.05) regulatory SNPs with predicted functionalities
(rs2623047 G>A, rs13264163 A>G, rs6990375 G>A, rs3802278 G>A, and rs3087714 C>T) in 168 patients with
primary epithelial ovarian cancer, using the polymerase chain reaction-restriction fragment length polymorphism
method.
Results: We found that rs2623047 G>A was significantly associated with an early age of onset of ovarian cancer in
the G allele dose-response manner (P= 0.027; P
trend
= 0.007) and that rs2623047 GG/GA genotypes were
associated with longer progression-free survival; rs6990375 G>A was also associated with the early age of onset in
the A allele dose-response manner (P= 0.013; P
trend
= 0.009). The significant differences in age of disease onset
persisted among carriers of haplotypes of rs2623047 and rs6990375 (P= 0.014; P
trend
= 0.004). In luciferase reporter
gene assays, rs2623047 G allele showed a slightly higher promoter activity than the A allele in the SKOV3
tumorigenic cell line.
Conclusions: These findings suggest that genetic variations in SULF1 may play a role in ovarian cancer onset and
prognosis. Further studies with large sample sizes and of the mechanistic relevance of SULF1 SNPs are warranted.
Background
SULF1 is a newly identified human sulfatase with
aryl-sulfatase activities, which can influence the sulfation
status and biological function of heparan sulfate proteo-
glycans (HSPGs) [1]. This heparan sulfate 6-O-endosulfa-
tase selectively removes 6-O-sulphate group and alters
the binding sites of signaling molecules [2]. HSPGs are
protein-conjugated forms of heparin sulfate glycosamino-
glycans (HSGAGs) in vivo and major constituents of the
extracellular matrix (ECM).HSGAGsintheECMinter-
act with many signaling molecules, regulate their biologi-
cal activities, and express profound effects on cell growth
kinetics and metastasis of tumor cells [3,4]. By interacting
with numerous mediators including growth factors, cyto-
kines, chemokines, and adhesion molecules, HSGAGs are
involved in a wide array of biological processes, such as
homeostasis, anticoagulation, angiogenesis, embryogen-
esis, as well as in oncogenic transformation of normal
cells to tumor cells [5-10].
The correlation between SULF1 and cancer risk has
mainly been studied in terms of gene expression. SULF1
expression is decreased in multiple malignant lineages,
and its re-expression is known to be associated with
decreased signaling of heparin-binding growth factors,
cell proliferation, and the invasiveness of cancer cells
[11-14]. In ovarian cancer, decreased expression of
SULF1 and its correlation with decreased sensitivity to
cisplatin (a standard chemotherapeutic agent) were also
reported [12,15].
* Correspondence: lwang@mdanderson.org
1
Department of Epidemiology, The University of Texas M. D. Anderson
Cancer Center, Houston, TX 77030, USA
Full list of author information is available at the end of the article
Han et al.Journal of Experimental & Clinical Cancer Research 2011, 30:5
http://www.jeccr.com/content/30/1/5
© 2011 Han et al; licensee BioMed Central Ltd. This is an Open Access article distributed under the terms of the Creative Commons
Attribution License (http://creativecommons.org/licenses/by/2.0), which permits unrestricted use, distribution, and reproduction in
any medium, provided the original work is properly cited.

Loss of heterozygosity or hypermethylation of the pro-
moter region has been suggested as potential mechan-
isms for SULF1 down-regulation in ovarian cancer [14].
Besides, genetic variation has been implicated in altered
gene expression, especially those regulatory polymorph-
isms that are located in promoter regions [16,17]. How-
ever, genetic variation in SULF1 has not been explored
in ovarian cancer. In this study, we genotyped five com-
mon (i.e. minor allele frequency>0.05) single nucleotide
polymorphisms (SNPs) with predicted functionalities
(rs2623047 G>A, rs13264163 A>G, rs6990375 G>A,
rs3802278 G>A, and rs3087714 C>T ) to evaluate asso-
ciations between these potentially functional SULF1
SNPs and clinical outcomes in 168 ovarian cancer
patients whose DNA and clinic variables were available,
and investigated whether the promoter activity of
rs2623047 A>G may be underlying the functional
significance.
Methods
Study Population
The study population and data collection were described
previously [18]. Briefly, the 168 patients were registered
at The University of Texas M. D. Anderson Cancer
Center between 2000 and 2007 and diagnosed with his-
topathologically confirmed primary epithelial ovarian
cancer. Patients had been treated with chemotherapy, a
combination of platinum (carboplatin, cisplatin) and tax-
anes (taxol, docetaxel) following optimal debulking or
cyto-reductive surgery. Available demographic character-
istics included age at diagnosis and race, and clinico-
pathologic characteristics including tumor stage, cell
type and grade, optimality of the primary debulking
operation, chemotherapy regimen, number of che-
motherapies, disease recurrence, and response of tumors
to chemotherapy. The optimal debulking or cyto-reduc-
tive surgery is defined as the largest residual tumor
nodule measuring 1 cm or less, according to the Gyneco-
logic Oncology Group [19]. The response evaluation
criteria in solid tumors (RECIST) [20] were used to
define the response of tumors to treatment.
Overall survival (OS) and progression-free survival
(PFS) were calculated as the date of disease diagnosis to
the date of death or last contact or the date of recur-
rence or progression, accordingly. Disease recurrence
was defined as the reappearance of any lesion that had
previously disappeared or the appearance of a new
lesion that was histopathologically confirmed by a
biopsy. Information about the date of last contact and
status of patients at the last contact was obtained from
the M. D. Anderson Tumor Registry and Social Security
Death Index, when this information was missing from
the medical records. This study was approved by the M.
D. Anderson Institutional Review Board.
SNP Selection and Genotyping
Using SULF1 gene position from International HapMap
project http://hapmap.ncbi.nlm.nih.gov/cgi-perl/gbrowse/
hapmap28_B36/#search with the extension of 2 kb at both
sides to cover near gene regions (chr8:70539427..
70737701), we found that five of 355 SNPs were common
in HapMap Caucasian population with one of following
predicted functionalities at the SNP Function Prediction
website http://snpinfo.niehs.nih.gov/snpfunc.htm: (1)
affecting transcription factor binding sites (TFBS) activity
in the putative promoter region, (2) affecting splicing
activity, or (3) affecting the microRNA binding sites activ-
ity. Therefore, we genotyped all of these five SNPs:
rs2623047 G>A, rs13264163 A>G, rs6990375 G>A,
rs3802278 G>A, and rs3087714 C>T.
The genotyping was performed by the polymerase
chain reaction-restriction fragment length polymorphism
method (PCR-RFLP) using genomic DNA. Table 1 shows
the primers and PCR information for each SNP. The
PCR conditions consisted of an initial melting step of 95°
C for 5 min, followed by 35 cycles of denaturation (95 °C
for 30 seconds), annealing (52 - 55 °C for 45 sec accord-
ing to SNPs), and extension (72°C for 1 min), and a final
extension step of 72°C for 10 min. The digested products
were checked on a 3% MetaPhor agarose gel containing
ethidium bromide. The gene structure, SNP location, pre-
dicted functionality of SNPs, and electrophoresis gel pic-
tures are shown in Figure 1A. The genotypes were
double-checked by two people for quality control, and
any uncertain results were repeated to reach a 100% con-
cordance. Genotyping of 10% of samples were randomly
performed twice, and no discrepancy was observed.
Construction of Reporter Plasmids
Reporter constructs were prepared for rs2623047 G>A
by amplifying 1803 bp of the SULF1 promoter region
(from -1784 to +18 relative to the transcription start
site) with either rs2623047 G or A allele by using a pair
of primers 5’-AAGAGCTCTTGGGAATGCCTCATA-
GACAG-3’(forward) and 5’-AAGCTAGCGGTCTGA-
GAACTCCCAGTCAA-3’(reverse). SacI and NheI
restriction enzymes (New England BioLabs, Beverly,
MA) were used to cleave the amplicons, and the pGL4
vector (Promega, Madison, WI) and T4 DNA ligase
(New England BioLabs) were used for ligation.
Transient Transfection and Luciferase Reporter Gene
Assay
The ovarian cancer cell lines OVCA429 and SKOV-3
were cultured in 1x McCoy’s 5A modified medium and
minimum essential medium, and the human cervical
cancer cell line HeLa was cultured in Dulbecco’smodi-
fied Eagle’s medium, supplemented with 10% fetal
bovine serum (Sigma-Aldrich, MO) at 37°C with 5%
Han et al.Journal of Experimental & Clinical Cancer Research 2011, 30:5
http://www.jeccr.com/content/30/1/5
Page 2 of 7
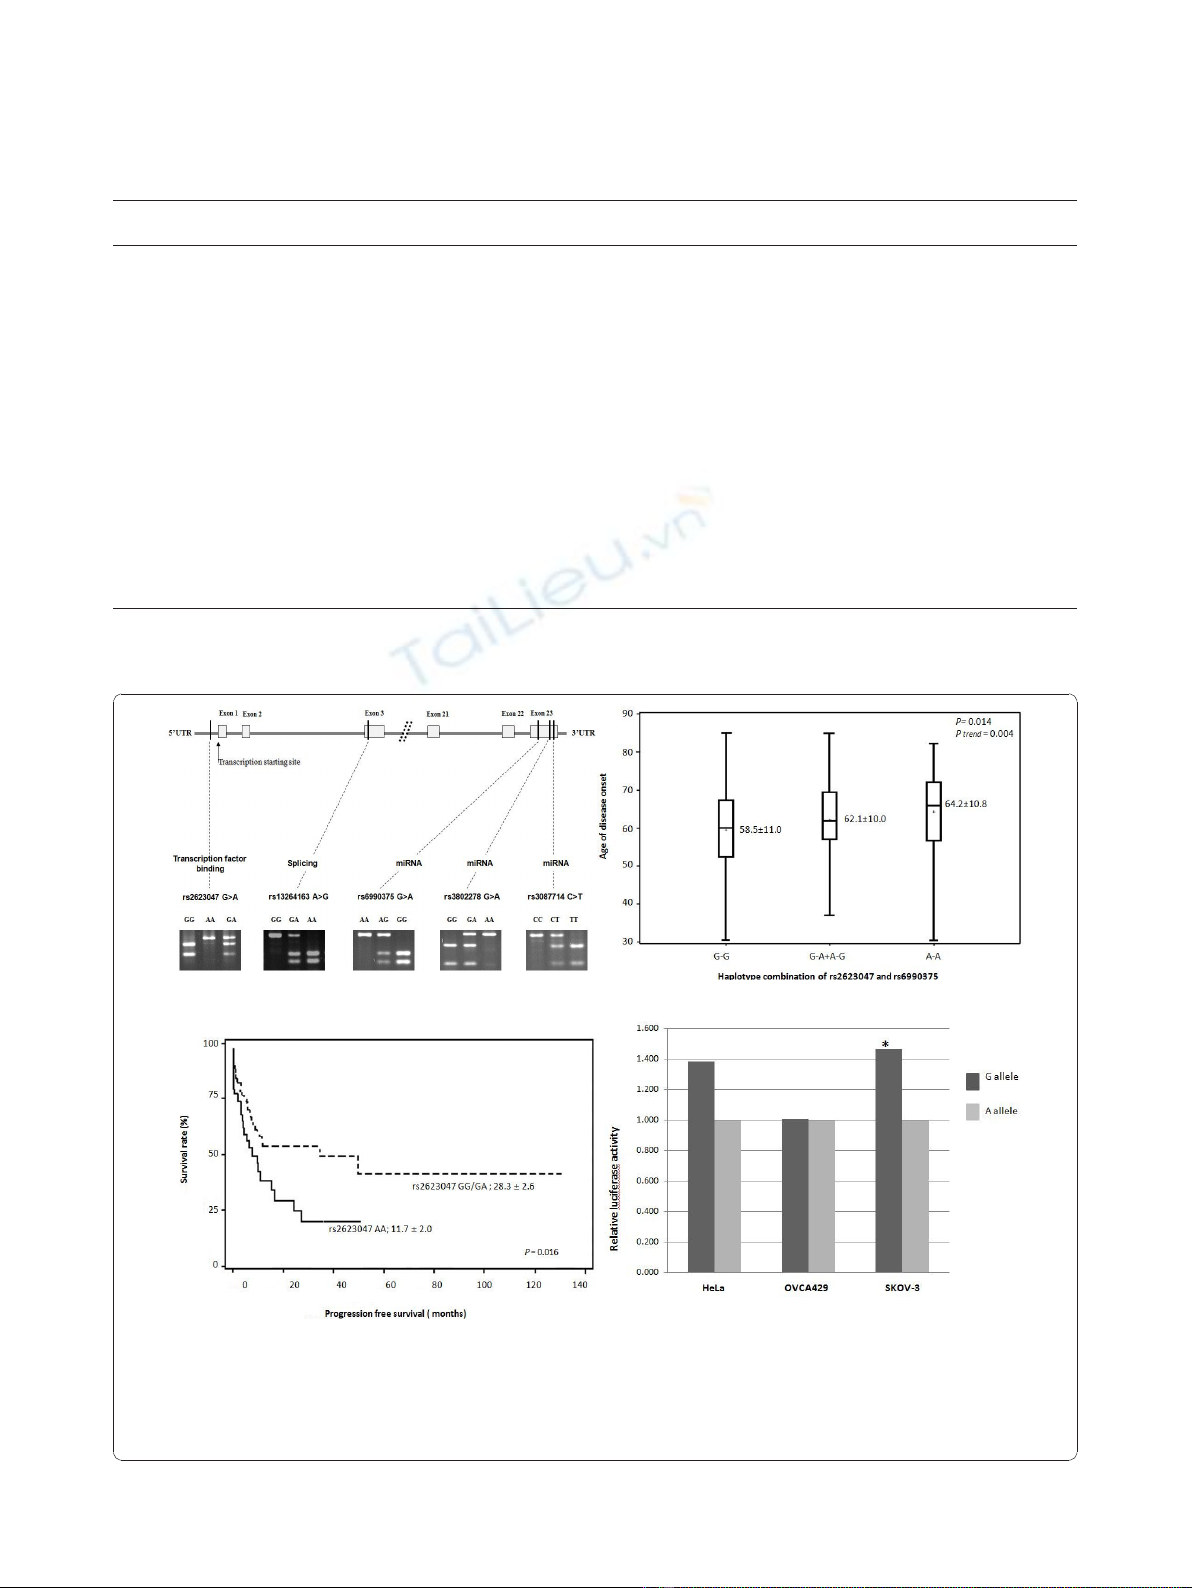
Table 1 Primers and PCR conditions for genotyping the five SNPs
rs number Primers Annealing
Temperature (°C)
PCR products
(bp)
Enzyme Digested PCR
products (bp)
rs2623047 FP 5’-TGT GGC AAA CAG TGA AGA GC-3 52 245 BstNI GG:159/86
G>A RP 5’-CAG CAA GAC GTT TTC CCT TC-3’GA:245/159/86
AA:245
rs13264163 FP 5’-TGG CAA TTT TGC TCT TTT CC-3’55 181 NspI AA:100/81
A>G RP 5’-TGA CAT AGA GTG CCC AGG TG-3 GA:181/100/81
GG:181 G
rs6990375 FP 5’-CCG CAG AAC ACC GAA GTA AT-3’55 227 HhaI GG:128/99
G>A RP 5’-CCA GGG TAG CTT GGA ATG TT-3 GA:227/128/99
AA:227
rs3802278 FP 5’-CTG GAA ACC GAT TTC AGT GG-3’55 227 Cac8I GG:151/76
G>A RP 5’-CCC GCT ATG CTG GAA TTA CT-3 GA:227/151/76
AA:227
rs3087714 FP 5’- TTC CTG AAG CCA GAA TTG TTC-3’55 150 CviQI CC:150
C>T RP 5’- TAT CAT CGG TGG GAT GAC AG-3’CT:150/101/49
TT:101/49
(A) (B)
(
C
)(
D
)
Figure 1 SULF1 SNP information, effects on age of disease onset, survival, and promoter activity. (A) The gene structure, SNP location,
predicted functionality of SNPs, and electrophoresis gel pictures; (B) Haplotype combination of rs2623047 and rs6990375 and age of disease
onset; G-G: rs2623047G-rs6990375G; G-A/A-G: rs2623047G-rs6990375A and rs2623047A-rs6990375G; A-A: rs2623047A-rs6990375A; (C) Progression-
free survival; rs2623047 AA vs. rs2623047 GG/GA; (D) HeLa, OVCA429, and SKOV-3 cell lines were co-transfected with the rs2623047 G, or
rs2623047 A constructor plasmid and Renilla-TK plasmids. The relative luciferase activity was assessed with the Renilla luciferase activity. Each
experiment was performed in triplicate. * P< 0.05.
Han et al.Journal of Experimental & Clinical Cancer Research 2011, 30:5
http://www.jeccr.com/content/30/1/5
Page 3 of 7

CO
2
. The cultured cells were transiently transfected
with 1.0 μg of rs2623047 G or rs2623047 A reporter
constructs, using the FuGENE HD kit (Roche Applied
Science, IN). The p-TK renilla luciferase (pRL-TK) (Pro-
mega) construct was co-transfected as an internal con-
trol to evaluate experimental variation, such as
transfection efficiency and cell viability. The luciferase
activities were quantified by a Dual-Luciferase Reporter
Assay System (Promega), and the relative luciferase
activity was calculated as the ratio of firefly to renilla
luciferase activity, according to the manufacturer’s
instructions. Each experiment was repeated three times.
Statistical Analysis
Statistical analysis was performed using the Chi-square
test or analysis of variance (ANOVA) analysis for cate-
gorical variables and continuous variables, respectively.
The Proc Allele procedure in the SAS/Genetics program
(SAS Institute Inc., Cary, NC) was used to calculate
linkage disequilibrium (LD). The Kaplan-Meier method
and the log-rank test were used to estimate PFS and
OS. The Cox proportional hazards regression model was
used to analyze individual prognostic factors. All statisti-
cal tests were two-sided, a Pvalue of 0.05 was consid-
ered statistically significant, and all analyses were
performed using the Statistical Analysis System/Genetics
software (SAS version 9.13; SAS Institute Inc.)
Results
Demographic and clinicopathologic characteristics of the
study population have been described elsewhere [18].
Since there are significant racial differences in allele dis-
tributions of some SULF1 SNPs and the majority of the
patients with available DNA samples were non-Hispanic
whites (136/168, 80.9%), we included non-Hispanic
whites only in further analysis. As shown in Table 2 of
clinicopathologic characteristics in this study, the mean
age of disease onset and standard deviation (SD) was 61.8
± 10.7 years, and 12.5% were younger than 50 years.
Among the 136 white patients, 91.9% had an advanced
disease with 102 patients (75.6%) diagnosed at stage III
and 22 patients (16.3%) diagnosed at stage IV. Most
patients had high grade (127, 95.5%) and serous cell type
(109, 80.2%), and 85 patients (62.5%) had obtained opti-
mal debulking during primary surgery.
Table 3 shows genotype distribution of the five SNPs.
The LD analysis showed disequilibrium coefficient
D’= 0.965 and Correlation coefficient r
2
= 0.872 for
rs6990375 G>A and rs3802278 G>A; D’=0.981andr
2
=
0.678 for rs6990375 G>A and rs3087714 C>T; D’= 1.000
and r
2
= 0.919 for rs3802278 G>A and rs3087714 C>T,
but other pairs showed lower D’and r
2
values, suggesting
that rs6990375 G>A can capture the majority of
rs3802278 G>A and rs3087714 C>T changes in the 5’
UTR. When we stratified the age of disease onset by
these genotypes, we found that all five SNPs were more
or less associated with age of onset of ovarian cancer. For
example, the rs2623047 G>A showed an association with
age of disease onset (Table 3); the patients with the AA
genotype had a mean age of onset of 65.0 ± 9.9 years;
and those with the AG genotype had 61.2 ± 10.8 years,
while those with the rs2623047 GG showed 56.8 ± 10.7
year age of onset (P= 0.027 for the ANOVA test). The
trend test showed a Pvalue of 0.007 for a decreasing age
with the G allele in a dose-dependent manner (Table 3).
The rs13264163 AG heterozygotes also showed the
youngest age of onset among all genotypes of
rs13264163A>G (P= 0.016) (Table 3). We also found
that the early age of disease onset was associated with
the G allele of rs6990375 G>A [rs6990375 GG: 60.0 ±
10.7 years; rs6990375 GA: 61.8 ± 10.6 years; rs6990375
AA: 69.1 ± 9.0 years (P= 0.013)] (Table 3). As we
noticed in the LD analysis, rs6990375 G>A had a r
2
> 0.8
with rs3802278 G>A and rs3087714 C>T; therefore, we
also observed the significant trends in differences of age
of disease onset among genotypes of rs3802278 G>A and
rs3087714 C>T (P
trend
= 0.021 and 0.041, respectively),
even though the differences were not significant in
ANOVA tests (P= 0.069 and 0.119).
We further evaluated the combined allele effect on age
of disease onset. Because rs2623047 G>A and rs6990375
G>A showed significant differences among genotypes
Table 2 Demographic and clinicopathologic
characteristics in non-Hispanic white ovarian cancer
patients
Characteristics Number of patients %
Age at Diagnosis (years) 136
<50 17 12.5
50 - 70 86 63.2
>70 33 24.3
Surgical stage
a
135
I 5 3.7
II 6 4.4
III 102 75.6
IV 22 16.3
Tumor Grade
a
133
1 6 4.5
3 127 95.5
Histology 136
Serous 109 80.2
Mucinous 2 1.5
Endometrioid 2 1.5
Clear cell 1 0.7
Brenner 3 2.2
Mixed 19 14.0
a
Missing patient information: 1 for surgical stage; 3 for tumor grade.
Han et al.Journal of Experimental & Clinical Cancer Research 2011, 30:5
http://www.jeccr.com/content/30/1/5
Page 4 of 7

and significant trends, and rs6990375 G>A is in LD with
rs3802278 G>A and rs3087714 C>T, we only included
those two SNPs in the haplotype analysis. The signifi-
cant differences in age of disease onset remained
among carriers of the haplotype of rs2623047G and
rs6990375G as compared with other haplotypes (P=
0.014; P
trend
= 0.004) as shown in Figure 1B. In further
analysis, we also found that rs2623047 A>G was asso-
ciated with PFS. Patients with the G allele (i.e., the GG/
GA genotypes) showed a longer PFS than patients
with the AA genotype (28.3 ± 2.6 months vs. 11.7 ± 2.0
months; P= 0.016) (Figure 1C), whereas this association
with PFS was not observed for other SULF1 SNPs.
Since rs2623047 is located in the putative promoter
region of SULF1, we further tested its effect on the pro-
moter activity. We constructed luciferase reporter plas-
mids with either rs2623047 G allele or rs2623047 A
allele and transiently transfected them into three cancer
cell lines, OVCA429, SKOV-3, and HeLa. We found
that the SULF1 promoter containing rs2623047 G
exhibited an increased luciferase activity, compared with
the rs2623047 A in SKOV-3 and HeLa cell lines, but
only SKOV-3 ovarian cancer cell lines showed a statisti-
cally significant difference (P= 0.028), whereas HeLa
cells showed a marginal difference with a Pvalue of
0.058 (Figure 1D). Intriguingly, it is known that OVCA
429 forms tumor slowly and less aggressively in nude
mice [21,22], whereas SKOV-3 is highly tumorigenic
[23], potentially relating to the differences in the promo-
ter activity in the two lines.
Discussion
SULF1 is a recently identified heparin-degrading endo-
sulfatase, which catalyzes the 6-O desulfation of HSPGs,
Table 3 SULF1Genotype distribution and age of disease onset
Genotypes Number of patients (%) Age at diagnosis
(years, mean ±SD)
b
P-value
rs2623047 G>A
a
0.027
GG 16 (11.9) 56.8 ± 10.7
GA 80 (59.3) 61.2 ± 10.8
AA 39 (28.9) 65.0 ± 9.9
G allele frequency 112 (41.5) P
trend c
= 0.007
A allele frequency 158 (58.5)
rs13264163 A>G 0.016
AA 70 (51.4) 63.7 ± 10.5
AG 53 (39.0) 58.6 ± 10.5
GG 13 (9.6) 64.9 ± 10.6
A allele frequency 193 (71.0) P
trend c
= 0.266
G allele frequency 79 (29.0)
rs6990375 G>A 0.013
GG 58 (42.7) 60.0 ± 10.7
GA 63 (46.3) 61.8 ± 10.6
AA 15 (11.0) 69.1 ± 9.0
G allele frequency 179 (65.8) P
trend c
= 0.009
A allele frequency 93 (34.2)
rs3802278 G>A 0.069
GG 59 (43.4) 59.7 ± 11.4
GA 65 (47.8) 62.8 ± 10.0
AA 12 (8.8) 66.7 ± 9.5
G allele frequency 183 (67.3) P
trend c
= 0.021
A allele frequency 89 (32.7)
rs3087714 C>T 0.119
CC 63 (46.3) 60.1 ± 11.3
CT 62 (45.6) 62.7 ± 10.1
TT 11 (8.1) 66.6 ± 10.0
C allele frequency 188 (69.1) P
trend c
= 0.041
T allele frequency 84 (30.9)
a
One sample failed in this genotype.
b
One-way ANOVA (Analysis of variance) for age differences among 3 genotypes for each SNP.
c
Pvalues for the trend test of age at diagnosis among 3 genotypes for each SNP from a general linear model.
Han et al.Journal of Experimental & Clinical Cancer Research 2011, 30:5
http://www.jeccr.com/content/30/1/5
Page 5 of 7


![Vaccine và ứng dụng: Bài tiểu luận [chuẩn SEO]](https://cdn.tailieu.vn/images/document/thumbnail/2016/20160519/3008140018/135x160/652005293.jpg)