


Correlation between body mass index and gut microbiota in adults
Chia sẻ: Nguaconbaynhay6 Nguaconbaynhay6 | Ngày: | Loại File: PDF | Số trang:10
lượt xem 1
download
 Download
Vui lòng tải xuống để xem tài liệu đầy đủ
Download
Vui lòng tải xuống để xem tài liệu đầy đủ
Gut microbiota has been proposed as a new environmental risk factor responsible for obesity. So, the aim of this study was to assess the gut microbiota profile, with special consideration to Lactobacilli, E. coli and S. aureus viable bacterial count (VBC) in (CFU/gm) and their association with body mass index (BMI) and obesity using quantitative stool culture. This study was conducted on 100 individuals; 74 with disturbed BMI who were divided into subgroups, with no other associated comorbidities and 26 healthy average weight volunteers.
Bình luận(0) Đăng nhập để gửi bình luận!
Nội dung Text: Correlation between body mass index and gut microbiota in adults
- Int.J.Curr.Microbiol.App.Sci (2017) 6(2): 778-787 International Journal of Current Microbiology and Applied Sciences ISSN: 2319-7706 Volume 6 Number 2 (2017) pp. 778-787 Journal homepage: http://www.ijcmas.com Original Research Article http://dx.doi.org/10.20546/ijcmas.2017.602.086 Correlation between Body Mass Index and Gut Microbiota in Adults Sally M. Saber1, *Hala B. Othman1, Sherin ElMasry1*, Alaa Magdy1 and Howayda F. Zidan2 1 Clinical Pathology Department, Faculty of Medicine, Ain Shams University, Egypt 2 Department of Rheumatology and Rehabilitation, Faculty of Medicine, Ain Shams University, Egypt #Corresponding author ABSTRACT Gut microbiota has been proposed as a new environmental risk factor responsible for Keywords obesity. So, the aim of this study was to assess the gut microbiota profile, with special Obesity, consideration to Lactobacilli, E. coli and S. aureus viable bacterial count (VBC) in Lactobacillus reuteri, (CFU/gm) and their association with body mass index (BMI) and obesity using Lactobacillus quantitative stool culture. This study was conducted on 100 individuals; 74 with paracasei, disturbed BMI who were divided into subgroups, with no other associated co- Lactobacillus morbidities and 26 healthy average weight volunteers. Fresh stool samples were plantarum, E. coli, collected and cultured directly on MacConkey, xylose lysine deoxycholate, Blood and Probiotics, Prebiotics and synbiotics. Man-Rogoza Sharpe agar and quantitatively with serial dilutions (10-2 – 10-9) in sterile normal saline. S. aureus was not isolated in any group, while, Lactobacilli and E. coli Article Info were isolated from all groups. Lactobacilli have a significant low VBC in obese and the highest VBC in the normal weight group showing a negative correlation with BMI. Accepted: 18 January 2017 While, E. coli had a significantly high VBC in obese and the lowest in the Available Online: underweight group showing a positive correlation with BMI. In conclusion, low 10 February 2017 Lactobacilli VBC and high E. coli VBC are significantly related to increased BMI and thus obesity. Introduction The rapidly growing prevalence of obesity endometrium, and postmenopausal breast. It among children, adolescents and adults and is also related to a significantly increased the associated metabolic disorders has mortality (Whitlock et al., 2009). become a global health problem (Xiao et al., 2014). Obesity is a complex condition influenced by many factors as Genetic, endocrinal and Body mass index (BMI) is a good measure of environmental factors (Xiao et al., 2014). Gut obesity. Increased BMI is an established risk microbiota has been proposed as a new factor for many diseases; including, environmental risk factor responsible for the hypertension, ischemic heart disease, stroke, weight gain and the altered energy diabetes mellitus, respiratory disorders, and metabolism that accompanies the obese state. cancer of the large intestine, kidney, The gut microbiota enables enzymatic 778
- Int.J.Curr.Microbiol.App.Sci (2017) 6(2): 778-787 digestion of nondigestible polysaccharides bacterial count (VBC) in (CFU/gm)and their producing absorbable monosaccharides; and it association with body mass index (BMI) and activates lipoprotein lipase on intestinal obesity using quantitative stool culture. epithelium, which causes rapid absorption of glucose and fatty acids, contributing to the fat Materials and Methods mass expansion and weight gain (Musso et al., 2011). Many studies in both human This study was conducted on 100adults; 74 subjects and experimental animals showed a with disturbed BMI with no other associated significant association between the increase of co morbidities who were selected randomly some bacterial groups and obesity [(Bäckhed from obesity outpatient Clinic of Ain Shams et al., 2004); (Ley et al., 2005); (Ley et al., University Hospitals and 26 healthy average 2006); (Turnbaugh et al., 2009) and (Cani et weight volunteers were included as control al., 2008)]. Some studies found that group matched for age and gender over a Lactobacillus genus was the most study period from September 2013 to predominant type of microbiota in stool of February 2014. Confidentiality of information overweight and obese persons (Armougom et was maintained and consent was taken from al., 2006); (Ignacio et al., 2016), while other each participant. studies linked overweight and obesity to Enterobacteriaceae, specifically E. coli Exclusion criteria for the included subjects (Santacruz et al., 2010 and Karlsson et al., (Million et al., 2013) 2011) and S. aureus (Santacruz et al., 2010). Also, elevated proportion of Firmicutes Adults less than18 years old, history of cancer (Lactobacilli) and reduced population of colon, presence of inflammatory bowel Bacteroidetes (Bacteroides) has been disease, an acute or chronic diarrhea in the associated with obesity (Angelakis et al., previous 4 weeks before taking the stool 2012). Moreover, gut microbiota composition sample, antibiotic, prebiotic and probiotic at the species level even in the same genus is administration of a period less than one month related to body weight and obesity as before faecal sampling, familial obesity, Lactobacillus reuteri is found more frequently patients with associated co-morbidities as in obese subjects whereas, Lactobacillus (Diabetes mellitus, hypertension, paracasei and Lactobacillus plantarum are cardiovascular stroke, chronic liver disease, significantly associated with lean status and renal diseases), patients with (Million et al., 2012). Although these faecal dyslipidaemia, hormonal or endocrinal microflora variability at the species level is disturbance as (Thyroid dysfunction, Cushing detected by molecular tools based on 16s syndrome, Growth hormone insufficiency). rDNA sequence similarities such as fluorescent in-situ hybridization (FISH) and Clinical history was taken and laboratory denaturing gradient gel electrophoresis investigations were done to exclude the (DGGE) (Sharma et al., 2012). However, associated co-morbidities. Anthropometric these methods are costly, tedious, and measurements [weight, height, waist measure even non-viable organisms circumference (WC), hip circumference (HC) (Sieuwerts et al., 2008). and waist to hip ratio (WC/HC)] using measuring tape and scale were assessed. So, the aim of this study was to assess the gut microbiota profile, with special consideration The studied groups were divided according to to Lactobacilli, E. coli and S. aureus viable Million et al., (2013) into subgroups 779
- Int.J.Curr.Microbiol.App.Sci (2017) 6(2): 778-787 according to BMI that was defined as weight/ plates (Oxoid®, UK); to identify the microbial (height) 2 as follows: growth pattern of gram negative bacteria for each patient, on Xylose lysine deoxycholate (1) Obese group: (29) patients who were (XLD) agar media plates (Oxoid®, UK) to subdivided into exclude Shigella and carrier state of Salmonella, on Blood agar plates (Oxoid®, Morbidly obese (50 > BMI > 40) UK) for isolation of gram positive bacteria, Six patients; their age ranged from 30- and on Man-Rogoza Sharpe agar media 40 with mean 36.000 + 3.950. (MRs) (Oxoid®, UK) for isolation of Lactobacillus species. Obese group (40 > BMI > 30) Twenty-three patients; their age Quantitative culture for VBC (CFU/gm ranged from 19-53 with mean 36.522 stool) + 11.016. Approximately one gram of each stool sample (2) Overweight group: (23) patients was transferred to one mL sterile normal saline and mixed thoroughly. Stool samples Twenty-three patients (30 >BMI >25); their were serially diluted (10-2 – 10-9).TenL from age ranged from 19-47 with mean 33.522 + each dilution was plated using the quadrant 8.409. technique on Man-Rogoza Sharpe agar media (MRs) agar (Oxoid®, UK) for isolation and (3) Average weight or lean group (control enumeration of VBC of Lactobacillus species, group): (26) patients incubated anaerobically at 37ºC for 72- hoursand on blood agar for isolation and Twenty-six patients (25 >BMI >19), their age enumeration of VBC of S. aureus, and E. ranged from 19-54 with mean 31.192 + 9.148. coli which incubated aerobically for 48-hours at 37ºC. (4) Underweight group (22) patients All colonies of different morphology grown Twenty-two patients (BMI
- Int.J.Curr.Microbiol.App.Sci (2017) 6(2): 778-787 times in the same group in quantitative data. Lactobacilli (97%).The gut microbiota had Kruskal-Wallis test is a nonparametric the greatest genera diversity in the low BMI equivalent to one-way ANOVA used to groups (normal and underweight); E. coli determine if there are statistically significant (100%), Lactobacilli spp. (97.91%), differences between two or more groups of an Citrobacter spp. (58.33%), Enterobacter spp. independent variable on a continuous or (16.66%), Morganella spp. (12.5%), ordinal dependent variable. All the analyses Acinetobacter spp. (10.41%), and Providencia were performed with commercially available spp. (10.41%). The diversity decreased as the software (SPSS version 17, SPSS, Inc., BMI increased (overweight, obese and Chicago, IL, USA) morbid obese); E. coli (100%), Lactobacilli spp. (97.15%), Citrobacter spp. (57.69%), Results and Discussion Acinetobacter spp. (9.62%), Morganella spp. (5.76%), and Serratia spp. (3.85%). The The demographics and Anthropometric prevalence of Citrobacter spp. was measurements significantly higher in morbidly obese group (P
- Int.J.Curr.Microbiol.App.Sci (2017) 6(2): 778-787 from their categorization of the studied and the lowest concentration was in the Obese groups into case and control groups without (8×10⁸ CFU/gm) (Table 3). In contrast to our any exclusion criteria, associated co- results, Armougom et al., (2006) and Million morbidities or hormonal disturbance that may et al., (2012) found that Lactobacillus spp. affect the diversity of gut microbiota. concentration was significantly higher in Moreover, anaerobes were isolated obese subjects than lean control by successfully in their study in contrast to this quantitative PCR (qPCR). Also, Million et al., study which focused mainly on aerobes and (2013), found that, Lactobacillus facultative anaerobes. Also, they used concentration was higher in obese patients sequencing of PCR products which may compared with lean patients (P 25 Kg m-2 vs metabolic effect (Sepp et al., 2013). While, individuals with BMI< 25 Kg m-2. But Xiao et al, (2014) found a positive correlation Million et al., (2012) found that, between Citrobacter and BMI ≥ 28 Kg m-2. Lactobacillus spp. concentration by culture on Million et al., (2013) who categorize their Lactobacillus specific culture was not study subjects into four groups; group I: obese significantly different between obese and subjects (BMI> 30 Kg m-2), group II: control subjects median (4.15 vs. 5.2log10 overweight subjects (BMI>25 and 19 and 25 Kg m-2 compared to individuals significant higher level in obese subjects by with BMI < 25 Kg m-2 (P=0.001). Also, they qPCR not by culture. Also, Million et al., found that, the prevalence of E. coli was (2013) showed that Lactobacillus reuteri lower in obese compared with lean group (p= concentration was positively correlated with 0.006) and the presence of Bacteroidetes was BMI. associated with the absence of obesity (OR = 0.51; P= 0.02) however anaerobes were not Viable bacterial count of E. coli in the assessed in this study. studied groups Viable bacterial count of Lactobacilli in the Also, in our study, the E. coli VBC was studied groups significantly different among different groups (P
- Int.J.Curr.Microbiol.App.Sci (2017) 6(2): 778-787 numbers by qPCR were lower in normal- BMIr=0.235 (Fig. 1). On the other hand there weight BMI< 25 Kg m-2 than in overweight was a significant positive correlation between BMI >25 Kg m-2 pregnant women. In VBC of E. coli and BMI r=0.002 (Fig. 2), contrast, Million et al., (2013) found that, the weight r=0.008, waist circumference r=0.002, concentration of E. coli was lower in obese hip circumference r=0.016. On the contrary to compared with lean group (P=0.02), anorexic our study Million and his co-workers (2013) (P=0.001) and overweight individuals (P= found that, higher concentration of E. coli was 0.012) and in individuals with BMI > 25 vs. < associated with lower BMI, while, higher 25 Kg m-2 showing that, a higher concentration of Lactobacillus reuteri was concentration of E. coli was associated with a associated with higher BMI. lower BMI. To our knowledge, these results provide new Correlation between anthropometric insights into the correlation between gut measures and VBC of both Lactobacilli and microbiota and the rising trend in obesity in E. coli our population as this issue will be of great importance in the management of this There was a significant positive correlation growing worldwide problem and with special between Lactobacilli VBC and height considering of the flourishing market of r=0.221, and a significant negative correlation probiotics (Million et al., 2012). between VBC of Lactobacilli and Table.1 The studied participants’ characteristics and demographics Participant Over weight characteristics Under weight Normal weight Obese Morbid obesity 30 > BMI BMI BMI >19 40 > BMI >30 50 > BMI > 40 (n=22) (n=26) >25 (n=23) (n=6) Mean ± 2 SD Mean ± 2 SD (n=23) Mean ± 2 SD Mean ± 2 SD Mean ± 2 SD Age (year) 19-45 19 – 54 19 - 47 19 – 53 30 – 40 (29.000±6.726) (31.192±9.148) (33.522±8.409) (36.522±11.016) (36.000±3.950) Weight (kg) 38 – 62 49 -77 57-102 67 – 120 99 - 123 (50.409±6.464) (59.365±8.219) (79.478±13.36) (88.348±12.662) (109.5± 8.888) Height (meters) 1.49 – 1.9 1.49 – 1.88 1.47 – 1.88 1.47 – 1.8 1.53 – 1.68 (1.682±0.122) (1.628±0.104) (1.680±0.128) (1.593±0.087) (1.578±0.056) Waist 68 – 74 70 – 90 77 – 102 80 – 98 87 – 97 circumference (71.000±1.380) (79.885±5.743) (83.826±5.734) (89.087±3.848) (92.833±3.430) (cm) Hip 83 – 99 80 – 104 88 – 110 92 – 117 110–123 circumference (88.182±4.216) (94.192±5.987) (99.435±5.106) (106.870±7.015) (117.333±5.785) (cm) Waist 0.714 – 0,881 0.777 – 0.917 0.709 – 1.000 0.714 – 0.922 0.719 – 0.864 circumference/ (0.807±0.040) (0.848±0.037) (0.845±0.063) (0.837±0.060) (0.793±0.053) Hip circumference (cm) 783
- Int.J.Curr.Microbiol.App.Sci (2017) 6(2): 778-787 Table.2 Distribution of fecal gut flora among the studied groups (n=100) Groups Under weight Normal weight Over weight Obese Morbid obesity Chi-Square (n=22) (n=26) (n=23) (n=23) (n=6) N % N % N % N % N % X2 P-value Citrobacter 8 36.36 20 76.92 15 65.22 10 43.48 5 83.33 9.968 0.041* Enterobacter 3 13.64 5 19.23 0 0.00 0 0.00 0 0.00 9.927 0.042* Morgenella 2 9.09 4 15.38 3 13.04 0 0.00 0 0.00 4.622 0.328 Serratia 0 0.00 0 0.00 2 8.70 0 0.00 0 0.00 6.832 0.145 Acinetobacter 4 18.18 1 3.85 1 4.35 4 17.39 0 0.00 5.610 0.230 Provedencia 3 13.64 2 7.69 0 0.00 0 0.00 0 0.00 6.588 0.159 E.coli 22 100.00 26 100.00 23 100.00 23 100.00 6 100.00 x x Lactobacilli 21 95.45 26 100.00 23 100.00 22 95.65 5 83.33 5.691 0.223 Table.3 Comparison between studied groups as regards fecal Lactobacilli VBC in (CFU/gm) Kruskal-Wallis Lactobacilli VBC (CFU/gm) Test Groups Interquartile Mean Range Median X2 P-value Range Rank Underweight 1.5×10⁸-2. ×1010 2.8×10⁹ 1.87×10¹⁰ 56.21 Normal 6×10⁶-7×10¹⁰ 6.3×10⁹ 3.51×10¹⁰ 61.35 Overweight 3.5×10⁶-6.6×10¹⁰ 2.4×10⁹ 3.90×10⁹ 45.35 14.461 0.006 Obese 2×10⁷-3.7×10¹⁰ 8×10⁸ 3.05×10⁹ 36.66 Morbid 2×10⁷-4×10⁹ 2×10⁸ 2.4×10⁹ 25.60 obesity Table.4 Comparison between studied groups as regards faecal E. coli VBC in (CFU/gm) Kruskal-Wallis E. coli VBC (CFU/gm) Test Groups Interquartile Mean Range Median X2 P-value Range Rank Underweight 2×10⁷-1×10¹⁰ 4×10⁷ 3.8×10⁸ 18.09 Normal 5×10⁷-1×10¹¹ 3.95×10⁹ 2.05×10¹⁰ 51.02 Overweight 6.3×10⁶-8.4×10¹⁰ 7.7×10⁹ 9.50×10⁹ 56.46 43.067
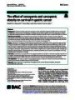
- Int.J.Curr.Microbiol.App.Sci (2017) 6(2): 778-787 Fig.1 Correlation between faecal Lactobacilli (VBC) and (BMI) r=-0.235 P-value=0.020* 60 50 40 30 20 BM I 10 -20000000000 20000000000 60000000000 0 40000000000 80000000000 Lacto.Bacilli Fig.2 Correlation between faecal E. coli (VBC) and BMI r=0.310 P-value=0.002* 60 50 40 30 20 BM I 10 -20000000000 20000000000 60000000000 100000000000 140000000000 0 40000000000 80000002000 120000000000 E.coli The limitation of this study was the extremes excluded in this study. Also, the anaerobic of BMI (morbid obesity and underweight profile needs to be assed and correlated to individuals) which necessitates the increase of identify its role in disturbed body mass index. samples size in further studies, to avoid outliers. In addition, S. aureus couldn’t be In conclusion, Low Lactobacilli VBC and detected in this study despite its positive high E. coli VBC are significantly related to correlation with obesity as Santacruz et al., increased BMI and thus obesity, while, high (2010) found that the increase of S. aureus Lactobacilli VBC is significantly related to numbers were related to cases with increased average weight individuals. plasma cholesterol levels which were 785
- Int.J.Curr.Microbiol.App.Sci (2017) 6(2): 778-787 This research recommends the identification Analysis of the Association between of gut microbiota to the species level on a Gut Flora and Obesity through High- large scale of individuals to evaluate their Throughput Sequencing and distribution in obese persons and evaluate the Bioinformatics Approaches; BioMed significance of the use of certain strains of Res. Int., 10 Pp. Lactobacilli as a probiotic as an adjuvant Ignacio, A., Fernandes, M.R., Rodrigues, therapy for obesity. V.A., Groppo, F.C., Cardoso, A.L., Avila-Campos, M.J., and Nakano, V. Acknowledgement 2016. Correlation between body mass index and faecal microbiota from We thank all the volunteers because without children. Clin. Microbiol. Infect., 22: their contribution, this study would not have 258.e1–258.e8. been completed. Karlsson, C.L., Molin, G., Fåk, F., Johansson, Hagslätt, M.L., Jakesevic, M., References Håkansson, Å., Jeppsson B, Weström B, and Ahrné, S. 2011. Effects on weight Armougom, F., Henry, M., Vialettes, B., gain and gut microbiota in rats given Raccah, D., and Raoult, D. 2006. bacterial supplements and a high- Monitoring bacterial community of energy-dense diet from fetal life human gut microbiota reveals an through to 6 months of age. Br. J. Nutr., increase in Lactobacillus in obese 106(6): 887-895. patients and Methanogens in anorexic Ley, R.E., Bäckhed, F., Turnbaugh, P., patients. PLoS One, 4(9): e7125. Lozupone, C.A., Knight, R.D., and Angelakis, E., Armougom, F., Million, M., Gordon, J.I. 2005. Obesity alters gut and Raoult, D. 2012. The relationship microbial ecology. Proc. Natl. Acad. between gut microbiota and weight gain Sci. U S A, 102, 11070–11075. in humans. Future Microbiol., 7: 91- Ley, R.E., Turnbaugh, P.J., Klein, S., and 109. Gordon, J.I. 2006. Microbialecology: Bäckhed, F., Ding, H., Wang, T., Hooper, human gut microbes associated with L.V., Koh, G.Y., Nagy, A., obesity. Nature, 444, 1022–1023. Semenkovich, C., and Gordon, J. 2004. Million, M., Angelakis, E., Maraninchi, M., The gut microbiota as an environmental Henry, M., Giorgi, R., Valero, R., factor that regulates fat storage. Proc. Vialettes, B. and Raoult, D. 2013. Natl. Acad. Sci., 101: 15718–15723. Correlation between body mass index Cani, P.D., Bibiloni, R., Knauf, C., Waget, and gut concentrations of Lactobacillus A., Neyrinck, A.M., Delzenne, N.M., reuteri Bifidobacterium animals, and Burcelin, R. 2008. Changes in gut Methanobrevibactersimithii and microbiota control metabolic Escherichia coli. Int. J. Obesity, 37(11): endotoxemia-induced inflammation in 1460-1466. high-fat diet-induced obesity and Million, M., Maraninchi, M., Henry, M., diabetes in mice. Diabetes, 57: 1470– Armougom, F., Richet, H., Carrieri, P., 1481. Valero, R., Raccah, D., Vialettes, B., Chiu, C.M., Huang, W.C., Weng, S.L., Tseng, and Raoult, D. 2012. Obesity-associated H.C., Liang, C., Wang, W.C., Yang, T., gut microbiota is enriched in Yang, T.L., Weng, C.T., Chang, T.H., Lactobacillus reuteri and depleted in and Huang, H.D. 2014. Systematic Bifidobacterium animalis and 786
- Int.J.Curr.Microbiol.App.Sci (2017) 6(2): 778-787 Methanobrevi bactersmithii. Int. J. and fast method for determining colony Obesity, 36: 817-825. forming units. Lett. Appl. Microbiol., Musso, G., Gambino, R., and Cassader, M. 47(4): 275-278. 2011. Interactions between gut Turnbaugh, P.J., Hamady, M., Yatsunenko, microbiotaand host metabolism T., Cantarel, B.L., Duncan, A., Ley, predisposing to obesity and diabetes. R.E., Sogin, M.L., Jones, W.J., Roe, Annu. Rev. Med., 63: 361–380. B.A., Affourtit, J.P., Egholm, M., Santacruz, A., Collado, M.C., Gracia-Valdes, Henrissat, B., Heath, A.C., Knight, R., L., Segura, M.T., Martín-Lagos, J.A., and Gordon, J.I. 2009. A core gut Anjos, T., Martí-Romero, M., Lopez, microbiome in obese and lean twins. R.M., Florido, J., Campoyand, C., Sanz, Nature, 457: 480–484. Y. 2010. Gut microbiota composition is Whitlock, G., Lewington, S., Sherliker, P., associated with body weight, weight Clarke, R., Emberson, J., Halsey, J., gain and biochemical parameters in Qizilbash, N., Collins, R., and Peto, R. pregnant women. British J. Nutri., 104: 2009. Body mass index and cause – 83-92. specific mortality in 900000 adults: Sepp, E., Lo˜ivukene, K., Julge, K., Voor, T., collaborative analyses of 57 prospective and Mikelsaar, M. 2013. The studies. Lancet, 373: 1083-1096. association of gut microbiota with body Xiao, S., Fei, N., Pang, X., Shen, J., Wang, weight and body mass index L., Zhang, B., Zhang, M., Zhang, inpreschool children of Estonia. X., Zhang, C., Li, M., Sun, L., Xue, Microbial. Ecol. Health & Dis., 24: Z., Wang, J., Feng, J., Yan, F., Zhao, 19231. N., Liu, J., Long, W., and Zhao, L. Sharma, N., Chaudhry, R., and Panigrah, P. 2014. A gut microbiota-targeted dietary 2012. Quantitative and Qualitative intervention for amelioration of chronic Study of Intestinal Flora in Neonates, J. inflammation underlying metabolic Glob. Infect. Dis., 4(4): 188–192. syndrome. FEMS Microbiol Ecol., Sieuwerts, S., de Bok, F.A., Mols, E., de vos, 87(2): 357-367. W.M., and Vlieg, J.E. 2008. A simple How to cite this article: Sally M. Saber, Hala B. Othman, Sherin ElMasry, Alaa Magdyand, Howayda F. Zidan. 2017. Correlation between Body Mass Index and Gut Microbiota in Adults. Int.J.Curr.Microbiol.App.Sci. 6(2): 778-787. doi: http://dx.doi.org/10.20546/ijcmas.2017.602.086 787
CÓ THỂ BẠN MUỐN DOWNLOAD
-
The effect of sarcopenia and sarcopenic obesity on survival in gastric cancer
 12 p |
  4
|
4
|  3
3
-

Correlations between inflammatory cytokines, muscle damage markers and acute postoperative pain following primary total knee arthroplasty
9 p | 11
| 2
-

Longitudinal associations between triglycerides and metabolic syndrome components in a beijing adult population, 2007-2012
6 p | 16
| 1
-

The accuracy of parent-reported height and weight for 6–12 year old U.S. children
8 p | 12
| 1


Chịu trách nhiệm nội dung:
Nguyễn Công Hà - Giám đốc Công ty TNHH TÀI LIỆU TRỰC TUYẾN VI NA
LIÊN HỆ
Địa chỉ: P402, 54A Nơ Trang Long, Phường 14, Q.Bình Thạnh, TP.HCM
Hotline: 093 303 0098
Email: support@tailieu.vn
Giấy phép Mạng Xã Hội số: 670/GP-BTTTT cấp ngày 30/11/2015 Copyright © 2022-2032 TaiLieu.VN. All rights reserved.

