


Fourier Transforms in Radar And Signal Processing_ part 9
lượt xem 4
download
 Download
Vui lòng tải xuống để xem tài liệu đầy đủ
Download
Vui lòng tải xuống để xem tài liệu đầy đủ
Một mảng thường xuyên sẽ có một mô hình lặp đi lặp lại tại một khoảng thời gian là 1,5 trong u, và điều này được thể hiện bởi các phản ứng rải rác. Mảng bất thường "lặp đi lặp lại" được nhìn thấy để làm suy giảm nhanh chóng, nhưng mô hình mà vấn đề là nằm trong khoảng [-1, 1] u
Bình luận(0) Đăng nhập để gửi bình luận!
Nội dung Text: Fourier Transforms in Radar And Signal Processing_ part 9
- Array Beamforming 163 ∞ g( ) = a (x ) exp (2 ix sin / ) dx (7.1) −∞ The integral is over the whole domain of x , though with a finite aperture a (x ) will be zero outside this finite region. If we define the aperture positions in units of the wavelength of operation 0 , then we replace x / 0 with x , and also if we define u = sin , as in Section 6.7, then (7.1) becomes ∞ g (u ) = a (x ) exp (2 ixu ) dx (7.2) −∞ and we see that g is formally the inverse Fourier transform of the aperture distribution a , and correspondingly the distribution a is the Fourier transform of the pattern g . However, we must treat this with some caution, because although (7.2) defines values for g (u ) when | u | > 1, these u values do not correspond to real directions. If we wanted to determine the aperture distribu- tion for a given pattern, and the pattern is defined only for the real angles − /2 ≤ ≤ /2, then we only have the information for the integration over this finite interval for u (−1 ≤ u ≤ 1). However, if g can be defined as the required function in this range of u but the function extends outside this range, then we can integrate over the whole u domain, knowing that the resultant aperture distribution a will give the required pattern over the basic interval. An example is the case of a uniform aperture distribution a (x ) = rect (x /X ), where the aperture is given by −X /2 ≤ x ≤ X /2 and the distribution is uniform over this interval. This has the transform g (u) = X sinc Xu , a sinc function response with first zeros at ±1/X . This response is curtailed, for the pattern over real angles, at ± /2 rad (i.e., for u = ±1). However, if we were given that the required pattern over the real angles (−1 ≤ u ≤ 1) is sinc Xu , by integrating sinc Xu over the whole range of u (−∞ < u < ∞), we obtain the rect function for the aperture distribution, which gives the wanted pattern in the real angle region. In the case of an array of identical elements, with their patterns aligned in parallel, we can partition, or factorize, the array response into an array factor, which would be given by using omnidirectional elements, and the element factor, which multiplies the array factor at each angle. The array factor is obtained by summing the contributions from each element with the appropriate phase factor, as in (7.1). For an array of elements we have
- 164 Fourier Transforms in Radar and Signal Processing a sampled aperture; we can still use the Fourier transform, but the aperture distribution is now described by a set of delta functions. If the array is taken to be a regular linear array, we note that a regular set of delta functions corresponds to the transform of a periodic function, so we expect the array factor to be periodic in this case. If we do not want the pattern to be periodic in the real angle region, we could make the period such that it has just one cycle in this interval, requiring it to repeat at a period of 2 in u . This will correspond to the element separations being 1⁄ 2 (i.e., half a wavelength), a well- known result for a pattern free from grating lobes, for all steered directions. (It could also have a greater repetition period than 2, but this would require an element separation closer than a half wavelength; however, this is undesirable, increasing mutual coupling and causing driving impedance problems on transmission.) If the main lobe is narrow and is fixed at broadside to the array (at = 0), then a repetition period in u of just over 1 could be allowed, corresponding to an element separation of just under one wavelength. (With a period of unity in u , repetitions of the main beam, that is, grating lobes, will occur at u = ±1, which lie along the line of the array, and also at higher integral values for u , of course, which are not in real angle space.) Finally, we note that, as sin ( − ) = sin = u , if we consider the array factor pattern from − to rad, or −180 degrees to +180 degrees, we see that the pattern from 90 degrees to 180 degrees is the reflection, about 90 degrees, of the pattern from 90 degrees to 0 degrees and similarly on the other side—in other words, the pattern has reflection symmetry about the line of the array. Thus, if a main lobe is produced at angle 0 degrees, then there will be an identical lobe at 180 − 0 degrees, and, in particular, if there is a broadside main beam (at 0 degrees), there will be a lobe of equal size at 180 degrees. Later in this chapter we take the case of reflector-backed elements that have a 2 sin [ cos ( /2)] pattern for − /2 ≤ ≤ /2 and a response of zero for /2 ≤ | | ≤ , and this removes the unwanted response in the back direction. 7.3 Uniform Linear Arrays 7.3.1 Directional Beams Initially we consider a uniform weighting over the aperture of width X . If the element separation is d wavelengths, then the aperture distribution function is given by
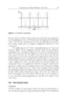
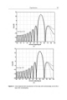
- Array Beamforming 165 a (x ) = combd [rect (x /X )] (7.3) and the beam pattern is (from P3b, R5, and R8b) g (u ) = (X /d ) rep1/d [sinc (Xu )] (7.4) If we want the beam to be steered in some direction u 1 , then we require the pattern shape to be of the form sinc [X (u − u 1 )] instead of sinc (Xu ); this will place the peak of the sinc function at u 1 rather than at zero. Transforming back to the aperture domain (using R6a), we see that this requires the distribution to be a (x ) = combd [rect (x /X ) exp (−2 iu 1 x )] (7.5) We see we need to put an appropriate phase slope across the aperture to steer the beam (i.e., offset it in the angle domain). If, on the other hand, we offset the array in the aperture domain, so that the distribution is given by a (x ) = combd {rect[(x − x 1 )/X ]}, then (by R6b) the pattern is g (u ) = (X /d ) rep1/d [sinc (Xu ) exp (2 iux 1 )] (7.6) and there is a phase slope with angle across the pattern. (This will have little significance in practice, as there is normally no reason to combine or compare signals received at different points in the far field except for reasons of pattern synthesis.) The distinction between the patterns in the u domain and in the real- angle domain is illustrated in Figure 7.2. An array of 16 elements was taken with an element spacing of 2/3 wavelengths, which gives a repetition period for the pattern of 1.5 in u . This is shown (in decibel form) in Figure 7.2(a), and this pattern is described by (7.4), repeating as expected, even though values of u outside the interval [−1, 1] do not correspond to real angles. The vertical lines show the segment of the u pattern that corresponds to real angles. In Figure 7.2(c), the beam has been steered to 60 degrees, and we see that the pattern has moved along so that a second beam, a grating lobe, lies within this interval. Figure 7.2(b, d) shows the corresponding real beams plotted over the full 360-degree interval. These figures show two significant differences—the stretching of the pattern towards the ±90 degrees directions with the lobes becoming wider, and the reflection of the pattern about these directions. If the patterns in u -space and angle space are g u and g , then the gain in direction is given by g ( ) = g u (sin ).
- 166 Fourier Transforms in Radar and Signal Processing Figure 7.2 Beam patterns for a uniform linear array: (a) broadside beam, u -space; (b) broadside beam, angle space; (c) beam at 60 degrees, u -space; (d) beam at 60 degrees, angle space.
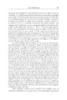
- Array Beamforming 167 In plotting this curve, (7.4) was not used, as that would require summing a large number of sinc functions—in principle an infinite number. We can describe the aperture distribution given in (7.3) alternatively by (n − 1)/2 ∑ a (x ) = (x − kd ) (7.7) k = −(n − 1/2) where n is the number of elements in the aperture A [and so (n − 1) d ≤ A < nd ]. This has the (inverse) transform, from R6b, (n − 1)/2 ∑ g (u ) = exp (2 ikdu ) (7.8) k = −(n − 1/2) and this finite sum is much easier to evaluate. However, the form given in (7.4) is still useful, making much more explicit the periodic form of the pattern in the u domain. 7.3.2 Low Sidelobe Patterns In Sections 3.4 to 3.7, the spectrum of a pulse was shown to improve, in the sense of producing lower sidelobes and concentrating the spectral energy in the main lobe, by reducing the discontinuities (in amplitude and slope) at the edges of the pulse. The same principle is applicable for improving antenna patterns by shaping (or weighting, tapering, or shading ) the aperture distribution in the same way—in fact, if the aperture distributions are given by the pulse shapes of Chapter 3, the beam patterns (in u -space) will be the same as the pulse spectra, as the same Fourier relationship holds. (Strictly speaking, for the pulse spectra the forward Fourier transform is required, while for the beam patterns it is the inverse transform. However, for the frequently encountered case of symmetric distribution functions, there is no distinction.) This is actually the case for continuous apertures, but in the case of a regular linear array, corresponding to a sampled aperture, the pattern is repetitive and is given (over the fundamental interval −1 ≤ u ≤ 1) by the sum of repeated versions of the continuous aperture pattern [as in (7.4) and (7.6) for the rectangular distribution]. For a reasonably narrow beam, particularly one with low sidelobes, the effects of the overlaps will be very small and often negligible. Figure 7.3 shows array patterns for a regular linear array, again of 16 elements, for both the unweighted case (rectangular aperture weighting, dotted line) and raised cosine weighting (solid line).
- 168 Fourier Transforms in Radar and Signal Processing Figure 7.3 Beam patterns for uniform linear array with raised cosine shading: (a) u -space; (b) angle space.
- Array Beamforming 169 In this case, the aperture distribution is given by [1 + cos (2 x /X )] with transform (as in Section 3.4, with X = 1/U replacing 2T = 1/f 0 , and omitting the scaling factor) sinc (u /U ) + 1⁄ 2 sinc [(u − U )/U ] + ⁄ 2 sinc [(u + U )/U ]. The figure shows both the response in u -space and 1 with angle, as in Figure 7.2, but in this case the element spacing is 0.5 wavelength [so the repetition interval in u is 2, as seen in Figure 7.3(a)] and the beam direction is −30 degrees. The weighting has been very effective in reducing the side-lobe levels, though at the cost of broadening the main lobe. Clearly we could apply different weighting functions, obtaining the corresponding beam patterns, given by their Fourier transforms, but this would be simply going over the ground of Chapter 3, where pulses of various shapes and their spectra were studied. Instead, we look at two other possibilities for improving the pattern, not necessarily for practical applica- tion, but as illustrations of approaches to problems of this kind that could be of interest. First, we note that the main lobe in Figure 7.3 consists of the sum of the main sinc function with two half amplitude sinc functions, offset on each side by one natural beam width (the reciprocal aperture; this is actually the beam width at 4 dB below the peak). This suggests continuing to use sinc functions to obtain further improvement. We could reduce the largest side lobes, near ±2.5 beamwidth intervals by placing sinc functions of opposite sign at these positions. This will have to be done quite accurately, because these side lobes are already at about −31 dB below the peak, or at a relative amplitude of 0.028, so an amplitude error of 1%, for example, would not give much improvement. To find the position of these peaks, we can use Newton’s method for obtaining the zeros of a function. In this case, the function is the slope of the pattern, as we want the position of a lobe rather than a null. In this discussion, we neglect the overlapping of the repeated functions on the basis that, for an aperture of moderate size (such as that of this 16-element array, which is effectively eight wavelengths) the effect of overlap is small, especially in the low-side-lobe case—in fact, by dropping the rep function, we are studying the pattern of the continuous aperture. In addition, we plot the pattern in units of the beam width U , as this simply acts as a scaling factor (in u -space). Differentiating the expression above for the beam shape g (u ) to obtain its slope g ′(u ), we have 1 1 g ′(u ) = ( /U ) snc1 (u /U ) + snc1 [(u − U )/U ] + snc1 [(u + U )/U ] 2 2 (7.9)
- 170 Fourier Transforms in Radar and Signal Processing where snc 1 is the derivative of the sinc function, as defined in Section 6.3 above [see (6.17)]. Using Newton’s approximation method to find the peak of a lobe (a point of zero slope), we have u r + 1 = u r − g ′(u r )/g ″(u r ) (7.10) and if we put v = u /U , to give the pattern in terms of natural beam widths, then this becomes v r + 1 = v r − (1/U ) g ′(Uv r )/g ″(Uv r ) (7.11) Here u r and v r are the approximations after r iterations. Putting in g ′ from (7.9) and g ″ from another differentiation of (7.9), we obtain 2 snc1 (v r ) + snc1 (v r − 1) + snc1 (v r + 1) vr + 1 = vr − (7.12) (2 snc2 (v r ) + snc2 (v r − 1) + snc2 (v r + 1)) Starting with v 0 = 2.5, this converges rapidly (v 4 is equal to v 3 to four decimal places) to give a value of −0.0267 at v = 2.3619. Adding sinc functions to cancel the lobes at ±2.5, the pattern in v is now 1 g (v ) = sinc (v ) + [sinc (v − 1) + sinc (v + 1)] (7.13) 2 + 0.0267 [sinc (v − 2.362) + sinc (v + 2.362)] This pattern is shown in Figure 7.4, with the raised cosine shaded pattern for comparison (dotted curve). We see that the original first side lobes have been removed and the new largest side lobes are at almost −40 dB, an improvement of nearly 10 dB. To find the weighting function that gives this pattern, we require the Fourier transform of (7.13). This can be seen almost by inspection by following in reverse direction the route that gave the raised cosine transform. More formally, we have 1 g (v ) = sinc (v ) ⊗ (v ) + [ (v − 1) + (v + 1)] (7.14) 2 + 0.0267 [ (v − 2.362) + (v + 2.362)]
- Array Beamforming 171 Figure 7.4 Beam pattern for ULA with additional shading. giving, on Fourier transforming, 1 a ( y ) = rect ( y ) 1 + [exp (2 iy ) + exp (−2 iy )] 2 + 0.0267 [exp (2 i 2.362y ) + exp (−2 i 2.362y )] = rect ( y ) [1 + cos (2 y ) + 0.0534 cos (4.724 y )] (7.15) As we started with the normalized variable v = u /U , this distribution is in terms of the normalized aperture y = x /X . For the second example, we produce a pattern with the closest side lobes to the main beam (and the largest), all at almost the same level, similar to the pattern given by Taylor weighting. In this case, we take the pattern to be given by a sum of sinc functions at 0, ±1, ±2, . . . , ±n natural beam widths (reciprocal aperture units) from the center. In this case, we do not
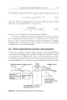
- 172 Fourier Transforms in Radar and Signal Processing take the amplitudes of the sinc functions at ±1 to be 0.5, as above. Thus we have, again using a normalized u -space variable, g (v ) = sinc (v ) + a 1 [sinc (v − 1) + sinc (v + 1)] + a 2 [sinc (v − 2) + sinc (v + 2)] (7.16) + a n [sinc (v − n ) + sinc (v + n )] The n coefficients are determined by setting the gain to particular values at n points in the form g (v r ) = g r . The values we choose are the constant level A , or −A , at the side-lobe peaks, where 20 log 10 ( A ) is the required peak level in decibels. We do not know exactly where these peaks are, but we should be near the peak positions if we choose the points to be midway between the nulls in the sinc patterns; thus we have g (r + 1.5) = (−1)r + 1A (r = 1 to n ) (7.17) [The factor (−1)r + 1 is required, as the amplitudes of the side-lobe peak magnitudes alternate in sign.] The set of n equations given by putting the conditions of (7.17) into (7.16) leads to the vector equation Ba = b , with solution a = B −1 b (7.18) where a contains the required coefficients, and the components of b are given by b j = (−1) j + 1A − sinc ( j + 1.5) (7.19) and the components of B by B jk = sinc ( j − k + 1.5) + sinc ( j + k + 1.5) (7.20) We note that the first points, at ±2.5, are on the edge of the main lobe rather than the peak of a separate side lobe, and the value is positive, with subsequent points on (or near) side-lobe peaks and alternating in sign. Two patterns given by (7.16), with coefficients from (7.18), are shown in Figure 7.5, again with the raised cosine pattern for comparison. In Figure 7.5(a), we took n = 3 and the required level to be −50 dB. The two separate
- Array Beamforming 173 Figure 7.5 Constant-level side-lobe patterns: (a) first two lobes nominally at −50 dB; and (b) first four lobes nominally at −55 dB.
- 174 Fourier Transforms in Radar and Signal Processing lobes are seen to be very close to this level—the pattern levels at ±2.5, ±3.5, and ±4.5 are precisely −50 dB by construction, but the peaks of the lobes will not be at exactly these points, so the actual peaks will rise slightly above the required value. However, the range of levels for which this works well is limited, and Figure 7.5(b) shows it starting to fail. In this case, n = 5 and the nominal level is −55 dB. This is seen to be attained very closely for the lobes at ±4.5, ±5.5, and ±6.5, but the pattern has bulged between ±2.5 and ±3.5, giving a lobe appreciably above the specified level. Nevertheless, these are good side-lobe levels and have been obtained quite easily. The pattern is well behaved when designed for −50-dB sidelobes, but the first sidelobe, near ±2.5, starts to rise when the specified level is about −48 dB or higher. In general, for these patterns the coefficient a 1 is near 0.5 and the other coefficients fall rapidly in magnitude. To find the corresponding weighting function, we transform the pattern to obtain a ( y ) = rect ( y ) [1 + 2a 1 cos (2 y ) + 2a 2 cos (4 y ) + . . . + 2a n cos (2n y )] (7.21) 7.3.3 Sector Beams We now consider a quite different problem—that of providing a flat, or constant gain, beam for reception or transmission over a sector, generally wide compared with the natural beam width. In this case, as we want the sector gain to be constant over an interval (for simplicity, we take the amplitude to be unity), it will be of the form rect (u /u 0 ), where the width of the sector is u 0 , centered on broadside initially. As we want a regularly sampled aperture distribution for a uniform linear array rather than a continu- ous one, we take the required pattern to be repetitive in the u domain, to be given by g (u ) = repU [rect (u /u 0 )] (7.22) so the element weights across the aperture are given by a (x ) = (u 0 /U ) comb1/U sinc (u 0 x ) (7.23) This is a sinc function envelope, with width proportional to 1/u 0 and sampled at intervals 1/U wavelengths, where U is the repetition interval in the u domain. If we take the beam to have an angular width 0 , then the edges of the beam are at ± 0 /2 and the corresponding u 0 value is given by
- Array Beamforming 175 u 0 = 2 sin ( 0 /2) (7.24) [It is important not to put u 0 = sin ( 0 ) because of the nonlinear relationship between the variables. For example, if we chose 0 = 90°, then the first, correct, expression makes u 0 = √2 , while the second makes u 0 = 1; this would actually give a 60-degree beam.] Figure 7.6(a) shows an example of a sector beam generated this way, with the weights applied to the elements shown in Figure 7.6(b). The aperture distribution is a sampled sinc function and, for perfect patterns, extends, in principle, over the whole x -axis. In practice, it is limited to n elements so is effectively gated by a rect function, rect (x /nd ), where d = 1/U is the separation between elements and nd is the effective aperture. In this case, U = 2 and d is a half wavelength. The transform of this rect function is a Figure 7.6 Sixty-degree sector beam from an array of 21 elements: (a) beam pattern; (b) element weights.
- 176 Fourier Transforms in Radar and Signal Processing relatively narrow sinc function; this is convolved with the ideal rectangular pattern given by an infinite array to produce the ripple seen in the figures. The figure is for a nominal 60-degree sector beam (from −30 to +30 degrees) for an array of 21 elements. The side-lobe ripples indicate the width of the natural beam from this aperture—the main-lobe width between the first zeros would be the width of two of these side lobes. With an even number of elements, the distribution is rather different in appearance, with two equal values in the center, but a very similar beam pattern. There is no simple relation between the side-lobe levels and the number of elements (or whether this number is odd or even)— the levels vary with both the number of elements and the beam width. Because of the repetitive form of the response in the u domain, these lobes are the result of summing the convolution ripples of mainly two basic patterns, as given by the continuous aperture, at a separation of U = 1/d , and these may sometimes reinforce and sometimes tend to cancel. The fluctuations (with parameter variation) of these lobes will tend to be greater as the sector width increases and the edges of the beam and its repetition become closer. We also note the appearance of the back lobe in Figure 7.6(a). In many applications, this is undesirable, whether on transmission, when only half the power goes into the forward lobe, or reception, when interference or external field noise will enter through this lobe. This lobe can be removed by mounting a reflecting plane at a quarter wavelength behind the array (Figure 7.7). Combining the direct signal with the reflected one, effectively arriving at a point a half wavelength back, and including the phase change on reflection at a denser medium, the element response becomes of 2 sin [ cos ( )/2] for a signal at angle to broadside. This is in the forward half plane, with (for an infinite plane) no response in the back half plane. This is a pattern with a single broad lobe (Figure 7.7), falling to −3 dB at ±60 degrees, and it increases the directivity of the elements by 6 dB; 3 dB is due to limiting the power to one side of the array, and 3 dB to reducing the beam from a 180-degree semicircle to this 120-degree lobe. Because this response is so flat, it will make very little difference to the shape of sector beams centered at, or near, broadside, though it will more noticeably distort beams steered towards the edges of the forward sector. If we want to steer the beam so that its center is at 1 and its width is still 0 , then its edges are at a = 1 − 0 /2 and b = 1 + 0 /2, and the corresponding u values are u a = sin a and u b = sin b . In this case, the center of the beam in u space is at u 1 = (u b + u a )/2 and its width is u 0 = u b − u a . With these definitions of u 0 and u 1 , the required sector beam pattern is, from (7.22),
- Array Beamforming 177 Figure 7.7 Element response with reflector.
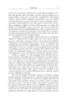
- 178 Fourier Transforms in Radar and Signal Processing g (u ) = repU [rect (u − u 1 )/u 0 ] (7.25) This has the (forward) transform (using R6a) a (x ) = (u 0 /U ) comb1/U [sinc (u 0 x ) exp (−2 ixu 1 )] (7.26) and we see that this requires putting a linear phase slope across the array elements; this corresponds to the effect of the delay across the aperture for a waveform received from (or transmitted to) this direction, causing a phase shift at the carrier frequency f 0 . This requires an infinite aperture; for a finite aperture, we put (7.26) in the alternative form of a finite sum of -functions, as in (7.7) [but weighted by (u 0 /U ) sinc (u 0 kd ) exp (−2 ikdu 1 ) in this case, with d = 1/U ], and carrying out the inverse transform gives (n − 1)/2 u ∑ g (u ) = 0 sinc (u 0 kd ) exp [2 i (u − u 1 )kd ] (7.27) U k = −(n − 1/2) This form of the beam pattern is the alternative, for practical evaluation, to (7.25) with the sinc function convolution due to the finite aperture width incorporated. Figure 7.8 illustrates a steered sector beam with a reflector-backed array. In this case, the beam is formed from a uniform linear array of 12 elements, at half-wavelength spacing, and is 90 degrees wide, centered at 20 degrees. The response with omnidirectional elements is shown (dotted line) for comparison. The reflector removes the back lobe and also distorts the sector beam slightly. The weights are complex, as indicated in (7.26), and as the pattern is specified to be real, the weight distribution, as the transform, has conjugate symmetry, with the real part symmetric and the imaginary part antisymmetric. The sector beams defined so far have the same phase across the sector, so that, when used for transmission, the signal received in the far field will have the same phase at points in all directions at the same distance from the center of the array. If we put a phase slope across the pattern, this will not change the power transmitted in a given direction, but will change the weights required. In this case, let the slope be such as to produce a phase difference of r cycles across a unit range of u , where the phase variation is linear in u space. The required pattern, from (7.25), is now g (u ) = repU {rect [(u − u 1 )/u 0 ] exp (2 iru )} (7.28)
- Array Beamforming 179 Figure 7.8 Steered sector beam with reflector-backed elements: (a) beam patterns; (b) element weights.
- 180 Fourier Transforms in Radar and Signal Processing and the weight function, given by the Fourier transform of (7.28), is a (x ) = (u 0 /U ) comb1/U [sinc (u 0 x ) exp (−2 ixu 1 ) ⊗ (x − r )] (7.29) = (u 0 /U ) comb1/U {sinc [u 0 (x − r )] exp [−2 i (x − r ) u 1 ]} We see that the envelope of the set of -functions from the comb function, which defines the weights on the elements, is shifted by r wave- lengths with this linear phase slope. Figure 7.9(a) shows the array factor for a 60-degree sector beam from an array of 20 elements at half wavelength spacing, steered to broadside. The beam also has a phase slope of one cycle per unit of u (i.e., r = 1), and this requires the sampled sinc function distribution for the weights to be displaced one wavelength from the center of the array, as seen in Figure 7.9(b). As u = ± 1⁄ 2 at ±30 degrees, the phase variation should be 360 degrees across this interval, and this is seen in Figure 7.9(c), which shows the phase relative to that at the center of the beam. The slope varies slightly (because of the finite aperture effect, which causes the amplitude ripples, and also due to the stretching of the pattern in angle space, at higher angle values, compared with u space), but is close to the set value. By splitting the sector into two or more subsectors with linear phase slopes, it is possible to generate beams with more uniform magnitudes, which is desirable for transmitting arrays, with similar power amplifiers on each element. In fact, for a broadside beam from a four-element array, the ampli- tudes can be made identical (though, of course, there is phase variation between elements) using two subsectors. However, there is some beam shape degradation and for larger arrays there is more difficulty in balancing flatness of the weight magnitudes and quality of the sector beam. 7.4 Nonuniform Linear Arrays We have seen that the beam pattern in u space is the (inverse) Fourier transform of the aperture distribution, and we can use the rules and pairs technique for a useful range of distributions, for continuous apertures, and (as demonstrated in Section 7.3) for regularly sampled apertures, correspond- ing to uniform linear arrays. In this case, the regularly sampled aperture is represented as a comb function, for which the transform is known (Rule 8b). However, for nonuniform sampling, no general rule is available and a different approach is required. In this case, given a desired beam shape and a set of element positions, the problem tackled is to find the weights to be
- Array Beamforming 181 Figure 7.9 Sector beam with phase variation across beam: (a) beam pattern; (b) element weights; and (c) relative phase.
- 182 Fourier Transforms in Radar and Signal Processing applied to each element to match the desired pattern in a least squared error sense. This problem is very similar to those of Sections 5.3 and 6.2. For a linear array the aperture distribution is of the form n ∑ a (x ) = a r (x − x r ) r =1 where the n elements are at positions x r , with weights a r . The gain pattern (in u space) is given by the transform of a (x ): n ∑ g (u ) = a r exp (2 ix r u ) (7.30) r =1 Now let g (u ) be a desired beam pattern, not necessarily exactly realizable by any linear combination of the n complex exponentials in (7.30). The question is, now, what is the set of n coefficients a r that gives a least squared error fit to g (u )? Let the error at point u be e (u ), and defining f r (u ) = exp (−2 ix r u ), we have n ∑ e (u ) = g (u ) − a r exp (2 ix r u ) r =1 n ∑ = g (u ) − a r f r * (u ) (7.31) r =1 = g (u ) − f H (u ) a where a and f are n -vectors with components a r and f r (and the raised suffix H indicates complex conjugate transpose). The square modulus of e is | e (u ) | 2 = | g (u ) | 2 − f H (u ) a g (u ) * − g (u ) a H f (u ) + a H f (u ) f (u )H a (7.32) The total squared error as a function of the weights ( a ) is given by the integral of | e (u ) | 2 over the interval I in u over which we want the specified response. In some cases this will be the whole real angle region, from u = −1 to u = +1, but this need not necessarily be the case. The integrated error as a function of the vector a is thus ( a ), given by
CÓ THỂ BẠN MUỐN DOWNLOAD
-
Fourier Transforms in Radar and Signal Processing_5
 22 p |
  46
|
46
|  10
10
-

Fourier Transforms in Radar and Signal Processing_9
15 p | 56
| 8
-

Fourier Transforms in Radar and Signal Processing_6
22 p | 41
| 8
-

Fourier Transforms in Radar and Signal Processing_1
22 p | 69
| 8
-

Fourier Transforms in Radar and Signal Processing_3
22 p | 70
| 6
-
Fourier Transforms in Radar And Signal Processing_ part 8
15 p | 67
| 5
-
Fourier Transforms in Radar And Signal Processing_7
22 p | 40
| 5
-

Fourier Transforms in Radar And Signal Processing_10
15 p | 42
| 4
-

Fourier Transforms in Radar And Signal Processing_4
22 p | 37
| 4
-
Fourier Transforms in Radar And Signal Processing_2
22 p | 46
| 4
-
Fourier Transforms in Radar And Signal Processing_8
22 p | 40
| 3


Chịu trách nhiệm nội dung:
Nguyễn Công Hà - Giám đốc Công ty TNHH TÀI LIỆU TRỰC TUYẾN VI NA
LIÊN HỆ
Địa chỉ: P402, 54A Nơ Trang Long, Phường 14, Q.Bình Thạnh, TP.HCM
Hotline: 093 303 0098
Email: support@tailieu.vn
Giấy phép Mạng Xã Hội số: 670/GP-BTTTT cấp ngày 30/11/2015 Copyright © 2022-2032 TaiLieu.VN. All rights reserved.

