


Impact of human resource management in the new era of outsourcing with reference to auto component industry
lượt xem 1
download
 Download
Vui lòng tải xuống để xem tài liệu đầy đủ
Download
Vui lòng tải xuống để xem tài liệu đầy đủ
The automobile industry has seen phenomenal growth during last two decades or so. It was observed that there was a tremendous pressure on the giants in this field to produce vehicles and fulfill the production processes carried out by these companies.
Bình luận(0) Đăng nhập để gửi bình luận!
Nội dung Text: Impact of human resource management in the new era of outsourcing with reference to auto component industry
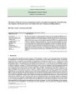
- International Journal of Management INTERNATIONAL (IJM), ISSN 0976 JOURNAL – 6502(Print), ISSN 0976(IJM) OF MANAGEMENT - 6510(Online), Volume 6, Issue 5, May (2015), pp. 25-36© IAEME ISSN 0976-6502 (Print) ISSN 0976-6510 (Online) IJM Volume 6, Issue 5, May (2015), pp. 25-36 © IAEME: http://www.iaeme.com/IJM.asp ©IAEME Journal Impact Factor (2015): 7.9270 (Calculated by GISI) www.jifactor.com IMPACT OF HUMAN RESOURCE MANAGEMENT IN THE NEW ERA OF OUTSOURCING WITH REFERENCE TO AUTO COMPONENT INDUSTRY Dr.Dattatry Ramchandra Mane Associate Professor Department of Management Sciences, University of Pune, Pune ABSTRACT The automobile industry has seen phenomenal growth during last two decades or so. It was observed that there was a tremendous pressure on the giants in this field to produce vehicles and fulfill the production processes carried out by these companies. These changes are distinct from the changes forced by the technological development. Further, these changes have added different dimensions to the traditional approaches in almost every function of the business. Certain new concepts have emerged, such as, Vendor Development, Supply Chain Management, Forward and Backward Integration of the production processes, Outsourcing etc. while introducing each of such new concepts, it has been stated that these concepts will lead to reduction of cost with high quality and greater speed in the production processes. This has led to increase in the number of SSI units supplying materials to these giants. Even the giants have shown interest in starting such a venture. The work load was such heavy that these vendors (i.e. SSI units) have further proceeded for sub- vendor ship. This has led to the creation of multi-layer production process for the production of one unit/part of the unit. The multi-layer, hierarchical process leads to decrease in margin of profit at each such level of process as also reduction in quality, delay in supply and increase in the number of rejections. As Employment generation has been one of the important objectives of development planning in India. This multi layer outsourcing has increased the level of employment as this tier–II and tier-III suppliers do not install high tech machines and hence employees large number of work force. Interest in measuring human capital has also been apparent in India. While the other forms of capital, including material, equipment, tools and technology, only represent inert potentialities, it is the human capital that converts this potential and energizes the creation of wealth.” 25
- International Journal of Management (IJM), ISSN 0976 – 6502(Print), ISSN 0976 - 6510(Online), Volume 6, Issue 5, May (2015), pp. 25-36© IAEME Human Resource Management is the management of an organization's employees. While human resource management is sometimes referred to as a "soft" management skill, effective practice within an organization requires a strategic focus to ensure that people resources can facilitate the achievement of organizational goals. Human Resource Accounting is a method to measure the effectiveness of personnel management activities and the use of people in an organization. HRA is a sophisticated way to measure the effectiveness of personnel management activities and the use of people in an organization. Hence the researcher has decided to probe into the matter such as the qualification and the experience of the workforce (managers, supervisors and operators/workers) employed in these units and does it has any effect on the performance of the organizations. Also the researcher has decided to investigate whether this has any impact on the tier-II certified and non certified suppliers and difference in trend between these two categories. OBJECTIVE OF THE RESEARCH 1) To study outsourcing proportion at each level of outsourcing 2) To study the trend of employment in certified and non certified units 3) To study the quality of workforce employed in these units 4) To study the impact of experience and qualification on rejection levels FORMULATE A RESEARCH DESIGN Review of literature has helped in formulation of objectives. The secondary data was compiled through various magazines and articles. Various websites were also referred. Structured questionnaires were developed and pilot study was carried out to test the reliability of the questionnaire. The data was collected from various Tier1, Tier2 and Tier 3 suppliers from Pimpri Chinchwad MIDC, Bhosari MIDC, Chakan MIDC and Markal MIDC area. Total of 46 Tier-I vendors those supplying directly to the OEMs, 114 of Tier-II vendors supplying to tier-I and approximately 300 Tier-III vendors supplying to tier-II. The data for Tier-III vendor was available with tier-II vendor. The questionnaire for tier-I vendor focused on Quality, Cost, Development and Delivery, Management and Technological aspect. Whereas the questionnaire for tier-II was mainly focused on Outsourcing, Rejection, Certification, Number of processes in a component, maintenance policy etc. UNIVERSE There are close to 400 players in the organized sector i.e. tier-I and over 5,000 in the unorganized sector i.e. tier-II and tier-III. Players in organized sector supply to organized vehicle manufacturers directly. The unorganized sector, on the other hand, mostly has small units, producing low-technology components and supply to tier-I organized supplier and predominantly competing in after-market spare. SAMPLE SIZE 1) 46 number of tier-I manufacturer who falls in organized sector and who supplies to vehicle manufacturer directly. 26
- International Journal of Management (IJM), ISSN 0976 – 6502(Print), ISSN 0976 - 6510(Online), Volume 6, Issue 5, May (2015), pp. 25-36© IAEME 2) 114 number of tier-II manufacturer who falls under unorganized sector and who are suppliers to tier –I manufacturer. 3) Approximately 300 tier-III vendors the information of whom was taken from tier-II suppliers Total sample size organized and unorganized is 46+114+300=460 SAMPLING TECHNIQUE USED It was not possible, nor it was necessary, to collect information from the total population. Instead, a smaller subgroup of the target population or a sample was selected for the purpose of study. Sampling is the strategy of selecting a smaller section of the population that will accurately represent the patterns of the target population at large. The main purpose of the sampling was to improve quality of data by focusing on a smaller group. The research is about Automobile Sector in Pune region. Pune region has been selected as there are plenty of SSI’s in this sector and secondly, the researcher found it convenient to focus on the region on the grounds of vicinity. In the context of the topic, vendors were identified at three different levels. Tier-I- who are direct vendors to the giant’s vehicles manufacturer. Tier-II- Suppliers to Tier –I vendors Tier-III- Supplier to Tier-II vendors It was desirable on the part of the researcher to gather relevant information from all the three categories. Though multi stage sampling is a part of random sampling the researcher has used multistage sampling for non random sampling for Tier-I and Tier-II vendors. Sampling design for Tier-I vendors. • N= 200 approximate • n=46 • Sampling ratio 25% • Method of sampling- Non random- Combination of convenience and Judgmental sampling. Judgmental on the basis of possibility of getting data. Sampling design for Tier-II vendors • N=1000 approximate • n=114 • sampling ratio 11.4% • Sampling technique- Non random- Combination of convenience and Judgmental sampling. Stage I –selection of Tier –I vendors was Non random- Combination of convenience and Judgmental sampling. Stage II – Selection of 114 vendors was done on the basis of recommended by 46 Tier –I vendors. Selection of 2 or 3 vendors was done from each Tier-I vendor. Tier –III vendors around 300 The required information was provided by 114 (Tier-II vendors). As per the availability and convenience DATA COLLECTION Data collection means gathering information to address those critical evaluation questions that you have identified earlier in the evaluation process. There are many methods available to gather information, and a wide variety of information sources. The most important issue was to select the most appropriate information or evidence to answer the questions. 27
- International Journal of Management (IJM), ISSN 0976 – 6502(Print), ISSN 0976 - 6510(Online), Volume 6, Issue 5, May (2015), pp. 25-36© IAEME Taking into consideration all the facts the researcher has used. 1) Questionnaire: A structured questionnaire was prepared. 2) Records: Information, data specifically related to the rejection rate and outsourcing tendency was taken from the records. 3) Individual interviews: Individual’s responses, opinions and views were considered. DATA ANALYSIS AND INTERPRETATION The data so collected was analyzed according to the alternatives of the closed ended questionnaire and interpreted as per the graphical representations provided herewith in the observation Section. Data analysis 1) Proportion of outsourcing done by tier-I suppliers Tier-I Supplier Outsource 120 Operations Outsourced 100 80 60 40 20 0 1 2 3 4 5 Supplier % 11.4 22.7 22.7 31.8 11.4 Outsource % 20 40 60 80 100 After analyzing the data it is observed that out of the total sample of 46 tier-I suppliers, average outsourcing of tier-I suppliers is more than 60 percentage. Hence it can be concluded that tier-I suppliers further outsource 60 percent operations to tier-II suppliers. It is also important to note that 11.4% suppliers do not carry out any operations in house i.e. 100% operations are done by the next tier (outsourced). 2) Outsourcing trend of tier-II certified and non certified suppliers Tier-II Suppliers Outsourcing Trend 80% 71% 74% 70% 60% Percentage 50% In house 40% 29% 26% Outsource 30% 20% 10% 0% Certified Non Certified Category 28
- International Journal of Management (IJM), ISSN 0976 – 6502(Print), ISSN 0976 - 6510(Online), Volume 6, Issue 5, May (2015), pp. 25-36© IAEME After comparing the data for tier-II certified and non certified suppliers it has been observed that percentage of outsourcing is more in case of non certified suppliers than that of certified suppliers. Hence researcher can conclude that the tendency of outsourcing is more in case of tier-II non certified suppliers than that of certified suppliers. 3) Tier wise in house and outsource rejection per operation Tier wise In house and Outsource Rejection Per Operation Rejection Per Operation 7000 5941 6000 4739 5000 4000 In house Rejection 2500 2740 3000 2309 Outsource Rejection 2000 1062 1000 0 Tier-I Tier-II certified Tier-II non certified Tiers After analyzing the data it is observed that rejection is higher for the operations which are outsourced than those which are carried out in house. Further it is also found that at every next tier rejection in both the cases i.e. in-house and outsource is incremental in all the cases. 4) Comparison of proportion of managers to workers in case of certified and non certified suppliers Comparison of Certified and Non Certified suppliers 92 90 100 90 80 Workers in % 70 60 Managers 50 40 Workers 30 20 8 10 10 0 Certified Non Certified After data analysis it is observed that there is not much difference between both the certified and non certified groups. Observation From the data analysis it is observed that there is not much difference in certified and non certified suppliers when it comes to proportion of manager to worker ratio. 29
- International Journal of Management (IJM), ISSN 0976 – 6502(Print), ISSN 0976 - 6510(Online), Volume 6, Issue 5, May (2015), pp. 25-36© IAEME 5) Percentage of permanent workers employed in certified and non certified suppliers Comparison of Certified and Non Certified suppliers 60 55 57 50 45 43 Workers in % 40 Permanent 30 Contractual 20 10 0 Certified Non Certified After comparing the data for certified and non certified suppliers it is found that percentage of permanent workers employed is more in case of non certified suppliers than that of certified suppliers. Observation After data analysis it is observed that percentage of permanent workers is more in case of non certified supplier than that of certified supplier. Comments There is not much difference in certified and non certified suppliers when it comes to proportion of manager to worker. It is found that percentage of permanent workers employed is more in case of non certified suppliers than that of certified suppliers. 6) Qualification of managers (technical/non technical) in both certified and non certified suppliers: Qualification of Manager ( technical / Non Technical) 120 98 100 85 M anagers in % 80 Certified 60 Non Certified 40 15 20 2 0 Technical Non Technical The objective behind collecting the data on educational qualification of the managers was to find out who manages these businesses, what is the proportion of technical people engaged in managing the businesses, how it affects performance of the business. 30
- International Journal of Management (IJM), ISSN 0976 – 6502(Print), ISSN 0976 - 6510(Online), Volume 6, Issue 5, May (2015), pp. 25-36© IAEME After analyzing, and comparing the data for both the groups i.e. certified and non certified suppliers it is observed that 98% managers employed by certified suppliers are technically qualified whereas 85% managers employed by non certified suppliers are technically qualified. Thus it is revealed that certified supplier employ larger number of technical managers than non certified suppliers. Supervisor 7) Qualification of supervisors (technical/non technical) in both certified and non certified suppliers Qualification of Supervisors ( technical / Non Technical) 80 71 70 57 Supervisors in % 60 50 43 Certified 40 29 Non Certified 30 20 10 0 Technical Non Technical After analyzing data for both the groups i.e. certified and non certified suppliers it is observed that 71% supervisors employed by certified supplier are technically qualified whereas only 57% supervisors employed by non certified suppliers are technically qualified. Thus it is revealed that certified supplier employee more number of technically qualified supervisors than non certified suppliers. 7) Qualification of supervisor and rejection Supervisor Technical/Non Technical & Rejection in PPM 20000 17188 Rejection in PPM 15000 11455 10000 5000 0 Non Technical Technical Category After analyzing the data it is observed that those suppliers employing technically qualified supervisors have less rejection than those who are not technically qualified. 31
- International Journal of Management (IJM), ISSN 0976 – 6502(Print), ISSN 0976 - 6510(Online), Volume 6, Issue 5, May (2015), pp. 25-36© IAEME Workers 9) Qualification of workers (technical/non technical) in both certified and non certified suppliers Qualification of Workers ( technical / Non Technical) 80 74 67 70 60 Workers in % 50 Certified 40 33 26 Non Certified 30 20 10 0 Technical Non Technical After analyzing the data for both the groups i.e. certified and non certified suppliers it is observed that only 33% workers employed by certified suppliers are technically qualified whereas only 26% workers employed by non certified suppliers are technically qualified. Thus it is revealed from data analysis that large number of workers employed in both the groups is not technically qualified. 10) Workers qualification and rejection Workers Technical/Non Technical & Rejection in PPM 20000 Rejection in PPM 14365 15000 11525 10000 5000 0 Non Technical Technical Category From the analysis it is observed that technical qualification of workers has a positive impact on reducing rejection. Rejection is less in case of workers who are technically qualified than those who are non technical. Observation It is observed that technically qualified workers helps in reducing rejection. It is also revealed from the data analysis that tendency of employing technically qualified workers is more in case of certified suppliers than that of non certified suppliers. But the proportion of technical to non technical workers is very less which should be improved. 32
- International Journal of Management (IJM), ISSN 0976 – 6502(Print), ISSN 0976 - 6510(Online), Volume 6, Issue 5, May (2015), pp. 25-36© IAEME Comments Certified suppliers employ more number of technical managers than non certified supplier. Certified suppliers employ more number of technically qualified supervisors than non certified suppliers. It is also revealed that technically qualified supervisors have less rejection than those who are not technically qualified. Certified supplier employee more number of technically qualified workers than non technical workers. But it is also observed that proportion of non technical workers employed in both the groups is very high than technically qualified workers. It is also revealed from the data analysis that rejection is less in case of workers who are technically qualified than those who are non technical. 11) Experience of supervisors Experience of Supervisors Supervisor Percentage 40 30 20 10 0 less 1to 3 3 to 5 5 to 10 10 Yrs & certified 0 8.5 20.5 38 33 non certified 0 22 22 30 26 Experience After analyzing the data it if found that certified suppliers employ more number of experienced supervisors than those of non certified suppliers. 12) Experience of supervisor and rejection Tier-II Experience of Supervisor & Rejection PPM Rejectio n in P P M 25000 21176 20000 14854 11507 11381 15000 Rejection PPM 10000 5000 0 1to 3 3 to 5 5 to 10 10 Yrs Yrs Yrs Yrs & above Experience 33
- International Journal of Management (IJM), ISSN 0976 – 6502(Print), ISSN 0976 - 6510(Online), Volume 6, Issue 5, May (2015), pp. 25-36© IAEME After analyzing the data it is observed that as experience of supervisor increases rejection decreases i.e. higher the experience better the quality of the product and lower is the rejection. Workers (Operators) 13) Experience of operator Experience of Operators Operators Percentage 40 20 0 Less 1to 3 3 to 5 5 to 10 10 Yrs & Certified 0 8.5 27.5 34.5 29.5 Non Certified 5.5 16.5 31.5 24 22.5 Experience It has been observed that proportion of experienced operators is more in case of certified suppliers than that of non certified suppliers. 14) Experience of operators and rejection Experience of Operators & Rejection 30000 Percentage 20000 10000 0 Less 1to 3 Yrs 3 to 5 5 to 10 10 Yrs & Rejection PPM Certified 15040 16062 12125 11970 Rejection PPM Non 11666 12777 20094 13461 6100 Certified Experience After analyzing the data it is observed that experience of operator helps in reducing the rejection but after analyzing the data for both the groups separately it is found that certified suppliers have better advantage of experience of operator than non certified supplier. 34
- International Journal of Management (IJM), ISSN 0976 – 6502(Print), ISSN 0976 - 6510(Online), Volume 6, Issue 5, May (2015), pp. 25-36© IAEME 15) Tier-II experience of operators and rejection in PPM Tier-II Experience of Operator & Rejection in PPM 18139 Rejection in PPM 20000 13585 12651 15000 11666 9541 10000 5000 0 Less than 1to 3 Yrs 3 to 5 Yrs 5 to 10 10 Yrs & 1yr Yrs above Experience After analyzing the data it is observed that experience of operator helps in reducing the rejection. Comments Certified suppliers employ more experienced supervisors than the non certified suppliers. It is revealed from data analysis that greater the experience of supervisor lesser is the rejection i.e. higher the experience better the quality of the product and lower is the rejection. Experience of operators is more in case of certified suppliers than that of non certified suppliers. It is revealed from the data that experience of operator helps in reducing the rejection but after analyzing the data for both the groups separately it is found that certified suppliers have better advantage of experience of operator than non certified supplier. FINDINGS 1) When we distinguish managers into technical and non technical educational qualifications, it is found that there is not much difference between non certified suppliers and certified suppliers. It is also found that qualifications of managers have positive impact on quality i.e. technically qualified managers reduce rejection levels. 2) In case of supervisors, it is found that non certified suppliers employ less number of technically qualified supervisors than those of certified suppliers. When we compare the data for rejection with the qualification of the supervisor, it is found that suppliers employing more number of technically qualified supervisors have less rejection levels than the supplier employing non technical supervisor. Hence the researcher can conclude that the technical qualification of supervisors play an important role in reducing rejection. 3) It is found that tier-II certified suppliers employ supervisors with higher experience. It is also revealed from the data that higher the experience, lesser is the rejection. (Certified companies need to have necessary organization and infrastructures, besides many of them are well established, growing, large and providing relatively better packages and facilities. Such companies are able to retain experienced persons). 4) When we compare the rejection with the qualification of the operator, it is observed that suppliers employing large number of technically qualified operators have less rejection than suppliers employing less number of technically qualified operators. From the analysis, it is also found that percentage of supplier employing technically qualified operators is less in case of non certified suppliers, hence rejection is higher. Hence the researcher can conclude that one of the 35
- International Journal of Management (IJM), ISSN 0976 – 6502(Print), ISSN 0976 - 6510(Online), Volume 6, Issue 5, May (2015), pp. 25-36© IAEME reasons, behind higher rejection at non certified suppliers is employment of larger number of non technical operators. (Role of skill, education and experience on quality and productivity is yet to be fully appreciated by many tier II and III vendors). 5) It is observed that operators employed by non certified suppliers are less experienced than those employed by certified suppliers. It is also revealed that rejection is higher in non certified suppliers. (Causes of high employee turnover in non certified company need further investigation). CONCLUSION 1) Rejection and human factors have come under light in respect of qualification and experience of managers, supervisors and operators. Technically qualified supervisors have shown the rejection 11,455 PPM and non technical supervisor have shown rejection 17,188 PPM. This leads to a conclusion that at supervisor level induction should be made of technically sound supervisors. This suggestion is more apt in case of Non Certified Units. REFERENCES 1) Automotive Industries: parts industry being redesigned May, 2005 http://www.google.co.in /search?hl=en&q=Automotive+Industries+%3A+parts +industry + being+ redesigned+ By +Richardson&btnG=Search&meta=&aq=f&oq= http://www.preservearticles. com /201104125287/ employment-generation-in-india.html “Our main asset is our people!” (The need for human resource accounting) Punita Jasrotia/New Delhi) Journal of International Business and Cultural Studies Human Resource Accounting, Page 1 Human resource accounting and international developments: implications for measurement of human capital Maria L. Bullen, Clayton State University, Kel-Ann Eyler, Wesleyan College 2) Dr. Dattatry Ramchandra Mane, “A Study of Auto Component Suppliers with Special Reference to Electrical and Electronic Component Manufacturers” International Journal of Management (IJM), Volume 6, Issue 1, 2013, pp. 686 - 696, ISSN Print: 0976-6502, ISSN Online: 0976-6510. 3) Dr. Dattatry Ramchandra Mane, “A Study on Employment Generation VIA Outsourcing and Areas of Concern For Sustainable Development of Ssi Units” International Journal of Management (IJM), Volume 4, Issue 6, 2013, pp. 52 - 60, ISSN Print: 0976-6502, ISSN Online: 0976-6510. 4) Dr. Dattatry Ramchandra Mane, “To Study The Impact of Multi-Vendor Outsourcing on The Performance of The Suppliers and Rejection Levels” International Journal of Management (IJM), Volume 4, Issue 2, 2013, pp. 273 - 284, ISSN Print: 0976-6502, ISSN Online: 0976-6510. 36
CÓ THỂ BẠN MUỐN DOWNLOAD

-

Economic Impact of Mobile Communications in Sudan
 46 p |
  73
|
73
|  6
6
-

The fourth industrial revolution and challenges for Vietnamese human resources
5 p | 5
| 4
-

The impact of human resource management practices and career satisfaction on employee’s turnover intention
12 p | 45
| 3
-
Analysis the impact of macro factors affect to development of highly qualified human resources in Nam Dinh
20 p | 13
| 2
-
A case study on impacts of human resource management practices on firms’ performance in Vietnamese state – Owned enterprises
8 p | 17
| 2
-

Lecture Managing human resources (6th edition): Chapter 2 - Wayne Cascio
 14 p | 14
| 1
14 p | 14
| 1
-
Foreign employment and its impact on human resource management for supply chains
10 p | 2
| 1
-
The impact of natural resource exploitation on balanced development with modified reproduction scheme based on supply chain management
6 p | 2
| 1
-
Analyzing the impact of significant factors on motivation and accountability of employees in the supply chain of organization
4 p | 1
| 1
-
The impact of total quality management in the supply chain of high schools on performance: A proposed framework
7 p | 4
| 1
-
The impact of supply chain capabilities on the performance of food industry in Thailand
12 p | 2
| 1
-

Green compensation package of HRM framework and its impact on the supply chain management in Bangladeshi manufacturing companies’
9 p | 4
| 1
-
The impact of human resource management practices on employee engagement and moderating role of gender and marital status: An evidence from the Vietnamese banking industry
16 p | 35
| 1
-
Impact of AMO enhancing human resource management practices on sustainable competitive advantage in insurance companies in Qatar
8 p | 6
| 1
-

A study on human resource competencies and employees’ satisfaction – The case of Sunshine group
11 p | 17
| 1
-

Lecture Fundamentals of operations management (4/e): Chapter 13 - Davis, Aquilano, Chase
20 p | 21
| 0
-

Formation of personnel potential through development of human resource for supply chain managements on the example of training program of government
9 p | 2
| 0


Chịu trách nhiệm nội dung:
Nguyễn Công Hà - Giám đốc Công ty TNHH TÀI LIỆU TRỰC TUYẾN VI NA
LIÊN HỆ
Địa chỉ: P402, 54A Nơ Trang Long, Phường 14, Q.Bình Thạnh, TP.HCM
Hotline: 093 303 0098
Email: support@tailieu.vn
Giấy phép Mạng Xã Hội số: 670/GP-BTTTT cấp ngày 30/11/2015 Copyright © 2022-2032 TaiLieu.VN. All rights reserved.

