


Sự hài lòng trong công việc ảnh hưởng tới độ trung thành của nhân viên: Bài học thực tế từ các giáo viên nước ngoài tại Hà Nội
lượt xem 2
download
 Download
Vui lòng tải xuống để xem tài liệu đầy đủ
Download
Vui lòng tải xuống để xem tài liệu đầy đủ
Nghiên cứu này được thực hiện với mục đích xác định sự hài lòng trong công việc ảnh hưởng tới độ trung thành của nhân viên như thế nào, trong trường hợp thực tế của các giáo viên nước ngoài đang làm việc tại Hà Nội, Việt Nam. Mời các bạn tham khảo!
Bình luận(0) Đăng nhập để gửi bình luận!
Nội dung Text: Sự hài lòng trong công việc ảnh hưởng tới độ trung thành của nhân viên: Bài học thực tế từ các giáo viên nước ngoài tại Hà Nội
- Working Paper 2021.2.4.1 - Vol 2, No 4 SỰ HÀI LÒNG TRONG CÔNG VIỆC ẢNH HƯỞNG TỚI ĐỘ TRUNG THÀNH CỦA NHÂN VIÊN: BÀI HỌC THỰC TẾ TỪ CÁC GIÁO VIÊN NƯỚC NGOÀI TẠI HÀ NỘI Vũ Hương Giang1 Sinh viên K56 CTTT Quản trị kinh doanh - Khoa Quản trị Kinh doanh Trường Đại học Ngoại thương, Hà Nội, Việt Nam Trần Minh Thu Giảng viên Khoa Quản trị Kinh doanh Trường Đại học Ngoại thương, Hà Nội, Việt Nam Tóm tắt Nghiên cứu này được thực hiện với mục đích xác định sự hài lòng trong công việc ảnh hưởng tới độ trung thành của nhân viên như thế nào, trong trường hợp thực tế của các giáo viên nước ngoài đang làm việc tại Hà Nội, Việt Nam. Khảo sát được thực hiện với sự giúp đỡ của 300 giáo viên ngoại quốc đang sống tại Hà Nội, sử dụng thang đo Linkert 5 bậc và phương pháp định tinh. Các tác giả đã áp dụng thống kê mô tả và phân tích hồi quy để đánh giá mức độ ảnh hưởng của sự hài lòng trong công việc đối với mức độ trung thành của các giáo viên. Đầu tiên, các tác giả đã tham khảo những công bố liên quan của các học giả trước đó để quyết định bảy yếu tố hài lòng công việc có ảnh hưởng đến sự trung thành của nhân viên. Bảy yếu tố này là: Người giám sát, Đồng nghiệp, Môi trường làm việc, Tiền lương, Sự thăng tiến, Sự ổn định, Sự công nhận. Sau quá trinh phân tích và áp dụng Ma trận Xoay, bảy nguyên tố này được xếp vào ba nhóm chinh, đó là: Yếu tố ngoại vi, Phúc lợi và Sự ổn định. Kết quả của nghiên cứu này thể hiện rằng độ hài lòng, sự giúp đỡ của cấp trên, môi trường làm việc, phúc lợi, tinh ổn định và sự đào tạo có ảnh hưởng tích cực tới lòng trung thành của nhân viên trong tổ chức. Dựa trên kết quả này, nghiên cứu cho rằng để đạt được mức độ trung thành của nhân viên cao, các tổ chức giáo dục cần nâng cao sự hài lòng của nhân viên bằng cách cải thiện môi trường làm việc, mối quan hệ, giúp đỡ của cấp trên và đồng nghiệp, gia tăng phúc lợi và đảm bảo tính ổn định của vị trí công tác trong thời gian dài. Kết quả này đã đóng góp 1 Tác giả liên hệ, Email: vanessagianghvu@gmail.com FTU Working Paper Series, Vol. 2 No. 4 (10/2021) | 1
- to lớn tới những gợi ý của tác giả trong việc quản trị ở các tổ chức đã và đang có ý định tuyển dụng giáo viên, giảng viên ngoại quốc. Từ khóa: Sự trung thành của nhân viên, Hài lòng trong công việc, các yếu tố ảnh hưởng tới sự trung thành của nhân viên, giáo viên nước ngoài, quản lý giáo dục. HOW JOB SATISFACTION IMPACTS EMPLOYEE LOYALT A CASE STUDY OF FOREIGN TEACHERS IN HANOI Abstract This study attempted to measure how job satisfaction impacts employee loyalty of foreign teachers in Hanoi, Vietnam. The survey has been completed with the help of 300 non-Vietnamese teachers living in Hanoi, using 5-point Linkert scale. Quantitative approach was the major method used. The authors have implemented descriptive statistics and regression analysis to evaluate the impacts of job satisfaction on teachers’ loyalty. The authors have first based on previous relevant publications to decide the seven main factors of job satisfaction to impact employee loyalty that are: Supervisors, Colleagues, Working Condition, Pay, Advancement, Security, Recognition. After the analysis progress, these factors are assigned into three main groups by the Rotated Component Matrix, which are: External Factors, Benefits and Security. The findings of this study indicated that the higher levels of satisfaction, supervisor support, working environment, benefits, security, and training were positively associated with the higher level of organizational loyalty. Based on the results of the analysis, this study argued that to achieve high employee loyalty, educational organizations should achieve high level of employee job satisfaction by enhancing working environment quality, supervisors and peers’ support, increasing benefits and secure employees’ positions in a long term. This result has greatly contributed to the authors’ managerial suggestions to organizations that are currently or about to employ foreign teachers and lecturers. Keywords: Employee Loyalty, Job Satisfaction, factors to affect Employee Loyalty, foreign teachers, educational management. 1. Introduction Working as an English language teacher in Vietnam is becoming an increasingly attractive choice for expats, especially English teachers, considering a move to the country, due to the rapid expansion of the Vietnamese economy. There are around 74,000 foreigners working in Vietnam, according to official statistics; however, this figure could be substantially higher if the number of foreigners on tourist visas is included. However, even though the market appears to be promising, it is difficult for schools or English centers in Vietnam to recruit and retain qualified foreign teachers. The authors are motivated to question the employee satisfaction of expats working in Vietnam education because of the low level of employee loyalty among them. This is because employee satisfaction can be a critical component in motivating teachers to remain in their positions. This research can shed light on how employers should treat and motivate their employees in educational organizations to maximize the firms’ productivity. Moreover, this research can help proving that job satisfaction has a close connection to employee loyalty in the Education section, as there are not many publications in Vietnam related to this topic. FTU Working Paper Series, Vol. 2 No. 4 (10/2021) | 2
- This research specifically focuses on foreign teachers’ job satisfaction to give managerial suggestions to elevate employee loyalty. Furthermore, due to time and funding restrictions, this research is only carried out in Hanoi, which is a heavily populous city to which people from everywhere have flocked. Also, the city has a high level of technological adoption and economic development. Hence, results of the survey can be typical for the whole country. This investigation is conducted out from March to May 2021. Qualitative research methods were employed in this investigation. By using convenience sampling, the authors were able to gather information from foreign instructors in Hanoi. In other words, the authors distributed Google Doc Forms to members of the expat teachers' group to solicit their comments on the subject. A subsequent analysis of the data is performed to determine whether an improvement in job satisfaction can be associated with an increase in employee loyalty. The objectives of this research are: - To evaluate if there is a positive relationship between job satisfaction and employee loyalty of foreign teachers in Hanoi; - To classify job satisfactions of foreign teachers in Hanoi at the level of effect; - To give managers’ suggestions to increase employee loyalty based on factors listed above. 2. Literature review 2.1. Job Satisfaction Job satisfaction is any combination of psychological, physiological, and environmental factors that causes a person to honestly claim that they are satisfied with their jobs, which Vroom (1964, 1985) has emphasized the employee's responsibility in the workplace. Job satisfaction is inextricably tied to a person's behavior at work. Spector (1997) identifies three key characteristics of job satisfaction. Job satisfaction is under the influence of a series of factors such as: The nature of work, Salary, Advancement, Opportunities, Management, Work groups and Work conditions. Christen, Lyer and Soberman (2006) have demonstrated that both job factors and problems with role perceptions can affect job performance and job satisfaction. Lawler and Porter's (1967) job satisfaction model, which, unlike the previous model, lays a strong emphasis on the role of rewards on job satisfaction. Minnesota satisfaction survey and index of job descriptions is one of the most frequently used tools to for assessing job satisfaction. This raises concerns about the following characteristics of employment: Co-workers, Achievement, Activity, Advancement, Authority, Company Policies, Compensation, Moral Values, Creativity, Independence, Security, Social Service, Social Status, Recognition, Responsibility, Supervision, Human Relations, Supervision-Technical, Variety, Working Conditions. The Job Description Index is a widely used technique for determining job satisfaction. The job description index considers the following factors: The nature of the work, Compensation and benefits, Attitudes toward supervisors, Relationships with coworkers, and Promotion opportunities. 2.2. Employee Loyalty Employee loyalty (which is often understood as an attitude) to the organization has occasionally been seen as an expectation. Employee loyalty is demonstrated when workers continue to stay with their organizations (Solomon, 1992). They are committed to remain in the organization, and further, they do not actively hunt for other work opportunities and are not FTU Working Paper Series, Vol. 2 No. 4 (10/2021) | 3
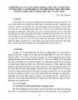
- attentive to job offers (The Loyalty Research Center, 1990). They have a strong belief and acceptance of the organization's goals and principles, as well as a readiness to put up substantial work on behalf of the organization. (Benttencourt, Gwinner and Meuter, 2001). Bateman & Strasser (1984) argue that loyalty is a multi-pronged concept - willingness to work for the organization, its goals and values, and the desire to maintain membership in the organization. Mowday, Steer and Porter (1979) determined attitude and behavioral states related to loyalty, employee's acceptance of the organization's values and goals, and willingness to act on behalf of the organization. Employee loyalty is often assessed using the Loyalty Questionnaire, and when it is not at a high level, it can have significant negative consequences. When Vanderberg and Lance (1992) interviewed 100 information services professionals over the course of five months, they identified a strong association between job satisfaction and employee loyalty. According to their findings, the larger one's level of job happiness, the greater one's level of employee loyalty is. Recent related research and publications Relationship between Job Satisfaction and Employee Loyalty that has been illustrated by various publications in the most recent 10 years below Job satisfaction, employee loyalty and job performance in the hospitality industry: a moderated model Tran and Tran (2020) applied structural equation modelling (SEM) and a multi-group analysis to test four hypotheses, with data from 315 employees of lodging enterprises in Danang city, Vietnam. Empirical results showed that: (1) job satisfaction has a positive direct impact on employee loyalty and job performance; (2) employee loyalty positively affects job performance; and (3) the effect on the relationship between job satisfaction and employee loyalty differs by job position. o Research model: Employee Loyalty H1 Job Satisfaction H3 H2 Job Performance Job Position Figure 1. Job satisfaction, employee loyalty and job performance in the hospitality industry: a moderated model Source: Tran and Tran (2020) Effect of Job Satisfaction to Employee Loyalty at the Oil and Gas Exploration and Production Company in Vietnam FTU Working Paper Series, Vol. 2 No. 4 (10/2021) | 4
- Giao and Vu (2017) examines the impact of factors affecting employee loyalty at Oil and Gas Exploration and Production companies in Vietnam, by surveying 421 employees. The results show that the influence level of 04 factors measuring job satisfaction has a positive influence on employee loyalty to the organization (decreasing importance): Income, Supervision, Colleagues and Nature of Work. o Research model: Income Supervisor Colleagues Employee Loyalty Promotion Nature of work Benefit Figure 2. Effect of Job Satisfaction to Employee Loyalty at the Oil and Gas Exploration and Production Company in Vietnam Source: Giao and Vu (2017) The factors affecting employee’s satisfaction and loyalty: An evidence from people’s committee of Binh Tan district, Ho Chi Minh city, Vietnam Nguyen (2016) includes six variables, including four independent variables (empowerment, salary and rewards, training, and career advancement opportunities), one dependent variable (loyalty) and one intermediate variable (satisfaction), which correspond with five hypotheses. The research is conducted on 170 staffs through a survey by the questionnaires. The results indicated a remarkably positive correlation between satisfaction with salary and rewards as well as a positive relation was also illustrated between the satisfaction with training and empowerment. o Research model: FTU Working Paper Series, Vol. 2 No. 4 (10/2021) | 5
- Empowerment Salary and Rewards Training Career advancement and opportunities Satisfaction Loyalty Figure 3. The factors affecting employee’s satisfaction and loyalty: An evidence from people’s committee of Binh Tan district, Ho Chi Minh city, Vietnam Source: Nguyen (2016) Empirical study of public sector employee loyalty and satisfaction Ali and Coskun, 2011is to identify the factors which determine the level of public employees’ job satisfaction and as result help to have effective and efficient management system in the public sector, in developing countries such as Turkey using SEM platform. o Research model: FTU Working Paper Series, Vol. 2 No. 4 (10/2021) | 6
- Figure 4. Empirical study of public sector employee loyalty and satisfaction Source: Ali and Coskun (2011) 3. Research methodology 3.1. Hypothesis Using Job Description Index and Minnesota Questionnaire, a model of correlation between Job Satisfaction and Employee Loyalty has been formed. Also, this model is strongly inspired by Lester (1987)’s Teacher Job Satisfaction Questionnaire (TJSQ) and other publications that are mentioned below. Job Satisfaction There are 7 factors of Job Satisfaction obtained under the inspiration of Paula E. Lester’s Educational and Psychological Measurement. This is a more advanced and specific scale in comparison with previous studies. However, when Lester chose 9 factors to be analyzed, the authors opted out for 7 factors, which are the most relevant ones for Vietnamese educational environment. These factors are described as follow: a. Supervision (SUP): This factor deals with two aspects of supervision: Supervisory behavior and Interpersonal relationships. The authors decided to examine this factor due to the models created by Giao, Ha Nam Khanh et al. in 2017 (Giao & Vu, 2017) and Lester (1987). b. Colleagues (COL): This factor is also inspired by Giao, Vu (2017) and Lester (1987). This factor refers to group outcomes and goal interdependence, such as: “I like the people with whom I work” or “My colleagues provide me with suggestions or feedback about my teaching.”. FTU Working Paper Series, Vol. 2 No. 4 (10/2021) | 7
- c. Working Conditions (WC): In Giao, Vu (2017) and Lester (1987), this factor contains items that relate to the environmental characteristics of the teaching situation. For instance: “Facility where I teach is good”. Also included in this aspect are items that relate to the school policies’ formation by the administrators (“The administration in my workplace clearly defines and communicates its policies.”). d. Pay (PAY): In Giao, Vu (2017) and Lester (1987), this factor illustrates the financial aspect of teaching. Such items as: “Teacher income is adequate for normal expenses” and “Teaching provides me with financial security” reflect the teacher’s attitudes toward the compensation received for the teaching job. e. Advancement (AD): This factor is inspired by the models examined by Nguyen, Thi Ngoc Diem (Nguyen, 2016) and Lester (1987). This is the opportunity for promotion both in career path and profession development, such as: “Teaching provides an opportunity to advance professionally” and “Teaching provides an opportunity for promotion”. f. Security (SE): This factor was examined in Lester (1987)’s research. This explains the stability or instability within the school organization. (“Teaching provides for a secure future” and “I am afraid of losing my teaching job.”). g. Recognition (REG): This factor, examined in Akman et al. (2011) and Lester (1987) strikes light on some act of notice, blame, praise, or criticism, such as: “I receive full recognition for my successful teaching from my supervisors and colleagues” or “My students appreciate my work.”. Employee Loyalty As employee loyalty is simply demonstrated when workers continue to stay with their organizations (Solomon, 1992); this criterion is described in this research as teachers’ intention to stay. This can be clarified by: “I would continue my job.” Or “I do not have a plan of changing job in the next 6 months.”. In in this research employee loyalty is demonstrated as employees’ willingness to stay with the organization and not having any idea of changing jobs in the next six month. Hypotheses about Relationship between Job Satisfaction factors and Employee Loyalty: H1: Supervision impacts positively on Hanoi foreign teachers’ loyalty. H2: Colleagues impact positively on Hanoi foreign teachers’ loyalty. H3: Working Condition impacts positively on Hanoi foreign teachers’ loyalty. H4: Pay impacts positively on Hanoi foreign teachers’ loyalty. H5: Advancement impacts positively on Hanoi foreign teachers’ loyalty. H6: Security impacts positively on Hanoi foreign teachers’ loyalty. H7: Recognition impacts positively on Hanoi foreign teachers’ loyalty These hypotheses can be demonstrated by the figure 5 below FTU Working Paper Series, Vol. 2 No. 4 (10/2021) | 8
- Figure 5. Hypotheses Source: Authors proposed 3.2. Research Process The study was based on foreign teachers working in Hanoi. The main purpose of the study was to see the impact of job satisfaction on employee loyalty among this group. Therefore, data was collected from the teachers working in various schools throughout the city, from kindergartens to high schools. On this topic, the authors use the method of online questionnaires designed on Google Form, which is spread on Hanoi expats’ groups on Facebook social platform, which can be regarded as convenience sampling. Purpose of investigation: The investigation is designed to collect information related to the factors affecting job satisfaction of foreign teachers working in Hanoi, therefore the relationship between their job satisfaction and employee loyalty can be decided. Subjects of investigation: The subjects being investigated are foreign teachers currently living and working in Hanoi. FTU Working Paper Series, Vol. 2 No. 4 (10/2021) | 9
- Content of the investigation: Based on the research item, the authors have determined the contents of the investigation including factors affecting the job satisfaction and loyalty of expat teachers and the basic information of the investigating subjects. Sample size determination: The size of sample to meet the two requirements at its best is decided by the Cochran (1997) equation. 𝒛𝟐 𝒑(𝟏 − 𝒑) 𝒏= 𝒆𝟐 For n as the sample size to choose Z=1.65 is the threshold value of the standard distribution corresponding to 95% reliability. Due to the nature of p+q=1, q and p will be the largest when p=q=0.5 and the allowing error is 6%. Then the sample size will be at least 189 sample units. The sample size was 300. The participants of this research are foreign teachers working in Hanoi, Vietnam. In addition, the researchers also proposed a sample size-to-number ratio of observed variables in factor analysis. Everitt (1975) proposed a minimum ratio of 10:1. Therefore, the sample size of 300 is of good credibility. Data Summarization: Because the surveys are spread through Google Form, the answers will be exported to Excel with invalid votes removed. Data Encryption: For the convenience of data analysis, all data will be taken to SPSS for encryption, which is specified as Table 1. Table 1. Data Encryption No. Variables Questions Codes 1 Biological sexuality What is your biological sexuality? 1. “Male” 2. “Female” 2 Age group Please identify your age group. 1. “Under 30” 2. “Equal to or over 30” Source: Authors 4. Results After receiving answers from research objects, the authors processed and analyzed the data. The methods of dosing analysis used in the topic include: Descriptive statistics, Analysis of scale reliability, Analysis of Discovery Factor, Regression – Correlation. 4.1. Statistics on teachers’ genders According to the survey’s result, there are 300 legit answers. 123 of which are male, and 177 of which are female teachers. Genders Numbers Proportions (%) Sum. 300 100 Male 123 41 Female 177 59 Table 2. Statistics on teachers’ genders Source: Authors’ research and analysis 4.2. Statistics on teachers’ age groups Foreign teachers seeking jobs in Vietnam are mostly below 30. This can be due to the reason that millennials have stronger tendency to challenge themselves in a new environment. FTU Working Paper Series, Vol. 2 No. 4 (10/2021) | 10
- Age Groups Numbers Proportion (%) Sum 300 100 Below 30 190 63.3 30 or above 30 110 36.7 Table 3. Statistics on teachers’ age groups Source: Authors’ research and analysis 4.3. Scale Reliability The authors examine the confidence index and obtained the result that no observed variables have a total correlation of less than 0.3. So no observation variables in the study model were eliminated. (Supervision) Alpha = 0.921 (Colleague) Alpha = 0.950 (Working Condition) Alpha = 0.926 (Pay) Alpha = 0.923 (Advancement) Alpha = 0.975 (Security) Alpha = 0.834 (Recognition) Alpha = 0.935 (Loyalty) Alpha = 0.621 Table 4. Scale Reliability Inspections Source: Authors’ research and analysis 4.4. Exploratory Factor Analysis (EFA) The results of the analysis show that the component scales are reliable, no observation variables are eliminated. Therefore, all 21 observation variables will be included in the discovery factor analysis to assess the value of the scale. The model is expected to affect the satisfaction of foreign teachers in Hanoi. The authors included all 21 criteria in factor analysis with Principal Component extraction, Varimax rotation, KMO and Bartlett auditing to measure sample compatibility. We have an EFA analysis. Kaiser-Meyer-Olkin Measure of Sampling Adequacy. 0.888 Approx. Chi square 9078.325 Bartlett’s Test Sig. 0.000 Sum of Square Loading 80.052% Table 5. KMO and Barlette’s Test Source: Authors’ research and analysis With a list of recommended indicators, the topic of performing discovery factor analysis with the main method of component analysis and Varimax rotation, the Eigenvalue standard is greater than 1. The results of the analysis (appendix) show that the factor analysis is appropriate because the KMO=0.888 factor satisfies conditions greater than 0.5; Barlett's inspection for P-value (Sig=0.000) infers indicators that are related to each other. In particular, 21 observational variables explain 80,052% of the variables of factors. FTU Working Paper Series, Vol. 2 No. 4 (10/2021) | 11
- Component Variables 1 2 3 COL3 0.928 COL2 0.926 WC2 0.900 WC1 0.900 SUP2 0.897 WC3 0.896 SUP1 0.892 SUP3 0.888 COL1 0.883 AD3 0.947 PAY1 0.938 AD2 0.900 AD1 0.898 PAY3 0.873 REG3 0.854 REG2 0.851 REG1 0.835 PAY2 0.772 SE3 0.896 SE1 0.896 SE2 0.737 a Table 6. Rotated Component Matrix Source: Authors’ research and analysis The Rotated Component Matrix has grouped other variables into three main components, that are showed above. The component 1 and 2 are of the greatest importance, (Ramya & Ali, 2016). The abbreviations in the table above stand for factors that are: Working Conditions (WC), Colleagues (COL), Supervisor (SUP), Advancement (AD), Recognition (REG), Pay (PAY), Security (SE). The numbered factors are the components mentioned in the hypothesis. According to the table above, the variables COL3, COL2, WC2, WC1, SUP2, WC3, SUP1, SUP3, COL1 converge into component 1. This relates to Working Condition, Colleagues and Supervisors. Therefore, this component is named “External Factors” by the authors. Likewise, AD3, PAY1, AD2, AD1, PAY3, REG3, REG2, REG1, PAY2 make up the second component. This group is about Advancement, Pay and Recognition. All of these are factors that contribute to employees’ benefits. Hence, this component can be named “Benefits”. The last component is linked to the sense of being safe at work. “Security” can be placed alone in one group only. From this stage, all the variables should be examined under the name of 3 components that are External Factors, Benefits and Security. The authors measured loyalty via 3 variables: LOY1, LOY2, LOY3. The EFA result table with these three variables is showed below. FTU Working Paper Series, Vol. 2 No. 4 (10/2021) | 12
- Kaiser-Meyer-Olkin Measure of Sampling Adequacy. 0.552 Approx. Chi-Square 32.556 Bartlett's Test of Sphericity df 3 Sig. 0.000 Table 7. KMO and Bartlett's Test of LOY1, LOY2, LOY3 Source: Authors’ research and analysis Component Initial Eigenvalues Extraction Sums of Squared Loadings Total % of Cumulative Total % of Cumulative Variance % Variance % 1 1.376 45.863 45.863 1.376 45.863 45.863 2 .902 30.060 75.922 3 .722 24.078 100.000 Table 8. Total Variance Explained of LOY1, LOY2, LOY3 Source: Authors’ research and analysis According to the results, 3 variables of LOY1, LOY2 and LOY3 can be converted into one variable named Y. Y is also used as a dependent variable in regression model. H1 Benefits (B) Employee H2 External Factors (E) Loyalty (Y) H3 Security (S) Figure 6. Recommended Model after EFA analysis Source: Authors proposed With the proposed model, the authors expect the impact of independent variables on dependent variables as follows: H1: External Factors impact positively on Hanoi foreign teachers’ employee loyalty. When the advantages of external factors increase, employee loyalty increases. H2: Benefits impact positively on Hanoi foreign teachers’ employee loyalty. When benefits increase, employee loyalty increases. H3: Security impacts positively on Hanoi foreign teachers’ employee loyalty. When the security increases, employee loyalty increases. 4.5. Employee Loyalty of teachers of different natural features (Genders & Age groups) With the results of the survey, the authors carried out a number of additional inspections to look for differences in employee loyalty among teacher groups. First of all, the authors calculated the average loyalty score in different natural features. The results are presented in table X below. FTU Working Paper Series, Vol. 2 No. 4 (10/2021) | 13
- Stand Criteria Counts Mean Deviation Genders Male 123 3.2544 0.5240 Female 177 3.2617 0.5894 Age groups Below 30 190 3.2332 0.5130 30 or above 30 110 3.3027 0.6394 Table 9: Employee Loyalty of teachers of different natural features Source: Authors’ research and analysis Overall, all teachers have their employee loyalty higher than 3. There is a slight difference between female and male teacher (3.2617 and 3.2544 respectively). On the side of age, teachers whose ages are above 30 seem to be more loyal than the younger ones. To check if there is any difference between groups’ loyalty, the authors implemented T-test with binary variables (Genders and Age groups). The results are presented as below: Independent Samples Test Levene’s Test for t-test for Equality of Means Equality of Variances 95% Confidence Sig. Mean Std. Error Interval of the F Sig. t df (2-tailed) Difference Difference Difference Lower Upper Equal variances 1.698 .194 -110 298 .912 -.0073047 .0661495 -.1374840 .1228747 assumed Y Equal variances -113 280.508 .910 -.0073047 .0647665 -.1347947 .1201854 not asssumed Table 10. T-test with gender variables Source: Authors’ research and analysis According to the results of table 13, P-value of Levene test is 0.194, which is more than 0.05. Therefore, it can be considered that variables of the 2 gender groups are equal. T-test for equality of means has the P-value equal to 0.912, which is higher than 0.05. Hence, it can be concluded that there is no difference between the two gender groups’ loyalty. Independent Samples Test Levene’s Test for t-test for Equality of Means Equality of Variances 95% Confidence Sig. Mean Std. Error Interval of the F Sig. t df (2-tailed) Difference Difference Difference Lower Upper FTU Working Paper Series, Vol. 2 No. 4 (10/2021) | 14
- Equal - variances 4.289 .039 298 .303 -.0695167 .0673950 -.2021472 .0631137 1.031 assumed Y Equal variances -.973 190.152 .332 -.0695167 .0714246 -.2104030 .0713695 not asssumed Table 11. T-test with age variables Source: Authors’ research and analysis According to the results of table 14, P-value of Levene test is 0.039, which is less than 0.05. Therefore, it can be considered that variables of the 2 gender groups are not equal. T-test for equality of means has the P-value equal to 0.332, which is higher than 0.05. Hence, it can be concluded that there is no difference between the two age groups’ loyalty. 4.6. Pearson Correlation Analysis First, the authors calculated the average score of employee loyalty (Y), External Factors (E), Benefits (B) and Security (S). Y, E, B, S are the results of EFA analysis above. Mean Std. Deviation N Y 3.258700 .5625830 300 E 3.88960 .841861 300 B 3.35757 1.033998 300 S 3.92203 .797018 300 Table 12. Descriptive Statistics Source: Authors’ research and analysis According to table 15, S (Security) has the highest mean, then E (External Factors) and the lowest mean is B (Benefits). These figures indicate that foreign teachers in Hanoi are more satisfied with security, then external factors and lastly, benefits. Moreover, standard deviation of S (Security) is lowest. Hence, there is little fluctuation in teachers’ feeling about security. It is indicated that foreign teachers are not really satisfied with their current salary, promotion or recognition. Y E B S Pearson Correlation 1 .561** .588** .606** Y Sig. (2-tailed) .000 .000 .000 N 300 300 300 Pearson Correlation 1 .194** .259** E Sig. (2-tailed) .001 .000 N 300 300 B Pearson Correlation 1 .275** FTU Working Paper Series, Vol. 2 No. 4 (10/2021) | 15
- Sig. (2-tailed) .000 N 300 Pearson Correlation 1 S Sig. (2-tailed) N **. Correlation is significant at the 0.01 level (2-tailed). Table 13. Pearson Correlations Source: Authors’ research and analysis According to the Pearson analysis, Pearson Correlations between variables External Factors, Benefits, Security with Y are 0.561, 0.588 and 0.606, respectively. Via this result, the relationships between External Factors, Benefits, Security and Y are quite strong (all above 0.05). In which, the relationship between Security and Employee Loyalty is the strongest (0.606), meaning that teachers who are guaranteed about their future are more likely to stay longer with the schools. The relationships between External Factors and Benefits with Loyalty are only lower than Security but are still rather high. Hence, if teachers are given chances to work in a friendly environment, as well as receive good benefits, they will also not have any leaving plan soon. Next, the Pearson Correlation among External Factors, Benefits and Security are rather low (not higher than 0.5). If someone who is satisfied with either one of these factors, they will not necessarily have to enjoy the rest. 4.7. Regression Analysis After the correlation analysis, the authors conducts a revox for dependent variables and independent variables drawn after the EFA discovery factor analysis. Model Summaryb Model R R Square Adjusted R Std. Error of the Durbin-Watson Square Estimate 1 .832a .692 .689 .3139559 1.854 a. Predictors: (Constant), S, E, B b. Dependent Variable: Y ANOVAa Model Sum of Squares df Mean Square F Sig. Regression 65.457 3 21.819 221.360 .000b 1 Residual 29.176 296 .099 Total 94.633 299 a. Dependent Variable: Y b. Predictors: (Constant), S, E, B Table 14. Regression Model Source: Authors’ research and analysis FTU Working Paper Series, Vol. 2 No. 4 (10/2021) | 16
- Coefficientsa Unstandardized Standardized Collinearity Unstandardized t Model Coefficients Coefficients Sig. Statistics Model Coefficients B Std. Error Beta B (Constant) .434 .114 3.805 .000 E .254 .023 .380 11.265 .000 .917 1.091 1 B .221 .018 .406 11.974 .000 .908 1.101 S .280 .024 .396 11.513 .000 .880 1.136 a. Dependent Variable: Y Table 15. Coefficients Source: Authors’ research and analysis According to the result, R2 = 0.692, which means 69.2% of fluctuation of Y can be reasoned by the fluctuation of independent variables (S, E, B - External Factors, Benefits and Security). Therefore, the regression model can be formed as below: 𝒀 = 𝟎. 𝟒𝟑𝟒 + 𝟎. 𝟐𝟓𝟒𝑬 + 𝟎. 𝟐𝟐𝟏𝑩 + 𝟎. 𝟐𝟖𝟎𝑺 Based on ANNOVA table, it can be understood that F=221.360; Sig=0.000 (smaller than 0.05), which indicates that the regression model is reasonable. The Durbin Watson value equals to 1.854 (1
- included Income, and External Factors also hold a meaning of Supervision and Colleagues, the authors of this research can consider taking Nature of Work into studying. Likewise, this research has shared the same idea with the 2016 publication of Nguyen, which indicated a positive correlation between satisfaction with salary and rewards. In this chapter, the authors shall mention some suggestions for managers to increase job satisfaction and then employee loyalty, at acceptable costs. External Factors These factors include Supervision, Colleague relationships and Working Conditions. Both External Factors and Security are factors that can be easily improved at rather low cost. Below are several methods to enhance External Factors at educational workplace. o Smaller teams: The school/center leaders can divide their teachers into smaller teams, which should have friendly meetings on a daily/weekly basis; o Teaching Assistants training: Schools and centers can invest more of their budgets to hire teaching assistants who are fluent in spoken English and have good working attitude; o Annual team-building events: Schools and centers should have a spare sum of money to spent on employees’ annual vacation. Benefits As mentioned in the chapters above, benefits in this research include: Pay, Advancement and Recognition. Out of the three, pay is always a dilemma in which employers and employees always have difficulty compromising. However, there are still ways to increase employees’ benefits without passing company’s annual budget. o Raise awareness amongst employees: In order to encourage employees to connect with their benefits, one of the easiest things to do is to tell them that their benefits are available. For the most part, employees are unaware of their benefits, which can lead to benefits confusion. o Host contests: Competitive contests promote friendly competition and could motivate new employees who have not yet used a benefit to experiment with it for the first time. o Encourage employees to share: Managers can create time away from the employee's benefit program to meet with the workers who are currently using their benefits to talk about their likes and dislikes and the ways they might be able to solve their problems. o Organize trainings: One of the striking features shown in the research is that foreign teachers in Vietnam still want to seek more chances to advance their profession. For instance, the teacher of the year may receive a quarter, a half, or a whole scholarship to further their study, depends on the school’s budget. o Build clear promotion path: It is quite common for schools in Vietnam to consider foreign teachers at temporary workers. Foreign teachers who have extraordinary contribution can be assigned as teaching team leader, or subject leader. o Provide benefits based on buying power: While employers may not be able to increase their budget to offer higher salaries, employers can use their school’s buying power as a consolidated group to offer enticing benefits. Security: FTU Working Paper Series, Vol. 2 No. 4 (10/2021) | 18
- o Encourage healthy habits, races and sexual identities at acceptable levels It is amazing if school leaders can embrace teachers’ healthy habits, skin colors and sexual identity in a supportive way. o Create organization’s support group For many expats living in Hanoi, being sexually harassed, pickpocketed, robbed, etc. are biggest fear to face up to. Building an online support group via school’s intranet, or even social platform such as Facebook, Zalo and Telegram is something of great ease. o Clear, Concise and Consistent Communication Employers should keep employees updated on the company’s position, progress accomplished, issues/challenges, and how they directly contribute to the success of the firm. 6. Conclusion Although there has been some research on job satisfaction and employee loyalty in Vietnam, there has been little in this field of foreign instructors working in Vietnam, notably in Hanoi. To find out whether high levels of job happiness relate to high levels of employee loyalty or vice versa, the authors have conducted this research. Firstly, to explain the relationship between employee job satisfaction and employee loyalty of foreign teachers in Hanoi. Secondly, to explain the relationship between each independent variable and employee loyalty, and how those factors can explain to employee loyalty. Thirdly, to identify which factors (including employee job satisfaction) have the most effect and how much do those factors affect employee loyalty. Also, this study makes some implications about Hanoi education by evaluating the relationships among job satisfaction and employee loyalty. Further study needs to be conducted with a larger sample to get more generalized findings, and the effects of more moderating variables should be investigated to ascertain how different groups perceive job satisfaction, employee loyalty and job performance. References Bateman, T.S. & Strasser, S. (1984), “A longitudinal analysis of antecedents of organizational commitment”, Academy of Management Journal, Vol. 27, pp. 95 – 112. Bettencourt, L.A., Gwinner, K.P. & Meuter, M.L. (2001), “A comparison of attitude, personality, and knowledge predictors of service-oriented organizational citizenship behaviors”, Journal of Applied Psychology, Vol. 86 No. 1, pp. 29 – 41. Christen, M., Iyer, G. & Soberman, D. (2006), “Job Satisfaction, Job Performance, and Effort: A Reexamination Using Agency Theory”, Journal of Marketing, January, Vol. 70, pp. 137 – 150. Cochran, L. (1997), Career counseling: A narrative approach, Sage publications. Everitt, B.S. (1975) “Multivariate analysis: The need for data, and other problems”, The British Journal of Psychiatry, Vol. 126 No. 3, pp. 237 - 240. H, N.K.G. & Vu, T.K.T. (2017), "Ảnh hưởng độ thỏa mãn công việc đến lòng trung thành của nhân viên các công ty tìm kiếm thăm dò khai thác dầu khí tại VN," OSF Preprints wdsgx, Center for Open Science. Khuong, M.N. & Tien, B.D. (2013) “Factors influencing employee loyalty directly and indirectly through job satisfaction–A study of banking sector in Ho Chi Minh City”, International Journal of current research and academic review, Vol. 1 No. 4, pp. 81 - 95. Lawler, E.E. III & Porter, L.W. (1967), “The Effect of Performance on Job Satisfaction”, Industrial Relations, pp. 20 – 28. Lester, E.P. (1987), Educational Psychological Measurement. FTU Working Paper Series, Vol. 2 No. 4 (10/2021) | 19
- Loyalty Research Center (2004), Employee Loyalty Measurement, The Loyalty Research Center Press. Mowday, R.T., Porter, L.W. & Steers, R.M. (1979), “The Measurement of organizational commitment”, Journal of Vocational Behavior, Vol. 14, pp. 224 - 227. Mowday, R.T., Porter, L.W. & Steers, R.M. (1982), Employee Organization linkages, New York: Academic Press Nguyen, D.T.N. (2016), “The Factors Affecting Employee’s Satisfaction And Loyalty: An Evidence From People’s Committee Of Binh Tan District, Ho Chi Minh City, Vietnam Thesis For The Graduation Of Master Programme Of Public Administration”, University of Tampere, https://core.ac.uk/download/pdf/250143528.pdf (Accessed 01 June, 2021). Solomon, C.M. (1992), “The loyalty factor”, Personnel Journal, pp. 52 - 62. Spector, P.E. (1997), Job satisfaction: Application, assessment, causes and consequences, Sage Publications, Inc, Thousand Oaks, CA. The Loyalty Research Center, www.loyaltyresearch, pp. 1 – 5. Tran, T.K.P. & Tran, T.V. (2020), “Job Satisfaction, Employee Loyalty and Job Performance in the Hospitality Industry: A Moderated Model”, Asian Economic and Financial Review, Vol. 10 No. 6, pp. 698 – 713. Turkyilmaz, A., Akman, G., Ozkan, C. & Pastuszak, Z. (2011), "Empirical study of public sector employee loyalty and satisfaction", Industrial Management & Data Systems, Vol. 111 No. 5, pp. 675 - 696. Vanderberg, R.J. & Lance, C.E. (1992) “Examining the Causal Order of Job Satisfaction and Organizational Commitmen’t”, Journal of Management, Vol. 18, No. 1, pp. 153 - 167. Vroom, V.H. (1964), Work and motivation, John Wiley and Sons, New York. FTU Working Paper Series, Vol. 2 No. 4 (10/2021) | 20
CÓ THỂ BẠN MUỐN DOWNLOAD

-

Ảnh hưởng của nhận thức về trách nhiệm xã hội của doanh nghiệp đến hiệu quả công việc và vai trò điều tiết của thu nhập cá nhân
 16 p |
  46
|
46
|  7
7
-
Nghiên cứu mối quan hệ giữa sự công bằng, sự hài lòng trong công việc và hiệu quả làm việc của nhân viên tại các ngân hàng trong khu vực Thành phố Hồ Chí Minh
12 p | 93
| 7
-

Bài giảng Hành vi tổ chức: Bài 3 - ThS. Nguyễn Thanh Hương
35 p | 23
| 6
-

Các nhân tố ảnh hưởng đến sự hài lòng với công việc của công chức tại Bộ Nông - Lâm nghiệp Cộng hòa dân chủ nhân dân Lào
11 p | 15
| 6
-
Các nhân tố ảnh hưởng tới hiệu quả trong công việc của nhân viên: Nghiên cứu tại Công ty Điện lực Bắc Từ Liêm
7 p | 13
| 5
-

Mối quan hệ giữa tính cách cá nhân, vốn tâm lý và sự hài lòng trong công việc đến cam kết gắn bó đối với tổ chức của nhân viên khu vực công - Nghiên cứu trường hợp tỉnh Kiên Giang
19 p | 40
| 5
-

Nghiên cứu sự hài lòng công việc của người lao động tại khu nghỉ dưỡng Sun Spa Reort Quảng Bình giai đoạn 2020-2022
5 p | 27
| 4
-

Sự hài lòng trong công việc, mối quan hệ với cam kết tổ chức và ý định nghỉ việc - Trường hợp các nhân viên kỹ thuật ngành dịch vụ cơ sở hạ tầng công nghệ thông tin
17 p | 45
| 4
-

Mối quan hệ giữa chia sẻ tri thức, sự hài lòng trong công việc và hiệu suất làm việc: Trường hợp các công ty khởi nghiệp trong lĩnh vực du lịch trên địa bàn Thành phố Hồ Chí Minh
16 p | 50
| 4
-

Sự hài lòng trong công việc, lòng trung thành và mức độ gắn kết đối với tổ chức của nhân viên thế hệ Millennials (độ tuổi 20 – 34) trên địa bàn thành phố Hồ Chí Minh
6 p | 44
| 4
-

Ảnh hưởng của lãnh đạo chuyên quyền đến hiệu suất bản thân và sự hài lòng trong công việc: Vai trò điều tiết của trao đổi giữa lãnh đạo - nhân viên, trường hợp nghiên cứu các doanh nghiệp tại Thành phố Hồ Chí Minh
14 p | 14
| 3
-

Tổng quan lý thuyết về sự hài lòng trong công việc: Ý nghĩa lý luận cho các nghiên cứu quản trị liên quan
4 p | 29
| 3
-
Ảnh hưởng của các nhân tố tới sự hài lòng trong công việc của công nhân sản xuất tại các doanh nghiệp khai thác than hầm lò trên địa bàn tỉnh Quảng Ninh
11 p | 48
| 3
-
Ảnh hưởng của sự căng thẳng trong công việc, sự hài lòng về công việc và sự hỗ trợ của tổ chức được nhận thức bởi người lao động đến ý định nghỉ việc của bản thân
15 p | 47
| 3
-

Tác động của đặc điểm tính cách Big – Five và lãnh đạo đạo đức đến sự hài lòng trong công việc, nghiên cứu trường hợp trong các hệ thống siêu thị lớn tại thành phố Hồ Chí Minh
11 p | 27
| 2
-

Sự kiệt sức trong công việc và hành vi công dân tổ chức của nhân viên ngành khách sạn - tiếp cận từ lý thuyết bảo tồn nguồn lực
11 p | 5
| 2
-
Các yếu tố tác động đến sự gắn kết trong công việc của nhân viên khối văn phòng: Nghiên cứu tại Trường Đại học Quốc tế Hồng Bàng
10 p | 5
| 1


Chịu trách nhiệm nội dung:
Nguyễn Công Hà - Giám đốc Công ty TNHH TÀI LIỆU TRỰC TUYẾN VI NA
LIÊN HỆ
Địa chỉ: P402, 54A Nơ Trang Long, Phường 14, Q.Bình Thạnh, TP.HCM
Hotline: 093 303 0098
Email: support@tailieu.vn
Giấy phép Mạng Xã Hội số: 670/GP-BTTTT cấp ngày 30/11/2015 Copyright © 2022-2032 TaiLieu.VN. All rights reserved.

