


A study on the effect of corporate governance and capital structure on firm value in Vietnam
lượt xem 1
download
 Download
Vui lòng tải xuống để xem tài liệu đầy đủ
Download
Vui lòng tải xuống để xem tài liệu đầy đủ
The paper examines the impact of corporate governance (CG), capital structure (CS) on firm value (FV) of firms in Vietnam. The study used different regression methods using the data collected at enterprises listed on the stock market in Vietnam over the period 2008 - 2018, with 2937 observations.
Bình luận(0) Đăng nhập để gửi bình luận!
Nội dung Text: A study on the effect of corporate governance and capital structure on firm value in Vietnam
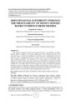
- Accounting 6 (2020) 221–230 Contents lists available at GrowingScience Accounting homepage: www.GrowingScience.com/ac/ac.html A study on the effect of corporate governance and capital structure on firm value in Vietnam Vo Thi Van Khanha, Dang Ngoc Hungb*, Vu Thi Thuy Vanc and Ha Thu Huyend aDoctor of Economics, Business Administration, Academy of Finance, Vietnam bDoctor of Economics, Associate Professor, Hanoi University of Industry, Vietnam cDoctor of Economics, National Economics University, Vietnam dMaster of Economics, Hanoi University of Industry, Vietnam CHRONICLE ABSTRACT Article history: The paper examines the impact of corporate governance (CG), capital structure (CS) on firm value Received February 2 2019 (FV) of firms in Vietnam. The study used different regression methods using the data collected at Received in revised format enterprises listed on the stock market in Vietnam over the period 2008 - 2018, with 2937 observations. February 27 2020 The research results find that the size of the Board of Directors, the independence of the Board of Accepted March 8 2020 Available online Directors, the percentage of women participating in the Board of Directors had a positive influence on March 8 2020 FV. Besides, in the case of the Chairman of the Board of Directors controlling the CEO, the frequency Keywords: of the Board meeting had a negative effect on FV. The study has determined that CS has nonlinear Corporate governance influence on FV, in addition, the research results also prove that firm size had positive relationship to Capital structure FV. The empirical research results are a useful basis to help businesses improve FV, thereby helping Firm value businesses need to consider the elements of the Board of Directors in each enterprise, determine the appropriate capital structure. © 2020 by the authors; licensee Growing Science, Canada 1. Introduction Since the global economic crisis and the collapse of a series of large corporations in the world such as Lehman Brothers, Merrill Lynch, Enrron, CIT Group, etc., CG issues are frequently mentioned and become research focus of businesses around the world. This raises many doubts about the management system and effective disclosure of listed businesses whether transparent, honest and reasonable. Therefore, the relationship between CG and FV has been an issue of great interest to many researchers, especially in developed countries. Black et al. (2006) and Gompers et al. (2003) when studying the impact of CG on company values, found that CG has a significant positive effect on FV. This was also found by Brown and Caylor (2004) when analyzing 2,327 US businesses based on 51 CG elements provided by ISS (Institutional Shareholder Services). Lipton and Lorsch (1992) and Mashayekhi and Bazaz (2008) show that the size of the Board of Directors, inversely correlated with FV, but when companies hire outside directors to run it will increase FV. The relationship between management structure and FV does not seem to be clear in this study. But when the CEO concurrently holds the position of chairman of the enterprise, the impact on FV is negative. This conclusion is found in the studies of Bhagat and Black (2002) and Ehikioya (2009). In developing countries, the issue of the relationship between CG and FV is also being studied and discussed in many developing countries such as the research (Zabri et al., 2016; Arora & Sharma, 2016; Dang et al., 2019). * Corresponding author. E-mail address: hungdangngockt@yahoo.com.vn (D. N. Hung) © 2020 by the authors; licensee Growing Science, Canada doi: 10.5267/j.ac.2020.3.004
- 222 Besides, in business, CS and FV are important and controversial issues in the financial sector. There is a theory that gives a positive relationship between CS and FV but there is a theory that says the opposite, even there is a theory that confirms the two variables are not statistically related (Modigliani & Miller, 1958; Modigliani & Miller, 1963; MC Jensen & Meckling, 1976; Myers, 1977; Myers & Majluf, 1984). This may be due to two issues: first, regarding the selection of the estimated model and the second, regarding the specific characteristics of each model. Therefore, this study was conducted with the objective of examining the relationship between CG, CS and FV to consolidate and supplement the results of previous studies. Based on studies of Black et al. (2006), Gompers et al. (2003), Brown and Caylor (2004), Lipton and Lorsch (1992), Mashayekhi and Bazaz (2008) and Arora and Sharma (2016), we will look at the effects of CG and how CS affects FV. 2. Literature review 2.1. Study the characteristics of corporate governance to firm value The relationship between CG and FV is a topic that many researchers are interested in and there has been a lot of research related to this topic. Some studies use an aggregate set of corporate governance metrics to measure the relationship between corporate governance and FV. The study of Gompers et al. (2003) and Core et al. (2006) developed a management index (G-index) to study this issue. However, most of these studies have analyzed the correlation between firm value and a subset of corporate governance variables such as BOD composition, board size, CEO duality (Bhagat & Black, 2002; Ehikioya, 2009; Lipton & Lorsch, 1992; Mashayekhi & Bazaz, 2008). Determining the appropriate and optimal Board size in an enterprise is a matter discussed in many studies (Mashayekhi & Bazaz, 2008; Ehikioya, 2009; Zabri et al., 2016; Detthamrong et al., 2017). Some researchers think that small-sized companies will increase the efficiency of the company, thereby increasing the firm value. Mashayekhi and Bazaz (2008) argue that smaller boards of directors are more likely to be effective in management and supervision, helping businesses operate more efficiently and increase firm value. Zabri et al. (2016) also supports small-sized BoMs. They argue that this helps to make better decisions because of better coordination between the board members and fewer communication issues. Larger boards often face problems of communication and cohesion among their members, which can lead to conflicts among members. On the other hand, the bigger the type of business and the size of the business, the more CEOs need the advice of many members of the Board. For example, companies operating in different sectors of the economy need to have many discussions and advice from members of the Board of Directors (Ehikioya, 2009; Detthamrong et al., 2017). This will help the company make more accurate decisions. Therefore, the larger the company and the more it operates in many different areas, the larger the size of the board will be, and the larger the number of operations it will need. The independence of the board of directors is shown by the ratio of independent members to the total number of members in the board. Brickley et al. (1994) found a positive relationship between the board's independence of firms and their market value. Mashayekhi and Bazaz (2008) also found similar results when analyzing the relationship between corporate governance indicators and business value in Iran in 2005-2006. These studies suggest that when businesses have multiple independent board members, the goal difference between managers and shareholders is reduced. This makes the operation of the business become more efficient. However, many other studies do not find a clear relationship between board independence and firm performance. Typically, the study of Yermack (1996) shows that the independence of the board does not significantly affect the operations of the business. Fosberg (1989) also did not find any relationship between the percentage of independent board members and the performance of firms. Even the research results of Bhagat and Black (2002) also show a negative correlation between board independence and company values. When members of the Board of Directors meet regularly, they have many discussions on issues in the business, creating better coordination in running as well as performing tasks within the business. This conclusion was drawn from the study of Lipton and Lorsch (1992). Jensen (1993) states that when the board meetings are not held regularly or only when the enterprise is in a difficult situation, it will take the initiative away. Therefore, enterprises cannot make timely adjustments to adapt to market changes. Agreeing with the above studies, Conger et al. (1998) consider that the time and number of board meetings is an important factor to improve operational efficiency. From there, the Board of Directors can make more timely and accurate decisions, help improve operational efficiency and increase firm value. However, Vafeas (1999) notes that regular board meetings will cost the company significant amount of money. For example, travel expenses, remuneration for managers, expenses for board members' time if the meeting is not effective and other costs incurred. The issue of the relationship between the CEO and chairman of the board and the firm value is also a topic of debate among researchers today. Experimental studies on this issue have shown conflicting results. Some of the views that the CEO concurrently holds the position of chairman of the board of directors will help the corporate governance and management system become better so that the operations of the business will be more effective and contribute to improve the firm value. Boyd (1995) also shows that when CEO and chairman of the board actually improve the performance of the company and increase business value. However, many other researchers disagree with this view, and they believe that it is necessary to separate the CEO and chairman of the board of directors (Ehikioya, 2009). The fact that one person plays two roles at the same time will make the corporate governance and administration work overlapping, unclear and in some cases, there may be conflicts within the enterprise. This obviously has a negative impact on the operation of the business. Supporting this view, Rechner and Dalton (1991) suggested that businesses
- V. T. V. Khanh et al. /Accounting 6 (2020) 223 need to separate the position of CEO and chairman of the board of directors. Because when an enterprise has a professional and independent leader, it will help businesses to make more accurate decisions, standardize the management and administration apparatus, and build trust with shareholders. In addition to these two points of view, several studies found no significant difference in performance between firms with CEOs and chairmen and businesses separating these two positions (Daily & Dalton, 1997). In general, the results of previous studies are different but also show a correlation between corporate governance and firm value. Differences in the level and direction of the impact of corporate governance with firm values can be due to many reasons. For example, studies using different data sources (secondary data or survey data). Different methods of measuring business value variables can also make the results of studies different. 2.2. Study capital structure to firm value The research results of CS theories have formed different views on the relationship between CS and FV, that are: (i) CS is not related to FV; (ii) CS has a positive impact on FV; (iii) CS has a negative impact on FV. (i) The studies support the view that CS is not related to FV Representatives who support this view are Modigliani and Miller (1958). Phillips and Sipahioglu (2004) studied the relationship between CS and the financial performance of hotel businesses in the UK. By OLS method, empirical results show that there is no relationship between CS and the rate of return on equity of enterprises. This result is similar to other studies (ElKelish & Marshall, 2007) CS and FV of food businesses in Saudi Arabia in 1996–2000. Jiraporn and Liu (2008), El-Sayed Ebaid (2009) and Ogbulu and Emeni (2012) studied the relationship between CS and FV, the study results show that CS is not related to FV. (ii) The studies support the view that CS has a positive impact on FV This view is evident in the subsequent study of Modigliani and Miller (1963) and has also been validated by the work of Abor (2005). The author studied the impact of capital structure on the profitability of 22 enterprises listed on the Ghana stock market during 1998-2002. The research results show that there is a positive relationship between the debt and return on equity. Margaritis and Psillaki (2007) used a sample of 12,240 companies in New Zealand. The study found that increasing debt led to an increase in firm performance, which showed a positive relationship between capital structure and firm performance. Chowdhury and Chowdhury (2010), Nirajini and Priya (2013) and Mitani and Finance (2014) also show that CS has a positive relationship with firm performance. (iii) Studies supporting the viewpoint that CS has a negative impact on FV The basis of this view is based on the pecking order theory (Myers & Majluf, 1984). According to the pecking order theory, businesses will prioritize the use of internal capital first and issue debt only when the capital demand exceeds the capacity of internal financing. Therefore, high performing businesses often use debt at a low level. The theory of pecking order is also agreed in the studies of some studies (e.g. Booth, Aivazian, Demirguc Kunt, & Maksimovic, 2001; Zeitun & Tian, 2007; Talberg, Winge, Frydenberg, & Westgaard, 2008; Onaolapo & Kajola, 2010; Ruan, Tian, & Ma, 2011; Khan, 2012; Tongkong, 2012). They show that CS and FV are in the opposite relationship. 3. Hypotheses Scale of the Board of Directors (BSIZE) A number of previous studies have shown that councils with more members are less efficient and CEOs have more control over companies. Collaboration and handling of issues that arise on large boards also lead to higher costs and this makes decision making difficult (Anderson & Reeb, 2003; Coles et al., 2008). In addition, a number of other studies also show that small boards reduce the problem of "free riding", thereby helping businesses operate more efficiently and increasing the firm value (Lipton & Lorsch, 1992; Yermack, 1996). In this paper, the board size variable will be measured by the number of board members and expected board size is positively correlated with the firm value. Because differences in table sizes between companies can lead to inaccurate test results, the paper uses the table size square to measure assembly size variable. From the above arguments, the hypothesis about the correlation between board size and firm value is: H1. The size of the board of directors has a positive effect on the firm value. Independence of the Board of Directors (BDIND) John and Senbet (1998) suggested that the board would increase independence by using more independent members of the board. When the business has many independent members of the board of directors, it will reduce the difference in goals between managers and shareholders. This will make the operation of the business become more efficient and increase the firm value. However, a number of other studies have found a negative correlation between board independence and firm value (Bhagat &
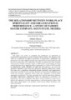
- 224 Black, 2002). Enterprises are now using more and more independent board members to improve the performance of their businesses. Therefore, in this study, the author expects that board independence is positively correlated with firm value. The independence of the board of directors is measured by the proportion of independent members in the board of a business. This ratio is calculated by dividing the number of independent members in the board by the total number of members in the board. In this study, the paper uses the square of the ratio of the independent members of the board to overcome the small difference in the percentage of members. H2. The independence of the board of directors has a positive influence on the firm value. Frequency of meetings of the Board of Directors (BMEET) The board's activity intensity variable is measured according to the frequency of annual meetings. The author uses the square of the board meetings to overcome small differences in this index and avoid deviations in research results. (Conger et al., 1998) suggest that regular management of the board of directors will improve the performance of the company and increase its value. In contrast, Vafeas (1999) argued that board meetings were not always helpful. Board meetings are often costly, time-consuming as well as the remuneration of outsourced directors, etc. From the above arguments, the hypothesis of the correlation between the intensity of the board's operations. and that business value is: H3. The frequency of meetings of the Board of Directors has a positive influence on business value. Concurrent position as chairman of the board of directors and chief executive officer (BDUAL) Ehikioya (2009) points out that conflicts of interest and agency costs are higher when the CEO of a business holds the position of chairman of the board of directors. Therefore, these two positions should be held by two different people. However, Elsayed (2007) argues that the CEO concurrently holds the position of chairman of the board will give the CEO the opportunity to make decisions without having to suffer any undue influence. Based on previous research results, this paper will build the variable of CEO duality as a dummy variable (equal to 1 when the CEO concurrently holds the position of chairman of the board and 0 in the opposite case). . This variable is considered as a parameter of the corporate governance variable. The hypothesis is given that: H4. The duality of the board chairman and the CEO has a negative effect on the firm value. Female member of Board of Directors (BGENR) In studies to understand the influence of female board members on business value, there are studies that have a positive relationship between female board members and business value such as (Catalyst, 2004). However, there are studies with negative results such as (Shrader, Blackburn, & Iles, 1997), or not as influential as research (Rose, 2007). The hypothesis is given that: H5. Female members participating in the Board of Directors have a positive influence on business value. Capital structure (LV) Some studies on capital structure theory such as the classical theory of (Durand, 1952), the capital cost of debt is often "cheaper" than the capital cost of the owner, so enterprises often use debt more. to add value to the business. In addition, the theory of Modigliani and Miller (1958) and Modigliani and Miller (1963) also shows that the debt ratio has a positive relationship to the firm value. However, misuse of financial leverage will cause costs of financial exhaustion and reduce firm value, even leading to bankruptcy. Therefore, when the enterprise uses debt at a high level, creditors and shareholders will require the enterprise to better manage risks. The other people (Hoyt & Liebenberg, 2011) all agree that there is a positive relationship between debt and firm value. The hypothesis is as follows: H6: Capital structure affects and has statistical significance on the firm value. In addition to the independent variables on the research model, control variables are also considered. Some studies (Arora & Sharma, 2016; Hung, Pham, & Ha, 2018; Dang et al., 2019), introduced the control variable as enterprise size (SIZE) . 4. Model and research method 4.1. Model This study uses the regression models proposed by the research to clarify the impact of CG on EQ, of companies as discussed in the literature review, specifically as follows:
- V. T. V. Khanh et al. /Accounting 6 (2020) 225 TOBINQ i,t = β0+ β1 BSIZE i,t + β2 BDIND i,t + β3 BMEET i,t + β4BDUALi,t + β5 BGENR i,t+ β6 LVi,t + β8SIZE i,t + ɛi,t (1) TOBINQ i,t = β0+ β1 BSIZE i,t + β2 BDIND i,t + β3 BMEET i,t + β4BDUALi,t + β5 BGENR i,t + β6 LVi,t + + β7 LV2i,t + β8SIZE i,t + ɛi,t (2) Table 1 Description of variables in the research model Variables Encode Measure Expectations Firm value TOBINQ TOBINQ = (Market capitalization + Liabilities) / Total assets Scale of the Board of Directors BSIZE Number of board members + Number of independent members of the board / Total number of Independence of the Board of Directors BDIND + members of the board Frequency of meetings of the Board of Directors BMEET Number of meetings of the board +/- Concurrent position as chairman of the board of Equals 1 when the CEO concurrently holds the position of chairman of BDUAL - directors and chief executive officer the board and equals 0 in the opposite case Number of female members in the board of directors / Total number of Female member of Board of Director BGENR + board members Capital structure LV Total liabilities / Total assets + 2 Capital structure LV2 (Total liabilities / Total assets) - Firm size SIZE Logarithm base 10 of total assets + 4.2. Research data Researching on the influence of CG on FV of enterprises listed on Vietnam's stock exchange in the period 2008 - 2018 with 2937 observations. The data of these companies is collected at the financial statements of businesses and Vietstock data sets, as well as aggregated from the data published on some reputable securities websites such as cafef.vn or cophieu68.com. The original data will be aggregated and recalculated in the same way of determining variables, in which some variables will be regressed to get the remainder and initialize the corresponding new variable via Stata 14.0 software using the method GLS regression method. 4.3. Research method The baseline analysis was first performed to screen the sample, to eliminate observations that were too large, too small, or too different from the sample size. This basic analysis step helps to check the suitability of the sample before performing regression analysis OLS, FEM, REM, to ensure the reliability of quantitative research results. Specifically, the author group will conduct statistical description analysis, correlation analysis to eliminate multi-collinear phenomena between independent variables. After selecting the appropriate method to run the model, the author will examine the variance of variance, multicollinearity, autocorrelation, endogeneity of the model. In case the model has a defect, the author will use the GLS (Generalized least squares) method and the GMM (Generalized method of moment) method to overcome. 5. Results and Dicussion According to Table 2, the Tobin’q index has an average of 1,133, the highest is 12,962 and the lowest is 0.121, the standard deviation is 0.843. The average number of members on the board is 5.56, the highest is 13 and the lowest is 3. The rate of independent non-executive board members is 68.0%, the lowest is 20% and the highest is 100%. The average number of meetings held by the Board of Directors was 9,925, of which the lowest rate was 1 session and the highest was 78. On average, 24.8% of businesses have a chairman of the board and a general director. The average female member of the board of directors is 15.3%. The capital structure of an enterprise is defined as the average ratio of liabilities to total assets of 50.8%, and the average size of enterprises by assets after logarithm is 11,706. Table 2 Descriptive statistics Variable Obs Mean Std.Dev Min Max TOBINQ 2937 1.133 0.843 0.121 12.962 BSIZE 2937 5.560 1.344 3 13 BIND 2937 0.680 0.175 0.2 1 BMEET 2937 9.925 9.435 1 78 BDUAL 2937 0.248 0.432 0 1 BGENR 2937 0.153 0.176 0 1 LV 2937 0.508 0.214 0.004 0.993 SIZE 2937 11.706 0.688 9.5 14.459 Source: Author calculated from Stata 14.0
- 226 Table 3 presents the autocorrelation matrix, the correlation coefficient between the independent variables in the model does not have any pair greater than 0.8, so it is less likely to occur multi-collinear phenomenon, when using tissue image regression group authors VIF to check. Table 3 Correlation matrix TOBINQ BSIZE BIND BMEET BDUAL BGENR LEV SIZE TOBINQ 1 BSIZE 0.1045 1 BIND 0.1118 0.1702 1 BMEET -0.0664 0.0006 0.0235 1 BDUAL -0.048 -0.053 -0.275 -0.081 1 BGENR 0.0321 0.0061 0.0484 0.0789 0.0123 1 LV -0.1618 -0.023 -0.142 0.1943 0.0025 -0.068 1 SIZE 0.0754 0.3475 0.0448 0.3057 -0.015 -0.081 0.2863 1 Source: Author calculated from Stata 14.0 Table 4, we compare and choose which model is suitable model is FEM or REM. To consider and select the appropriate model between the two regression methods, the author uses the Hausman test presented in section 4.3. Table 4 Regression results of model 1 VIF FEM REM GLS BSIZE 1.2 -0.0361*** -0.0286*** 0.0256** BIND 1.14 0.0615 0.0889 0.316*** BMEET 1.16 0.00294* 0.00215 -0.00725*** BDUAL 1.09 0.0103 0.00401 -0.0631* BGENR 1.03 0.08 0.095 0.166* LV 1.18 0.0803* 0.0466 -0.677*** SIZE 1.41 -0.209*** -0.177*** 0.165*** _cons 3.658*** 3.241*** -0.748*** N= 2937 R-Square = 0.037 F(7.2663) = 14.61 (Prob > F = 0.0000) Wald chi2(7)=79.44 Wald chi2(7) = 179.53 LM test Prob > chi2 = 0.0000 Prob > Chi2 = 0.0000 Hausman test Chi2(7) = 57.29 Prob>chi2 = 0.0000 Modified Wald test Chi2 (267) = 1.1e+06 Prob>chi2 = 0.0000 Wooldridge test F( 1, 266) = 57.345 Prob > F = 0.0000 t statistics in brackets * p
- V. T. V. Khanh et al. /Accounting 6 (2020) 227 Table 5 Results of endogeneity test Dependent variables Checking variables Tests Conclusion Wu-Hausman F test: 0.58494 F(1,2661) P-value = 0.44445 There is no TOBINQ BSIZE endogenous Durbin-Wu-Hausman chi-sq test: 0.58679 Chi-sq(1) P-value = 0.44366 phenomenon Wu-Hausman F test: 0.86867 F(1,2661) P-value = 0.35141 There is no TOBINQ BIND endogenous Durbin-Wu-Hausman chi-sq test: 0.87133 Chi-sq(1) P-value = 0.35059 phenomenon Wu-Hausman F test: 0.78344 F(1,2661) P-value = 0.37617 There is no TOBINQ BMEET endogenous Durbin-Wu-Hausman chi-sq test: 0.78585 Chi-sq(1) P-value = 0.37536 phenomenon Wu-Hausman F test: 0.26706 F(1,2661) P-value = 0.60536 There is no TOBINQ BDUAL endogenous Durbin-Wu-Hausman chi-sq test: 0.26793 Chi-sq(1) P-value = 0.60472 phenomenon Wu-Hausman F test: 0.06205 F(1,2661) P-value = 0.80330 There is no TOBINQ BGENR endogenous Durbin-Wu-Hausman chi-sq test: 0.06226 Chi-sq(1) P-value = 0.80296 phenomenon Wu-Hausman F test: 4.64561 F(1,2661) P-value = 0.03122 There is TOBINQ LV endogenous Durbin-Wu-Hausman chi-sq test: 4.65320 Chi-sq(1) P-value = 0.03100 phenomenon Wu-Hausman F test: 0.45084 F(1,2661) P-value = 0.50199 There is no TOBINQ SIZE endogenous Durbin-Wu-Hausman chi-sq test:0.45229 Chi-sq(1) P-value = 0.50125 phenomenon Source: Author calculated from Stata 14.0 For the concurrent position as chairman of the board of directors and chief executive officer (BDUAL), the results of the study show that the duality of relationship is opposite to FV (TOBINQ) with the corresponding significance level of 1%. , in agreement with the study of Ehikioya (2009) but contrary to the study of Elsayed (2007). For the other two variables, the concurrent position has an opposite relationship to FV but it is not statistically significant, i.e. there is no difference between enterprises with and without CEO concurrently the position of chairman of the board of directors. This is consistent with the study of Daily and Dalton (1997). The female member of the board of directors (BGENR), has a positive relationship to FV when measuring by market value but not statistically significant. This finding is consistent with that of Catalyst (2004). For capital structure factor (LV) affecting FV, it is shown that the relationship between CS and FV is nonlinear relationship. This result is consistent with the theory of trade capital structure (Myers, 1977), but disagree with the empirical research results of Nieh et al. (2008) and Cheng et al. (2010). For control variables, firm size is positively related to firm value, this study is in agreement with the research result of Cuong (2014), Dang et al. (2018) and Ha et al. (2019). Table 6 Regression results by GMM method GMM (Model 1) GMM (Model 2) BSIZE 0.0323*** 0.0126*** BIND 0.400*** 0.342*** BMEET -0.00779*** -0.00601*** BDUAL -0.0444*** -0.0471*** BGENR 0.201*** 0.137*** LV 0.154** 0.4465** LV2 -0.4723** SIZE 0.0801*** 0.0977*** _cons -0.277*** -1.096*** N= 2937 Sargan Test = 0.067 Sargan = 0.345 2937 2937 t statistics in brackets * p
- 228 Firstly, the size of the board of directors has positive effects on the firm's FV. Secondly, the independence of the board has a positive effect on FV when measured by market value. Third, the frequency of meetings of the Board of Directors and the CEO's duality are inversely related to the firm value. At the same time, the results of the study indicated that the presence of female board members had a positive influence on FV. Besides, the research shows that the inherent structure of non-linear relation FV. In summary, the results in this research partly show the relationship between CG, CS and FV in Vietnam and this can help managers and business executives to apply measures. more appropriate and effective governance to contribute to the increase in FV. 6.2. Recommendations The results of the study have shown the existence of CG, CS and FV relationships and the importance of applying effective CG methods and identifying optimal CS for businesses in developing countries. development in general and in Vietnam in particular. The analysis results of the research show that when companies comply and implement CG well, they can make enterprises operate more effectively, reduce the agency cost of the business thereby increasing FV. Businesses in Vietnam are mostly small and medium-sized enterprises, so expanding the board of directors may result in administrative costs, difficulties in unifying and making decisions and can conflicts between members. Therefore, businesses need to build a board suitable to the size of the business. A reasonably sized board can make the coordination among the board members better, helping to supervise and manage more closely. However, as the business grows to a larger scale, operating in more areas, the CEO of the business needs to receive more advice from the members of the board of directors to come up with correct decisions help companies work more efficiently. Meanwhile, the expansion of the board size is an indispensable thing that businesses need to do. But to ensure that the expansion of the board size is effective for businesses, the board members must be competent, experienced and knowledgeable in the field of business operations. Besides, the positive relationship between the independence of the board and the firm value is consistent with the views in representation theory. There is always a conflict of interest between the directors and the shareholders. Directors make actions and decisions for personal gain and do not focus on the goal of maximizing shareholder value and can cause damage to shareholders. Therefore, the Board of Directors was created as a mechanism to oversee the activities of the directors in the company. The more independent the board of directors is, the more effective the monitoring mechanism is, the more effective the business operations will be and increase the enterprise value (according to the market value). Therefore, to strengthen the monitoring mechanism and improve the operational efficiency of the business, it is necessary to increase the independence of the board of directors in the enterprise. Regarding gender of the board, based on the above research results it can be concluded that diversification in the board is a good choice for businesses, but the election and appointment Board members should rely on competencies that will be better for business performance and value for the business. Therefore, increasing the percentage of female members on the board of directors can have an important impact on the business strategy, thereby raising the company's FV. Research results demonstrate that capital structure has a great influence on the price of listed businesses. Therefore, business executives need to pay special attention to debt management accordingly. The results also indicate that there is no optimal capital structure that is applicable to all businesses. Depending on the characteristics of the business line and the characteristics of each company, the chief financial officer can devise a capital structure that maximizes business value. However, businesses also need to consider the burden of interest expenses, interest rate risks, liquidity risks to limit the cost of financial exhaustion that may arise when using a large proportion of liabilities. First of all, businesses should use internal capital by mobilizing from employees in the enterprise, from the unused capital of the business to pay off bank loans. At the same time, businesses need to focus on consolidating the business activities of the business activities to improve operational efficiency. Next, when the business efficiency is improved, the financial situation is better, the enterprise can increase its equity from retained earnings. As the position and competitiveness are gradually raised, businesses can gradually improve the debt usage within the thresholds to invest in business development, by seeking sources that do not require much talent. production assurance. Enterprises should expand the form of joint ventures and partners with both domestic and foreign partners to have more assets, especially fixed assets with modern technology. From there, businesses can take advantage of the management, assets and markets of the partners to enhance the firm value. Acknowledgements We gratefully acknowledge the financial support from the Vietnam National Foundation for Science and Technology Development (NAFOSTED) under Grant Number 502.02-2019.302 References Abor, J. (2005). The effect of capital structure on profitability: an empirical analysis of listed firms in Ghana. The Journal of Risk Finance, 6(5), 438-445. Anderson, R. C., & Reeb, D. M. (2003). Founding‐family ownership and firm performance: evidence from the S&P 500. The Journal of Finance, 58(3), 1301-1328. doi: https://doi.org/10.1111/1540-6261.00567
- V. T. V. Khanh et al. /Accounting 6 (2020) 229 Arora, A., & Sharma, C. (2016). Corporate governance and firm performance in developing countries: evidence from India. Corporate Governance, 16(2), 420-436. doi: https://doi.org/10.1108/CG-01-2016-0018 Bhagat, S., & Black, B. (2002). The non-correlation between board independence and long-term firm performance. Journal of Corporation Law, 27(1), 231-273. Black, B. S., Jang, H., & Kim, W. (2006). Does corporate governance predict firms' market values? Evidence from Korea. The Journal of Law, Economics, and Organization, 22(2), 366-413. doi: https://doi.org/10.1093/jleo/ewj018 Booth, L., Aivazian, V., Demirguc‐Kunt, A., & Maksimovic, V. (2001). Capital structures in developing countries. The Journal of Finance, 56(1), 87-130. doi: https://doi.org/10.1111/0022-1082.00320 Boyd, B. K. (1995). CEO duality and firm performance: A contingency model. Strategic Management Journal, 16(4), 301-312. doi: https://doi.org/10.1002/smj.4250160404 Brickley, J. A., Coles, J. L., & Terry, R. L. (1994). Outside directors and the adoption of poison pills. Journal of Financial Economics, 35(3), 371-390. doi: https://doi.org/10.1016/0304-405X(94)90038-8 Brown, L. D., & Caylor, M. L. (2004). Corporate governance and firm performance. Available at SSRN 586423, 1-52. Catalyst. (2004). The bottom line: Connecting corporate performance and gender diversity: Catalyst. Coles, J. L., Daniel, N. D., & Naveen, L. (2008). Boards: Does one size fit all? Journal of financial economics, 87(2), 329-356. Conger, J. A., Finegold, D., & Lawler, E. E. (1998). Appraising boardroom performance. Harvard business review, 76, 136- 164. Core, J. E., Guay, W. R., & Rusticus, T. O. (2006). Does weak governance cause weak stock returns? An examination of firm operating performance and investors' expectations. The Journal of Finance, 61(2), 655-687. Cuong, N. T. (2014). Threshold effect of capital structure on firm value: Evidence from seafood processing enterprises in the South Central region of Vietnam. International Journal of Finance & Banking Studies, 3(3), 14-29. Cheng, Y.-S., Liu, Y.-P., & Chien, C.-Y. (2010). Capital structure and firm value in China: A panel threshold regression analysis. African Journal of Business Management, 4(12), 2500-2507. Chowdhury, A., & Chowdhury, S. P. (2010). Impact of capital structure on firm’s value: Evidence from Bangladesh. Business and Economic Horizons, 3(3), 111-122. Daily, C. M., & Dalton, D. R. (1997). CEO and board chair roles held jointly or separately: much ado about nothing? Academy of Management Perspectives, 11(3), 11-20. Dang, H. N., Vu, V. T. T., Ngo, X. T., & Hoang, H. T. V. (2019). Study the Impact of Growth, Firm Size, Capital Structure, and Profitability on Enterprise Value: Evidence of Enterprises in Vietnam. Journal of Corporate Accounting & Finance, 30(1), 144-160. Dang, N. H., Pham, D. C., & Vu, T. B. H. (2018). Effects of financial statements information on firms’ value: evidence from Vietnamese listed firms. Investment Management and Financial Innovations, 15(4), 210-218. Detthamrong, U., Chancharat, N., & Vithessonthi, C. (2017). Corporate governance, capital structure and firm performance: evidence from Thailand. Research in International Business and Finance, 42(1), 689-709. Durand, D. (1952). Costs of debt and equity funds for business: trends and problems of measurement. Paper presented at the Conference on research in business finance. Ehikioya, B. I. (2009). Corporate governance structure and firm performance in developing economies: evidence from Nigeria. Corporate Governance: The International Journal of Business in Society, 9(3), 231-243. El-Sayed Ebaid, I. (2009). The impact of capital-structure choice on firm performance: empirical evidence from Egypt. The Journal of Risk Finance, 10(5), 477-487. ElKelish, W. W., & Marshall, A. P. (2007). Financial structure and firm value: empirical evidence from the emerging market of the United Arab Emirates. International Journal of Business Research, 7(1), 69-76. Elsayed, K. (2007). Does CEO duality really affect corporate performance? Corporate Governance: An International Review, 15(6), 1203-1214. Fosberg, R. H. (1989). Outside directors and managerial monitoring. Akron Business and Economic Review, 20(2), 24-32. Gompers, P., Ishii, J., & Metrick, A. (2003). Corporate governance and equity prices. The Quarterly Journal of Economics, 118(1), 107-156. Ha, T. V., Dang, N. H., Tran, M. D., Van Vu, T. T., & Trung, Q. (2019). Determinants Influencing Financial Performance of Listed Firms: Quantile Regression Approach. Asian Economic and Financial Review, 9(1), 78-90. Hoyt, R. E., & Liebenberg, A. P. (2011). The value of enterprise risk management. Journal of Risk and Insurance, 78(4), 795- 822. Hung, D. N., Pham, C. D., & Ha, V. T. B. (2018). Effects of Financial Statements Information on Firms’ Value: Evidence From Vietnamese Listed Firms. Investment Management and Financial Innovations, 15(4), 210-218. Jensen, M. C. (1993). The modern industrial revolution, exit, and the failure of internal control systems. The Journal of Finance, 48(3), 831-880. Jensen, M. C., & Meckling, W. H. (1976). Theory of the firm: Managerial behavior, agency costs and ownership structure. Journal of Financial Economics, 3(4), 305-360. Jiraporn, P., & Liu, Y. (2008). Capital structure, staggered boards, and firm value. Financial Analysts Journal, 64(1), 49-60.
- 230 John, K., & Senbet, L. W. (1998). Corporate governance and board effectiveness. Journal of Banking & Finance, 22(4), 371- 403. Khan, A. G. (2012). The relationship of capital structure decisions with firm performance: A study of the engineering sector of Pakistan. International Journal of Accounting Financial Reporting, 2(1), 245-262. Lipton, M., & Lorsch, J. W. (1992). A modest proposal for improved corporate governance. The Business Lawyer, 48(1), 59- 77. Margaritis, D., & Psillaki, M. (2007). Capital structure and firm efficiency. Journal of Business Finance & Accounting, 34(9‐ 10), 1447-1469. Mashayekhi, B., & Bazaz, M. S. (2008). Corporate governance and firm performance in Iran. Journal of Contemporary Accounting & Economics, 4(2), 156-172. Mitani, H. J. I. R. o. E., & Finance. (2014). Capital structure and competitive position in product market. 29, 358-371. Modigliani, F., & Miller, M. H. (1958). The cost of capital, corporation finance and the theory of investment. The American Economic Review, 48(3), 261-297. Modigliani, F., & Miller, M. H. (1963). Corporate income taxes and the cost of capital: a correction. The American Economic Review, 433-443. Myers, S. C. (1977). Determinants of corporate borrowing. Journal of Financial Economics, 5(2), 147-175. Myers, S. C., & Majluf, N. S. (1984). Corporate financing and investment decisions when firms have information that investors do not have. Journal of Financial Economics, 13(2), 187-221. Nieh, C.-C., Yau, H.-Y., & Liu, W.-C. (2008). Investigation of target capital structure for electronic listed firms in Taiwan. Emerging Markets Finance and Trade, 44(4), 75-87. Nirajini, A., & Priya, K. (2013). Impact of capital structure on financial performance of the listed trading companies in Sri Lanka. International Journal of Scientific Research Publications, 3(5), 1-9. Ogbulu, O. M., & Emeni, F. K. (2012). Capital structure and firm value: Empirical evidence from Nigeria. International Journal of Business and Social Science, 3(19), 252-261. Onaolapo, A. A., & Kajola, S. O. (2010). Capital structure and firm performance: Evidence from Nigeria. European Journal of Economics, Finance and Administrative Sciences, 25, 70-82. Phillips, P. A., & Sipahioglu, M. A. (2004). Performance implications of capital structure: evidence from quoted UK organisations with hotel interests. The Service Industries Journal, 24(5), 31-51. doi: Rechner, P. L., & Dalton, D. R. (1991). CEO duality and organizational performance: A longitudinal analysis. Strategic Management Journal, 12(2), 155-160. d Rose, C. (2007). Does female board representation influence firm performance? The Danish evidence. Corporate Governance: An International Review, 15(2), 404-413. Ruan, W., Tian, G., & Ma, S. (2011). Managerial ownership, capital structure and firm value: Evidence from China’s civilian- run firms. Australasian Accounting, Business Finance Journal, 5(3), 73-92. Shrader, C., Blackburn, V. B., & Iles, P. (1997). Women in management and firm financial performance: An exploratory study. Journal of Managerial Issues, 9(3), 355-373. Talberg, M., Winge, C., Frydenberg, S., & Westgaard, S. J. I. J. o. t. E. o. B. (2008). Capital structure across industries. International Journal of the Economics of Business, 15(2), 181-200. Tongkong, S. (2012). Key factors influencing capital structure decision and its speed of adjustment of Thai listed real estate companies. Procedia-Social Behavioral Sciences, 40, 716-720. Vafeas, N. (1999). Board meeting frequency and firm performance. Journal of financial economics, 53(1), 113-142. Yermack, D. (1996). Higher market valuation of companies with a small board of directors. Journal of Financial Economics, 40(2), 185-211. Zabri, S. M., Ahmad, K., & Wah, K. K. (2016). Corporate governance practices and firm performance: Evidence from top 100 public listed companies in Malaysia. Procedia Economics and Finance, 35(1), 287-296. Zeitun, R., & Tian, G. G. (2007). Capital structure and corporate performance: evidence from Jordan. Australasian Accounting, Business and Finance Journal, 1(4), 40-61. © 2020 by the authors; licensee Growing Science, Canada. This is an open access article distributed under the terms and conditions of the Creative Commons Attribution (CC-BY) license (http://creativecommons.org/licenses/by/4.0/).
CÓ THỂ BẠN MUỐN DOWNLOAD
-

Case Studies on the Effectiveness of State Financial Incentives for Renewable Energy
 128 p |
  66
|
66
|  6
6
-

Modeling the effects of investor sentiment and conditional volatility in international stock markets
22 p | 23
| 6
-
The effect of enterprise risk management implementation on the value of companies listed on the Nairobi stock exchange
25 p | 31
| 4
-

The effects of competition on efficiency: The Vietnamese banking industry experience
31 p | 39
| 3
-

The effect of accounting conservatism on equity valuation: Evidence from corporate life cycle
25 p | 27
| 3
-
The effect of lowballing on auditor independence and audit opinion (Case study at the public accounting office for the special capital region of Jakarta)
10 p | 26
| 2
-
The effect of reward practices on employees’ motivation in banking industry: A comparative study of selected public and private commercial banks in south gondar zone, Ethiopia
17 p | 33
| 2
-
The effect of target federal funds rate changes on the foreign exchange markets: An event study approach
16 p | 21
| 2
-

The effects of leverage and agency costs on firm performance: empirical research on manufacturing firms in Vietnam
16 p | 4
| 2
-
The effects of monetary policy changes on market interest rates in greece: An event study approach
18 p | 69
| 2
-

The effect of domestic currency devaluation on trade balance in ethiopia
12 p | 36
| 1
-
The effect of knowledge management on organizational innovation: Evidence from banking industry
8 p | 22
| 1
-
Does financial flexibility enhance the profitability of money deposit banks? Evidence from Nigeria
8 p | 14
| 1
-
The relationship between work place spirituality and organizational performance a study of farmex mayer company, Ogun state, Nigeria
9 p | 13
| 1
-
The effects of exchange rate volatility on exports in COMESA: A panel gravity model approach
21 p | 15
| 1
-
A study on the effect of productivity on the wage level, with emphasis on the productivity of skilled and unskilled labor
8 p | 37
| 1
-

Clarifying the effect of intellectual capital on firm performance: The case of Vietnam
12 p | 59
| 0


Chịu trách nhiệm nội dung:
Nguyễn Công Hà - Giám đốc Công ty TNHH TÀI LIỆU TRỰC TUYẾN VI NA
LIÊN HỆ
Địa chỉ: P402, 54A Nơ Trang Long, Phường 14, Q.Bình Thạnh, TP.HCM
Hotline: 093 303 0098
Email: support@tailieu.vn
Giấy phép Mạng Xã Hội số: 670/GP-BTTTT cấp ngày 30/11/2015 Copyright © 2022-2032 TaiLieu.VN. All rights reserved.

