http://www.iaeme.com/IJM/index.asp 10 editor@iaeme.com
International Journal of Management (IJM)
Volume 9, Issue 5, Sep–Oct 2018, pp. 10–15, Article ID: IJM_09_05_002
Available online at http://www.iaeme.com/ijm/issues.asp?JType=IJM&VType=9&IType=5
Journal Impact Factor (2016): 8.1920 (Calculated by GISI) www.jifactor.com
ISSN Print: 0976-6502 and ISSN Online: 0976-6510
© IAEME Publication
RELATIONSHIP BETWEEN SERVICE QUALITY
AND CUSTOMER SATISFACTION IN THE
FAMILIAR RETAIL OUTLETS OF CHENNAI
Dr. P.Jayendira Sankar
Assistant Professor, College of Administrative and Financial Sciences AMA International
University, Bldg 829, Road 1213, Blk 712, Salmabad, P.O.Box 18041, Kingdom of Bahrain
ABSTRACT
This study examines the relationship between service quality and customer
satisfaction in the retail sector with a focus on Chennai. A total of 60 respondents
participated in the study. “Research questions and objectives were set, alongside the
hypotheses that were formulated and tested. Descriptive statistics comprising the simple
percentage and tables were used for data presentation and analysis”
[1]
. In identifying
the service quality, the relationship between service quality and customer satisfaction
and also to compare the customer’s importance on every service quality based on
different familiar retail outlets in Chennai of the familiar retail outlets in Chennai. “It
is recommended that organizations should welcome suggestions from customers and
more programmes should be designed to measure service quality and customer
satisfaction”
[1]
.
Keywords: Customer, Service, Customer Satisfaction, Service Quality, Retail Outlets.
Cite this Article: Dr. P.Jayendira Sankar, Relationship between Service Quality and
Customer Satisfaction in the Familiar Retail Outlets of Chennai, International Journal
of Management, 9 (5), 2018, pp. 10–15.
http://www.iaeme.com/ijm/issues.asp?JType=IJM&VType=9&IType=5
1. INTRODUCTION
Service quality today “has become not only the rhetoric of every business enterprise, but also
occupies eminent position in every discourse. No business organization can survive without
building its customer satisfaction and brand loyalty; likewise no organization can make a
healthy living without meeting the needs of its customers. That is what organizations do: they
serve people’s needs. Service quality helps in cementing the relationship between customers
and the organization and it is a two-way flow of value. This means that customer derives real
value from the relationship which translates into value for the organization in the form of
enhanced profitability and sustainability over a long period of time.”
The level of persons felt state resulting from comparing “a product’s perceived performance
or outcome in violation to his/her own expectation. So customer satisfaction could be
considered a comparative behavior between inputs beforehand and post obtainments. As the

Dr. P.Jayendira Sankar
http://www.iaeme.com/IJM/index.asp 11 editor@iaeme.com
study focused on investigating customer satisfaction of the familiar retail outlets, customer
satisfaction is defined as the level of service quality performance that meets customer’s
expectations”.
Chennai's acted as an incubator for the Indian retail industry, with the city witnessing
pioneering initiatives in the retail industry, be it consumer durables, general provisions or
books. The mindset of the retailers especially those involved in organizing retail marketing
needs to understand the role of customers, which will be helpful in the development of the
business. The study focuses on relationship between service quality and customer satisfaction
in the familiar retail outlets of Chennai.
2. REVIEW OF LITERATURE
Zyad, Ali, Bang, & Chanaka, (2018) shows that “service delivery is both complex and
challenging, particularly when considering the unique characteristics of services and the high
level of customer involvement in their creation. The facilitation, transformation and usage
framework identifies how failures can occur at each stage of service delivery, beginning with
the characteristics of the service environment, while control theory offers insights into the
formal and informal controls that may be applied in the facilitation and transformation stages,
which may reduce the likelihood or extent of such failures”
[2]
.
Haemoon, Kawon, (2017) conclude that “the research on these topics has grown constantly
during the period in the hospitality and tourism field, it has declined in the general business
discipline over the same period. Hospitality and tourism research relied heavily on cross-
sectional data through a survey approach, whereas business studies used experimental designs
more frequently. Research on Customer Satisfaction has sustained both interest and
productivity, but research on Service Quality and Customer Value has dwindled over time.
Another notable finding is that most studies are not grounded in strong theories, although
Customer Satisfaction studies tended to be more theory-embedded”
[3]
.
Spacey (2016) discussed that “the different dimensions of service quality include for example
reliability – delivered service is on time and it is what is promised and consistency meaning
that provided service remains rather same each time”
[4]
.
Hamari (2015) given that “the sales of premium products and services on top of the core
freemium service pose many dilemmas, without a valuable and high quality core service users
are less likely to be retained, which further reduces the likelihood of a customer being subjected
to upselling”
[5]
.
Liu, Au, & Choi, (2014) expressed that “the freemiumis considered as a relatively novel
business model for services, similar overlapping developments have existed previously. For
example, providing free samples of a product has generally been considered to affect sales in
one of three ways: accelerating sales, as customers buy the product earlier than they would have
without the free sample; cannibalizing sales, if the free sample reduces purchases; or expanding
sales, when customers buy the product they would not have bought without the free sample”
[6]
.
3. OBJECTIVES OF THE STUDY
The primary objective of the study is to find out the relationship between service quality and
customer satisfaction in the familiar retail outlets of Chennai.
• To identify the service quality (Tangibles, Responsiveness, Reliability, Assurance and
Empathy) of the familiar retail outlets in Chennai.
• To discuss the relationship between service quality and customer satisfaction of familiar retail
outlets in Chennai.
• To compare the customer’s importance on every service quality based on different familiar retail
outlets in Chennai.
Relationship Between Service Quality and Customer Satisfaction In The Familiar Retail Outlets of
Chennai
http://www.iaeme.com/IJM/index.asp 12 editor@iaeme.com
4. RESEARCH METHODOLOGY
The respondents of the study are the consumers of retail outlets in Chennai area. A total of 60
consumers has been divided into 3 different retail outlets in Chennai region, 20 consumer
respondents from Reliance, 20 consumer respondents from More, 20 consumer respondents
from Nilgiri’s to identify the service quality (Tangibles: physical facilities, equipments
provided by the retail outlets, Responsiveness: staff’s willingness to help users or provide
prompt service, Reliability: to provide reliable and accurate service, Assurance: staff
knowledge and courtesy that make users assured and confident, and Empathy: staff’s empathy
to provide concerns or individual attentions), to discuss the relationship between service quality
and customer satisfaction. The Researcher has used Radom sampling as the number of
respondents is very high. Corresponding to each question is five Likert numeric scales of the
following qualitative equivalents as part of the survey questionnaires.
5. DATA ANALYSIS AND DISCUSSION
This chapter represents the analysis and interpretation of result related to the relationship
between service quality and customer satisfaction of familiar retail outlets in Chennai.
Respondents corresponding to each question using the five numeric scales of the following
qualitative equivalents as part of the survey questionnaires: the service quality using tangibles
(TAN 1, TAN 2, TAN 3, and TAN 4), responsiveness (RES 1, RES 2, RES 3 and RES 4),
reliability (REL 1, REL 2, REL 3, and REL 4), assurance (ASU 1, ASU 2, ASU 3, and ASU
4), and empathy (EMP 1, EMP 2, EMP 3, and EMP 4) in order to find the customer satisfaction
of familiar retail outlets in Chennai.
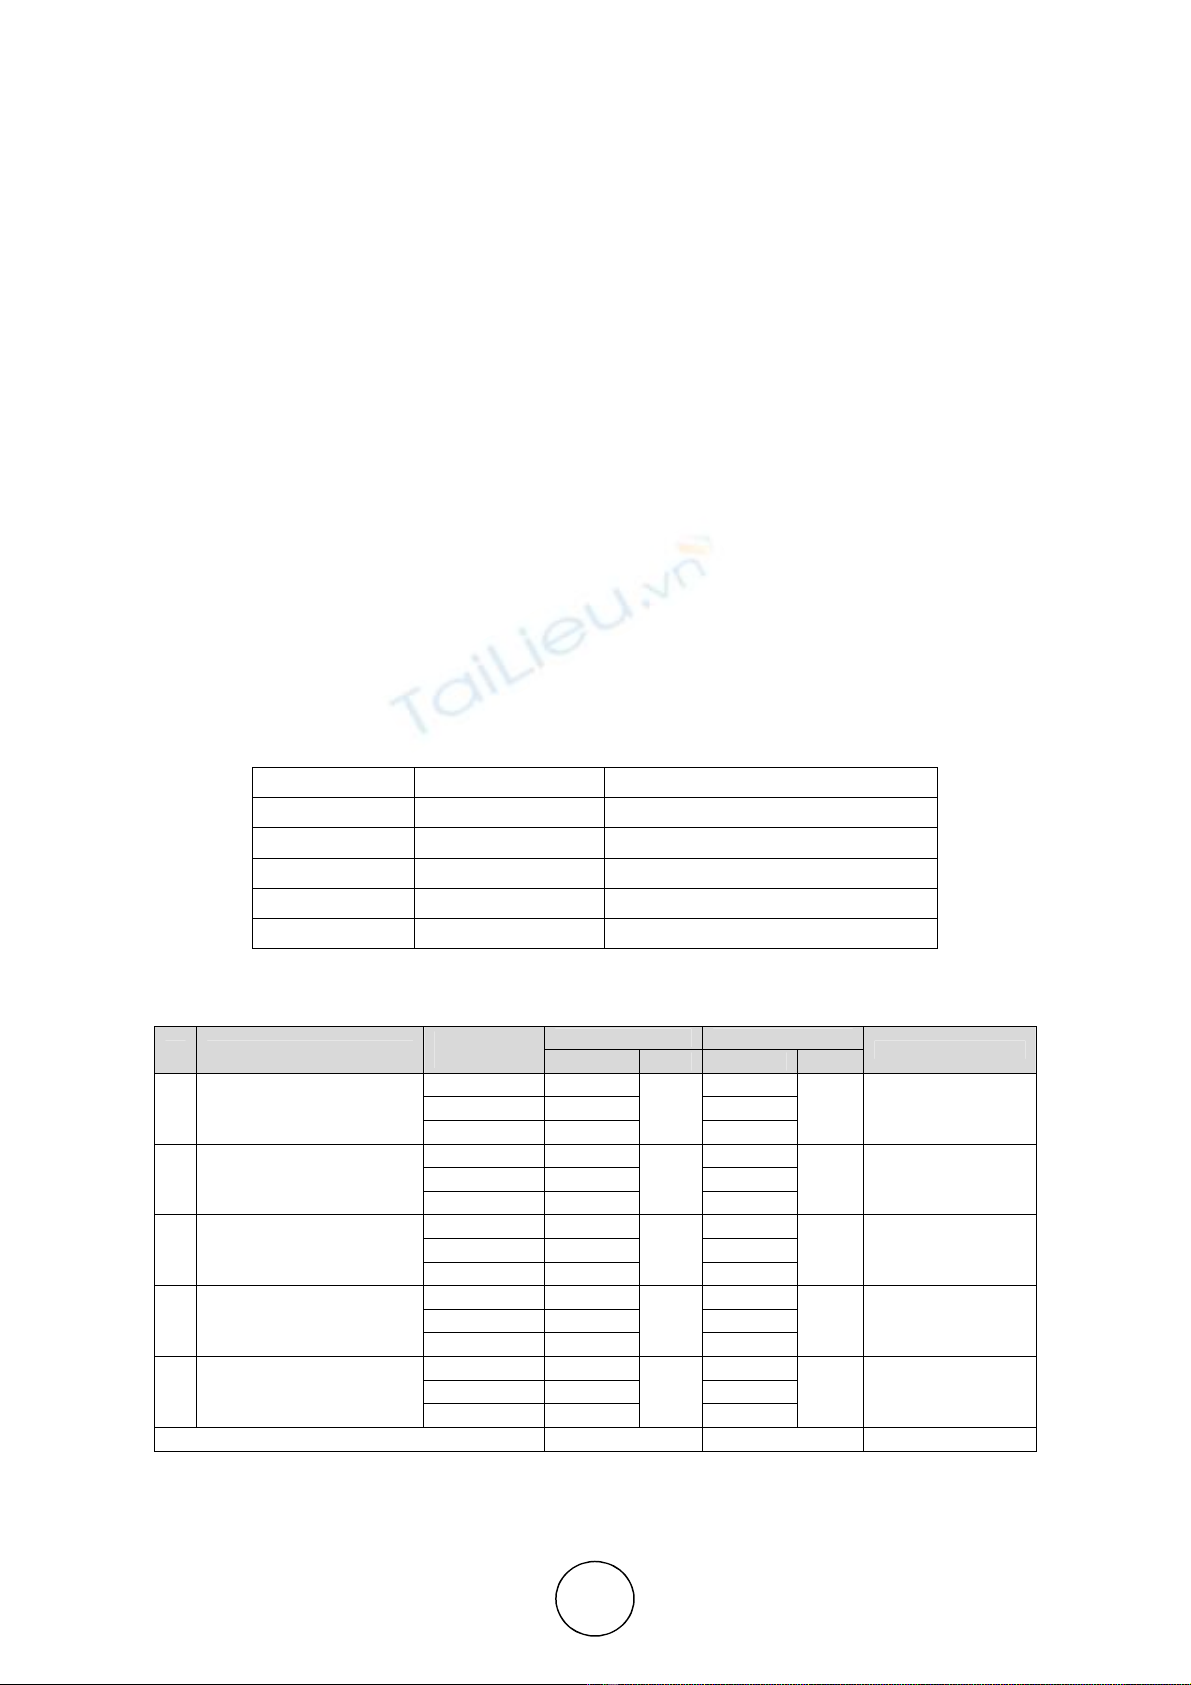
Table 1 Service Quality of The Familiar Retail Outlets In Chennai
A Service Quality Retail
Outlets
Respondents Mean Interpretation
Individual Total Individual Total
1 Tangibles
Tan1, Tan2, Tan3 and Tan4
Reliance 20
60
4.10
4.17 Agree
More 20 4.30
Nilgiri’s 20 4.10
2 Responsiveness
Res1, Res2, Res3 and Res4
Reliance 20
60
4.15
4.23 Strongly Agree
More 20 4.20
Nilgiri’s 20 4.35
3 Reliability
Rel1, Rel2, Rel3 and Rel4
Reliance 20
60
4.25
4.25 Strongly Agree
More 20 4.05
Nilgiri’s 20 4.25
4 Assurance
Asu1, Asu2, Asu3 and Asu4
Reliance 20
60
4.35
4.32 Strongly Agree
More 20 4.20
Nilgiri’s 20 4.40
5 Empathy
Emp1, Emp2, Emp3 and Emp4
Reliance 20
60
4.30
4.32 Strongly Agree
More 20 4.30
Nilgiri’s 20 4.35
Aggregate Mean Score 60 4.26 Strongly Agree
Source: Primary Data
SCALE RANGE DESCRIPTION
5 4.20-5.00 Strongly Agree
4 3.40-4.19 Agree
3 2.60-3.39 Moderately Agree
2 1.80-2.59 Disagree
1 1.00-1.79 Strongly disagree
Dr. P.Jayendira Sankar
http://www.iaeme.com/IJM/index.asp 13 editor@iaeme.com
Table-1 bring out that, the service quality of the familiar retail outlets in Chennai are
strongly agreed by the customer respondents of Reliance store, More store and Nilgiri’s store
with the aggregate mean score of 4.26. Specifically, the customers respondents are agreed with
the tangibility of the familiar retail outlets with the mean score of 4.17 includes TAN 1:
Customer service centers have up-to-date equipments, TAN 2: Physical facilities (like, shelves,
customer service counters, lights) are visually appealing, TAN 3: Employees are well dressed
and appear neat, and Tan 4: When they promise to do something by a certain time, they do.
The customers respondents are strongly agreed with the responsiveness of the familiar retail
outlets with the mean score of 4.23 includes RES 1: When a customer has a problem, they show
a sincere interest in solving it, RES 2: Provider performs the service right the first time, RES 3:
Provides the service at the time they promised to do so, and RES 4: Employees keep their
records accurately.
The customers respondents are strongly agreed with the reliability of the familiar retail
outlets with the mean score of 4.25 includes REL 1: Employees make information easily
obtainable by customers, REL 2: Employees give prompt service to customers, REL 3:
Employees are always willing to help customers, and REL 4: Employees are never too busy to
respond to customers requests.
The customers respondents are strongly agreed with the assurance of the familiar retail
outlets with the mean score of 4.32 includes ASU 1: The behavior of employees instill
confidence in customers, ASU 2: Customers feel safe in their transactions with employees in
the Customer service counters, ASU 3: Employees are polite with customers, and ASU 4:
Employees have the knowledge to answer customers’ questions.
The customers respondents are strongly agreed with the empathy of the familiar retail
outlets with the mean score of 4.32 includes EMP 1: Employees give customers individual
attention, EMP 2: Their operating hours are convenient to all their customers, EMP 3:
Employees give customers personal service, and EMP 4: The employees understand the specific
need of their customer.
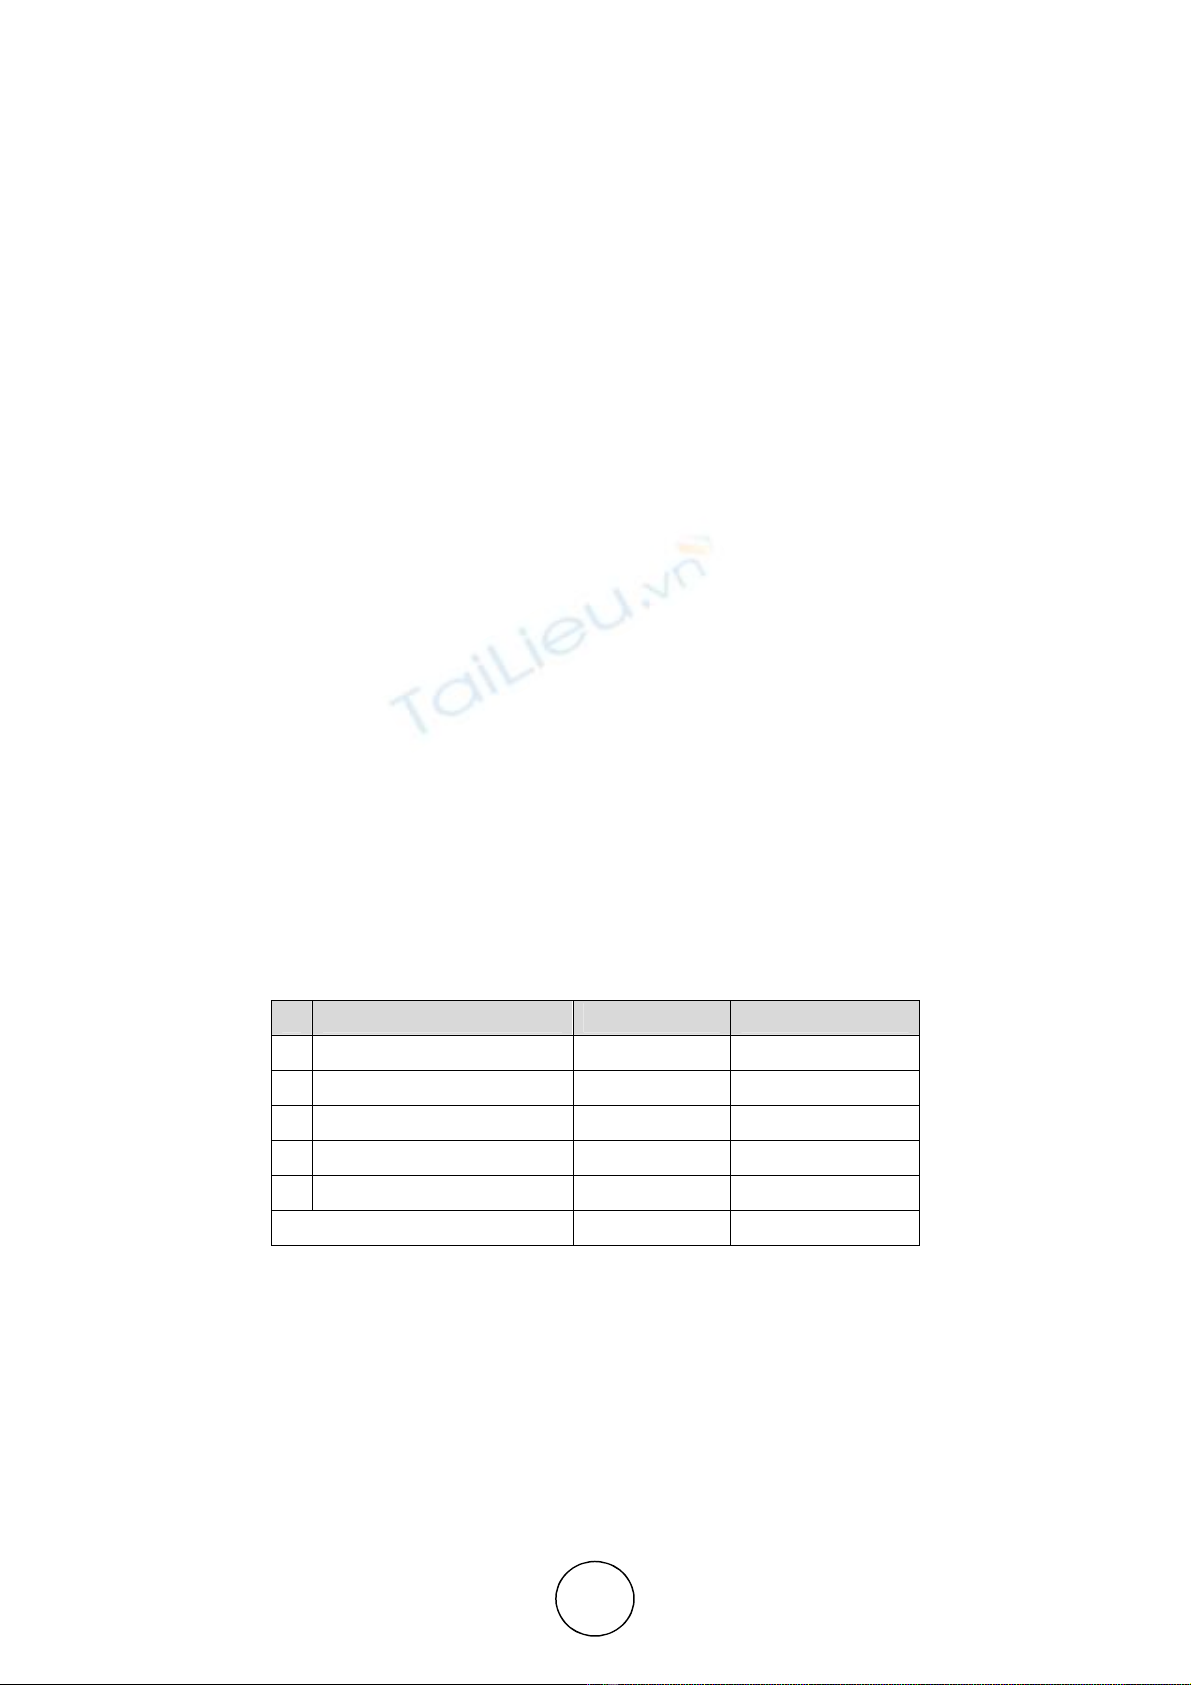
Table 2 Relationship between Service Quality and Customer Satisfaction of The Familiar Retail
Outlets In Chennai
B Customer Satisfaction Mean Interpretation
1 Tangibles 4.15 Satisfied
2 Responsiveness 4.28 Highly Satisfied
3 Reliability 4.25 Highly Satisfied
4 Assurance 4.32 Highly Satisfied
5 Empathy 4.30 Highly Satisfied
Aggregate Mean Scores 4.26 Highly Satisfied
Source: Primary Data
Table-2 infers that, the customer respondents are highly satisfied with the service quality of
the familiar retail outlets of Chennai with the aggregate mean score of 4.26. Specifically, the
customer respondents are satisfied with the tangible service quality of the familiar retail outlets
of Chennai with the mean score of 4.15 (customer service centers have up-to-date equipments,
physical facilities (like, shelves, customer service counters, lights) are visually appealing,
employees are well dressed and appear neat, and when they promise to do something by a
certain time, they do). The customer respondents are satisfied with the responsiveness service
quality of the familiar retail outlets of Chennai with the mean score of 4.28 (when a customer
has a problem, they show a sincere interest in solving it, provider performs the service right the
Relationship Between Service Quality and Customer Satisfaction In The Familiar Retail Outlets of
Chennai
http://www.iaeme.com/IJM/index.asp 14 editor@iaeme.com
first time, provides the service at the time they promised to do so, and employees keep their
records accurately).
The customer respondents are satisfied with the reliability service quality of the familiar
retail outlets of Chennai with the mean score of 4.25 (employees make information easily
obtainable by customers, employees give prompt service to customers, employees are always
willing to help customers, and employees are never too busy to respond to customers requests).
The customer respondents are satisfied with the assurance service quality of the familiar retail
outlets of Chennai with the mean score of 4.32 (the behavior of employees instill confidence in
customers, customers feel safe in their transactions with employees in the customer service
counters, employees are polite with customers, and employees have the knowledge to answer
customers’ questions). The customer respondents are satisfied with the empathy service quality
of the familiar retail outlets of Chennai with the mean score of 4.30 (employees give customers
individual attention, their operating hours are convenient to all their customers, employees give
customers personal service, and the employees understand the specific need of their customer)
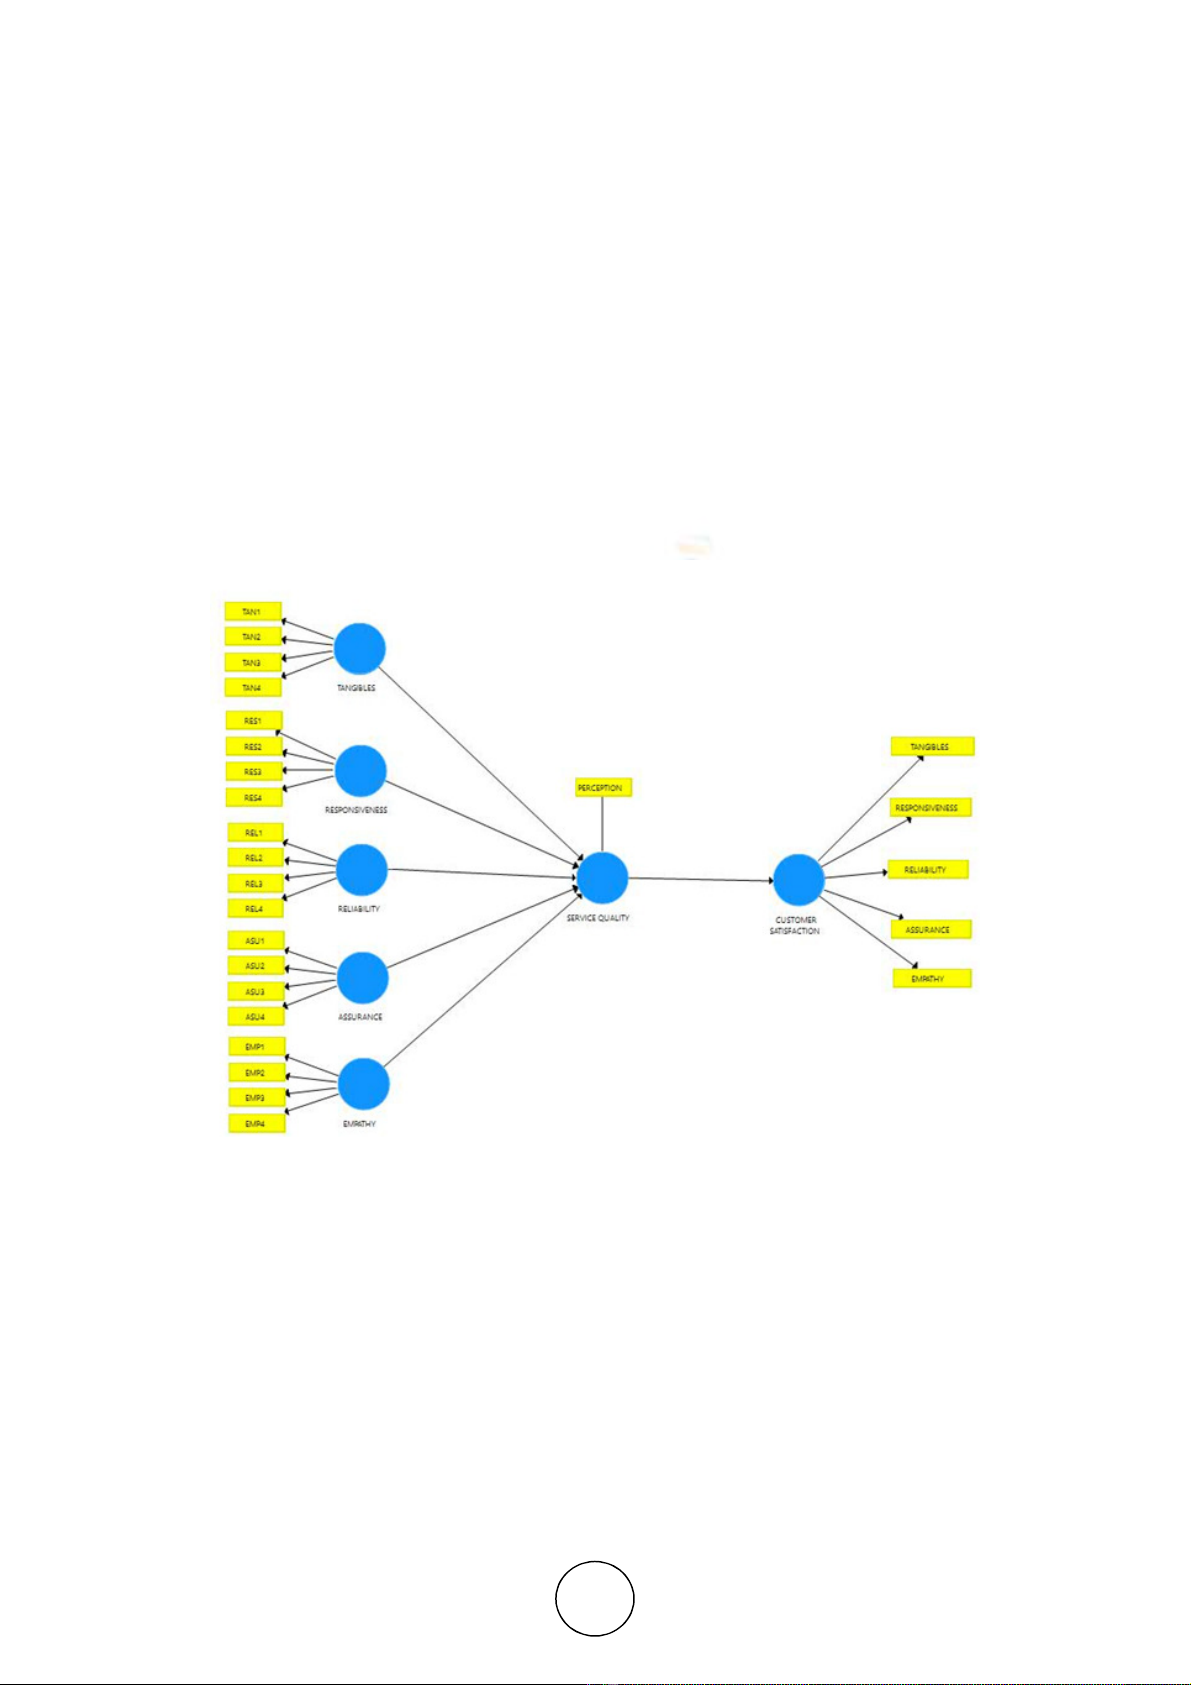
Figure 1 Comparing The Customer’s Importance On Every Service Quality Based On Different
Familiar Retail Outlets In Chennai
Source: Primary Data (Smart PLS 3)
Figure-1 represents that, the perception of the service quality is decided based on the
individual variables like tangibles (TAN 1, TAN 2, TAN 3, and TAN 4), responsiveness (RES
1, RES 2, RES 3 and RES 4), reliability (REL 1, REL 2, REL 3, and REL 4), assurance (ASU
1, ASU 2, ASU 3, and ASU 4), and empathy (EMP 1, EMP 2, EMP 3, and EMP 4) in
relationship between the dependent variable of customer satisfaction.
5. CONCLUSION
The main purpose of this study was to assess the relationship between service quality and
customer satisfaction in the familiar retail outlets of Chennai. The general objective of this study
is to determine the relationship between service quality and customer satisfaction, and also